%reads the image in name.tif into I
%creats a new figure window
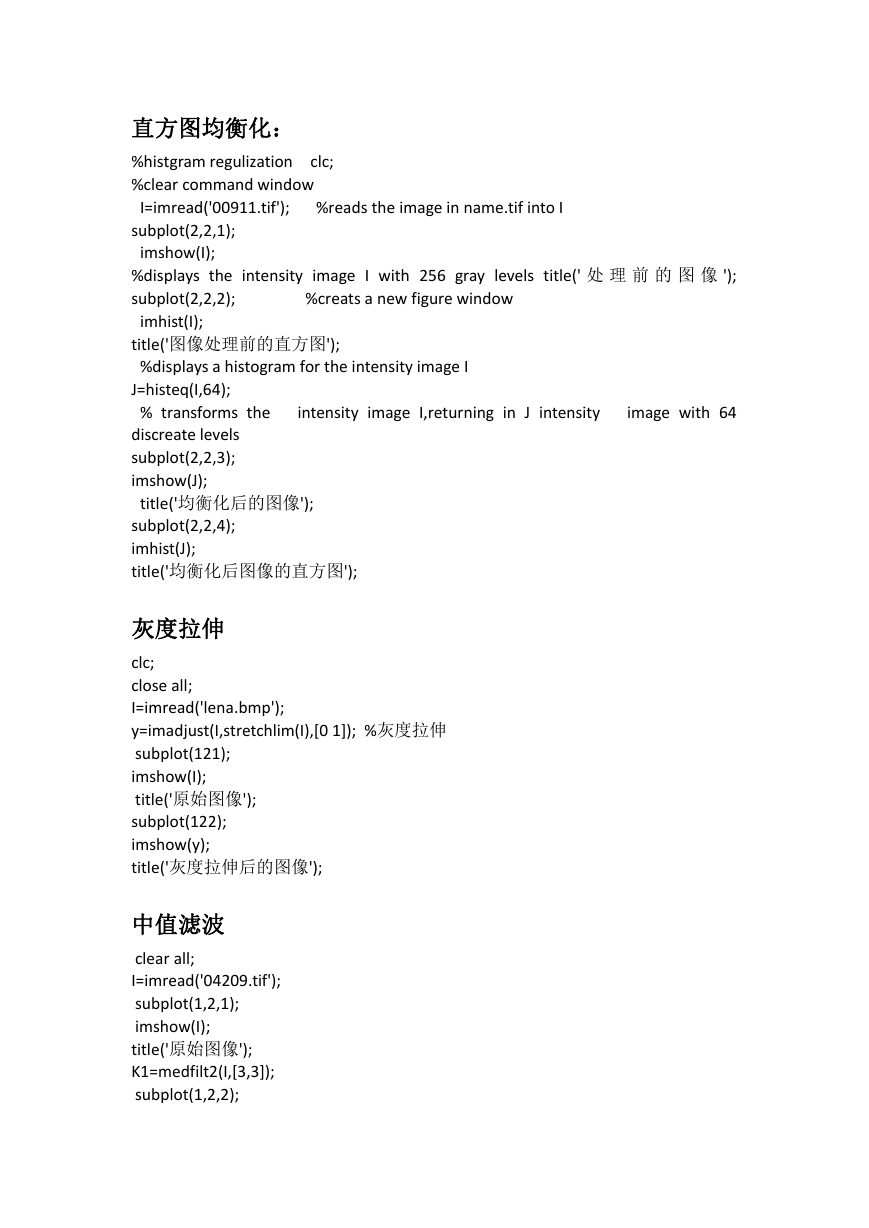
直方图均衡化:
%histgram regulization clc;
%clear command window
I=imread('00911.tif');
subplot(2,2,1);
imshow(I);
%displays the intensity image I with 256 gray levels title(' 处 理 前 的 图 像 ');
subplot(2,2,2);
imhist(I);
title('图像处理前的直方图');
%displays a histogram for the intensity image I
J=histeq(I,64);
% transforms the
discreate levels
subplot(2,2,3);
imshow(J);
title('均衡化后的图像');
subplot(2,2,4);
imhist(J);
title('均衡化后图像的直方图');
intensity image I,returning in J intensity
image with 64
灰度拉伸
clc;
close all;
I=imread('lena.bmp');
y=imadjust(I,stretchlim(I),[0 1]); %灰度拉伸
subplot(121);
imshow(I);
title('原始图像');
subplot(122);
imshow(y);
title('灰度拉伸后的图像');
中值滤波
clear all;
I=imread('04209.tif');
subplot(1,2,1);
imshow(I);
title('原始图像');
K1=medfilt2(I,[3,3]);
subplot(1,2,2);
�
imshow(K1);
title('3*3 中值滤波后的结果');
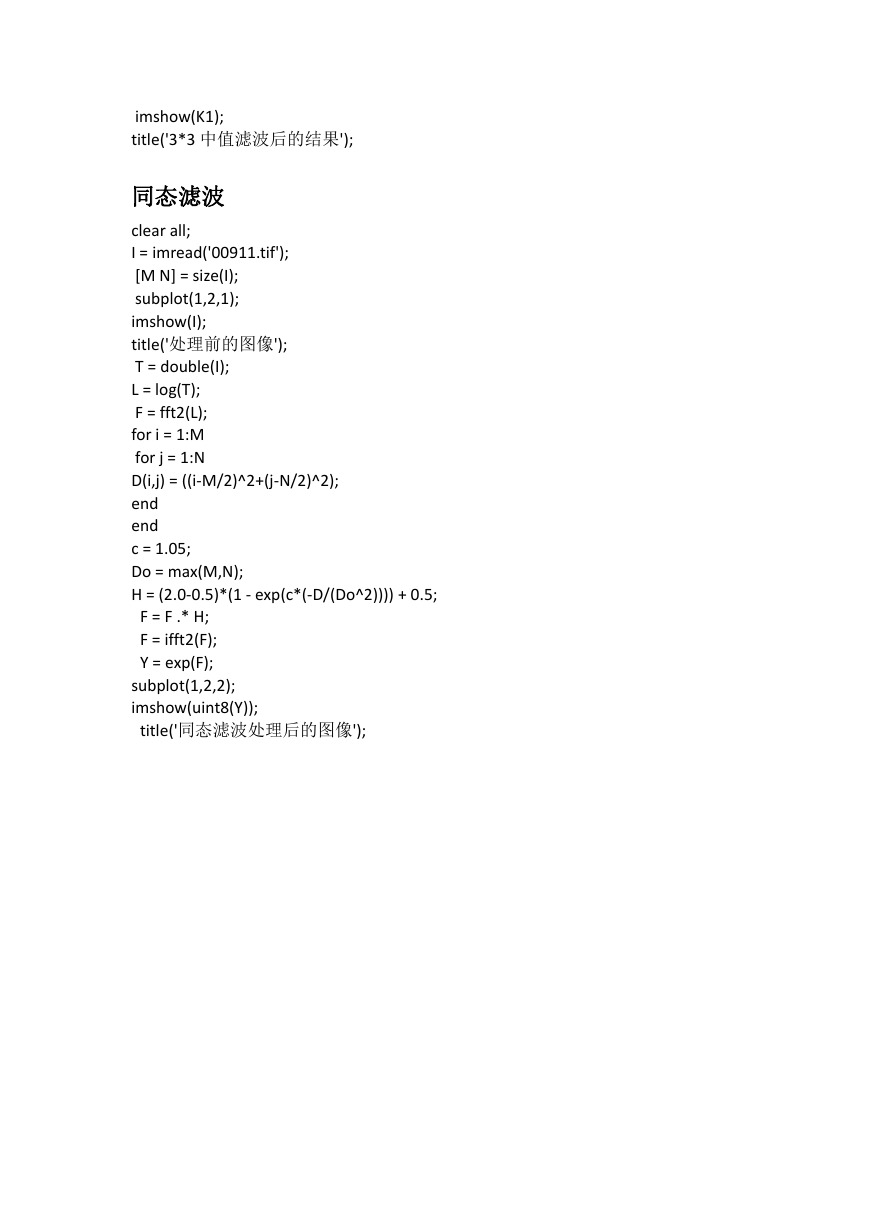
同态滤波
clear all;
I = imread('00911.tif');
[M N] = size(I);
subplot(1,2,1);
imshow(I);
title('处理前的图像');
T = double(I);
L = log(T);
F = fft2(L);
for i = 1:M
for j = 1:N
D(i,j) = ((i-M/2)^2+(j-N/2)^2);
end
end
c = 1.05;
Do = max(M,N);
H = (2.0-0.5)*(1 - exp(c*(-D/(Do^2)))) + 0.5;
F = F .* H;
F = ifft2(F);
Y = exp(F);
subplot(1,2,2);
imshow(uint8(Y));
title('同态滤波处理后的图像');
�


 2023年江西萍乡中考道德与法治真题及答案.doc
 2012年重庆南川中考生物真题及答案.doc
 2013年江西师范大学地理学综合及文艺理论基础考研真题.doc
 2020年四川甘孜小升初语文真题及答案I卷.doc
 2020年注册岩土工程师专业基础考试真题及答案.doc
 2023-2024学年福建省厦门市九年级上学期数学月考试题及答案.doc
 2021-2022学年辽宁省沈阳市大东区九年级上学期语文期末试题及答案.doc
 2022-2023学年北京东城区初三第一学期物理期末试卷及答案.doc
 2018上半年江西教师资格初中地理学科知识与教学能力真题及答案.doc
 2012年河北国家公务员申论考试真题及答案-省级.doc
 2020-2021学年江苏省扬州市江都区邵樊片九年级上学期数学第一次质量检测试题及答案.doc
 2022下半年黑龙江教师资格证中学综合素质真题及答案.doc