Computers & Fluids 38 (2009) 757–764
Contents lists available at ScienceDirect
Computers & Fluids
j o u r n a l h o m e p a g e : w w w . e l s e v i e r . c o m / l o c a t e / c o m p fl u i d
Dynamic contact angles in CFD simulations
Friedhelm Schönfeld a,*, Steffen Hardt b,1
a Institut für Mikrotechnik Mainz (IMM), Carl-Zeiss-Strasse 18-20, D-55129 Mainz, Germany
b Institut für Nano- und Mikroprozesstechnik, Leibniz Universität Hannover, Callinstr. 36, D-30167 Hannover, Germany
a r t i c l e
i n f o
a b s t r a c t
Article history:
Received 20 April 2007
Received in revised form 4 November 2007
Accepted 27 May 2008
Available online 10 October 2008
The accurate modelling of contact angle properties plays an important role in the simulation of free-sur-
face micro flows. Taking capillary filling as an example, we first discuss the analytical solutions of a cor-
responding 1D description in certain limits and then derive an approximate analytical expression for the
general case with constant contact angle. In case of a dynamic contact angle and contact line friction, the
model is beyond an analytical treatment. We show that computational fluid dynamics (CFD) results exhi-
bit a pronounced mesh dependence which is partly inherent to the modelling approach since the (non-
integrable) viscous stress divergence at the three-phase contact line is commonly neglected in standard
CFD simulations (see e.g. Hessel V, Hardt S, Löwe H. Chemical micro process engineering: fundamentals,
modelling and reactions. Weinheim: Wiley-VCH; 2004). Moreover, the numerical description of contact
angles suffers from artificial diffusion for the type of volume-of-fluid method used. Introduction of a mac-
roscopic slip range in combination with a localised body force close to the contact line turns out to rem-
edy both problems. Considering capillary filling as an example, we show that accurate, mesh independent
solutions of fluid dynamic problems involving contact angle dynamics are obtained already on coarse
meshes.
Ó 2008 Elsevier Ltd. All rights reserved.
1. Introduction
Micro flows and their applications have attracted an enhanced
interest in the past years. In this context, some of the largest eco-
nomical potentials lie in the fields of chemical process technology
[1] and micro total analysis systems (lTAS) [2,3]. lTAS are used for
biochemical analysis in medical diagnostics, pharmacological re-
search, environmental monitoring and other areas and allow to
process small sample amounts in an automated and parallel way.
In chemical process technology, microfluidics opens the door to
new process regimes, safe operation and microfluidic reactor com-
ponents often allow increased process yields and selectivities.
fluid
dynamical
for macroscopic
As far as modelling and simulation of micro flows are con-
cerned, the requirements are often different from those character-
istic
problems. While
computational fluid dynamics (CFD) is often confronted with the
problem of developing realistic turbulence models for specific
technologically relevant scenarios, micro flows are mostly laminar,
so a first-principle description can be used to model the flow. How-
ever, surface and interface effects become extremely important
and have to be included into the models in the most realistic man-
ner. Details of the dynamics of the 3-phase contact line of an
* Corresponding author. Tel.: +49 (0) 6131 990 411; fax: +49 (0) 6131 990 205.
E-mail addresses: schoenf@mnd-umwelttechnik.fh-wiesbaden.de (F. Schönfeld),
hardt@nmp.uni-hannover.de (S. Hardt).
1 Tel.: +49 (0) 511 7622 278; fax: +49 (0) 511 7622 167.
0045-7930/$ - see front matter Ó 2008 Elsevier Ltd. All rights reserved.
doi:10.1016/j.compfluid.2008.05.007
immiscible system of fluids on a solid surface are often neglected
in macroscopic simulations. Due to its scaling behaviour, surface
tension becomes important pre-dominantly in micro scale geome-
tries and is often supposed to be irrelevant in typical macroscopic
applications. However, from a fundamental point of view, the
physics on the micro scale in close vicinity to the 3-phase contact
line, i.e. the region of contact between gas, liquid and solid, dis-
plays the most interesting features and has an impact on macro-
scopic phenomena. Close to the 3-phase contact line the standard
continuum approach breaks down which reflects itself in a viscous
stress singularity leading to a diverging drag force on the solid
surface [4]. This phenomenon was described with the phrase
‘‘not even Herakles could sink a solid” in a paper by Huh and
Scriven [4], meaning that the no-slip boundary condition gives rise
to infinite forces at the three-phase contact line. Nevertheless, the
non-integrable singularity is neglected in most CFD approaches.
Relaxing the commonly used no-slip boundary condition removes
the singularity [5,6]. This concept of introducing a finite but micro-
scopic slip length at the contact line is feasible within analytical
approaches and helps to understand quite universal experimental
observations (see e.g. [7]) of dynamic contact angles, i.e. the veloc-
ity-dependent enclosed angle between the meniscus tangent at the
3-phase contact line and the wall. For details upon the analytical
approaches and on the dependence of the contact line dynamics
on the slip length the reader is referred to [8,9] and references
therein. Yet, the incorporation of a microscopic length scale that
is typically of the order of some ten nanometres into micro flow
�
758
F. Schönfeld, S. Hardt / Computers & Fluids 38 (2009) 757–764
CFD simulations is not practical for two major reasons. First, typical
outer dimensions of microfluidic systems are of the order of several
millimetres or larger. Thus, the detailed resolution of the region
around the contact line requires large numerical efforts. This is true
for the slip phenomena discussed above as well as for the micro-
scopic flow patterns around a moving contact line. Secondly, the
position of a contact line is a priori not known. Therefore, extre-
mely high grid resolution has to be provided along the wall bound-
ary if no adaptive grid refinement algorithms are used.
Since the incorporation of a realistic, microscopic slip condition
at the 3-phase contact line is usually not practical in CFD ap-
proaches, we present an alternative approach relying on the use
of a macroscopic slip range at the 3-phase contact line. By intro-
ducing a slip condition within that range the stress singularity is
released and the moving meniscus problem is no longer ill-posed.
That is reflected by the fact that the extraordinarily strong mesh
dependence that is found if the no-slip condition is applied is
eliminated.
Expressed in numerical terms, the strategy we pursue is ex-
plained as follows: We consider a problem that does not possess
a grid-independent numerical solution if no cut-off scale is intro-
duced. The physics of the problem suggests that there is in fact a
cut-off scale rendering the problem well-defined that is, however,
too small to be incorporated in a reasonable CFD framework. For
this reason we use a phenomenological model to describe the
problem that does not require the resolution of very small length
scales.
compares
to analytical
The specific aspects of the dynamics of the phase boundary
and their implementation into CFD solvers discussed in this arti-
cle are of particular importance for simulations of free-surface
flow in microfluidics. We address the question of how the numer-
ically observed wetting behaviour (without any slip length in-
cluded)
results and whether any
discrepancies in the results can be resolved by a phenomenolog-
ical approach, relying on a macroscopic range where boundary
slip occurs. Generally, several effects such as capillary filling, con-
tact angle hysteresis, dynamic contact angles, instabilities of an
advancing wetting front, or dewetting phenomena deserve close
investigation. Here the focus is put on a test case of capillary fill-
ing, the dynamical behaviour of which is directly related to dy-
namic contact angles. The presented approach is also relevant
for simulation of industrial processes such as, e.g., air entrain-
ment in context with liquid coating.
In the following section, the 1D model and certain limits of cap-
illary filling are discussed. This model is taken to benchmark corre-
sponding CFD results discussed in the second part where we
discuss how the extraordinary strong mesh dependence observed
in standard CFD simulations can be removed by introduction of a
macroscopic slip range in context with dynamic contact angles
and appropriate body forces.
2. Capillary filling with static contact angles
As a classical benchmark system we consider capillary filling
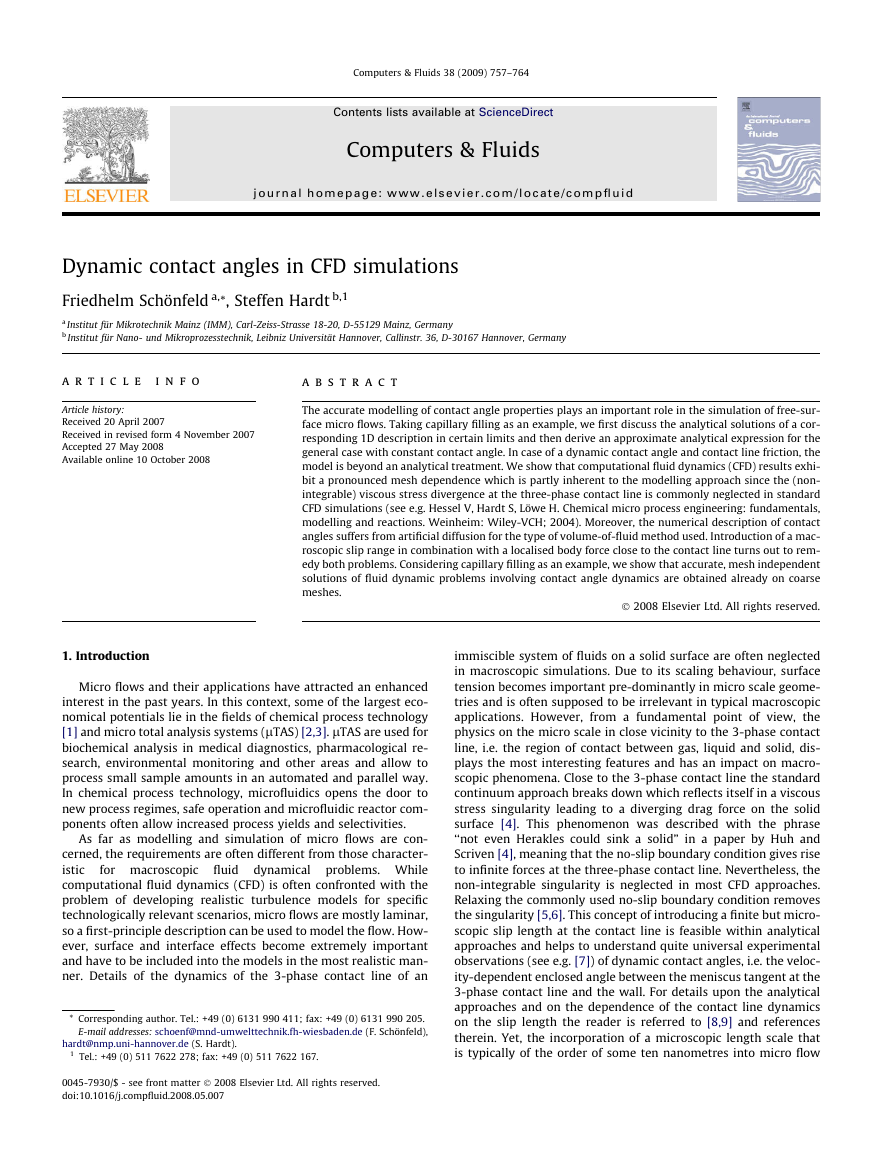
between vertical parallel plates, see Fig. 1. On one hand this sys-
tem is simple enough and allows to derive an analytical solution
for the filling height in certain limits. On the other hand the fill-
ing dynamics depends sensitively on the contact angle and thus
the systems allows to evaluate the CFD scheme for contact angle
dynamics developed in the following. Moreover a one-dimen-
sional differential equation governing the meniscus dynamics
can be derived facilitating analytical solutions in certain limits.
For the sake of clarity we start by formulating the Newton’s
equation of motion for capillary filling between vertical parallel
plates (cf. e.g. [10]):
d
θ
h
Fig. 1. Model geometry for studying capillary filling between parallel plates. h, h, d,
p0 denote the meniscus height, contact angle, distance between the plates and
counter pressure.
p0
� 12 _h
d
f _hqðhÞg ¼ 2r cos h
d2 gðhÞ � hgfql � qgg þ p0;
d
dt
where r, h, d, p0 are surface tension, contact angle, distance be-
tween the plates and counter pressure, respectively (cf. Fig. 1).
The term on the left-hand side denotes the inertial force per unit
area which is compensated by the Laplace pressure due to the
meniscus curvature, the viscous friction as well as hydrostatic
and counter pressure on the right hand side. The averaged density
and viscosity q, g are functions of the meniscus height h(t) and are
expressed via the liquid (l) and gas (g) densities ql and qg and
viscosities gl and gg as qðhÞ ¼ qlh þ qgðL � hÞÞ and gðhÞ ¼ glhþ
ggðL � hÞÞ. L is the height of the parallel plates arrangement. In
the case of a static contact angle and if the gas properties are neg-
ligible, Eq. (1) is of the general form
y€y þ _y2 ¼ ay _y þ by þ c:
ð2Þ
In order to facilitate the application of the subsequent discus-
sion of Eq. (2), the relations of the new parameters to the physical
and
viz.
; b ¼ �g and c ¼ 2r cos h=qld þ Po=ql. Eq. (2) re-
a ¼ �12gl=qld2
duces to the Lucas-Washburn equation in the quasi steady state
[11,12]
0 ¼ ay _y þ by þ c:
solved by yðtÞ ¼
ffiffiffi
p � t þ b=6 � t2;
ð3Þ
Two more limits deserve mentioning since they allow giving the
solution in a closed form. For inviscid liquids Eq. (2) reduces to the
Quéré equation (see, e.g.,[13])
y€y þ _y2 ¼ by þ c
ð4Þ
for initial conditions yð0Þ ¼ 0 and _yð0Þ ¼ 0. In case of a horizontal
meniscus movement the linear (gravitational) term in Eq. (2) van-
ishes and one is left with
ffiffiffi
p
p ffiffiffiffiffiffiffiffiffiffiffiffiffiffiffiffiffiffiffiffiffiffiffiffiffiffiffiffiffiffiffiffiffiffiffiffiffiffiffiffiffiffiffiffiffiffiffiffiffiffiffiffiffi
y€y þ _y2 ¼ ay _y þ c
yðtÞ ¼ eat=2
c þ a � e�atfc þ act þ ag
:
a
geometrical
explicitly
given,
properties
are
solved by
2
ð1Þ
ð5Þ
c
The equilibrium position, i.e. the long-time limit of Eq. (2) is
given by y1 = -c/b. Applying an infinitesimal perturbation of the
equilibrium in the weekly damped limit (a � 1) yields an oscilla-
�
ffiffiffiffiffiffiffiffiffiffiffiffiffiffiffi
p
�b=y1
tory behaviour with a characteristic frequency x0 ¼
[13].
In order to derive an approximate analytical expression for the full
dynamics it is helpful to cast Eq. (2) into the form
ð€y2Þ ¼ að _y2Þ þ 2by þ 2c:
ð6Þ
Replacing y2 by z and expanding the square-root term around
the equilibrium position y1 = �c/b yields an anharmonic-oscillator
equation for z(t). Note, the existence of an equilibrium position im-
plies non-vanishing gravity, i.e. b < 0.
€z ¼ a_z þ 2b
�
�
ffiffiffiffiffiffi
ffiffiffiffiffiffi
p þ z � z1
p þ Oðz2Þ
z1
z1
þ 2c:
ð7Þ
2
By numerical integration of Eq. (7), the linear term in z(t) is
found to be at least an order of magnitude larger than the quadratic
term for the set of parameters given below. This motivates us to
neglect the anharmonic terms. In this case the solution has the
general form of a damped oscillatory motion around the equilib-
rium position. Neglecting further the frequency shift due to the
damping the solution of Eq. (7) can be approximated by
(
b2 þ eat=2 cosðx0tÞ b2y2
yðtÞ ¼ c2
0 � c2
b2
)
1=2
:
ð8Þ
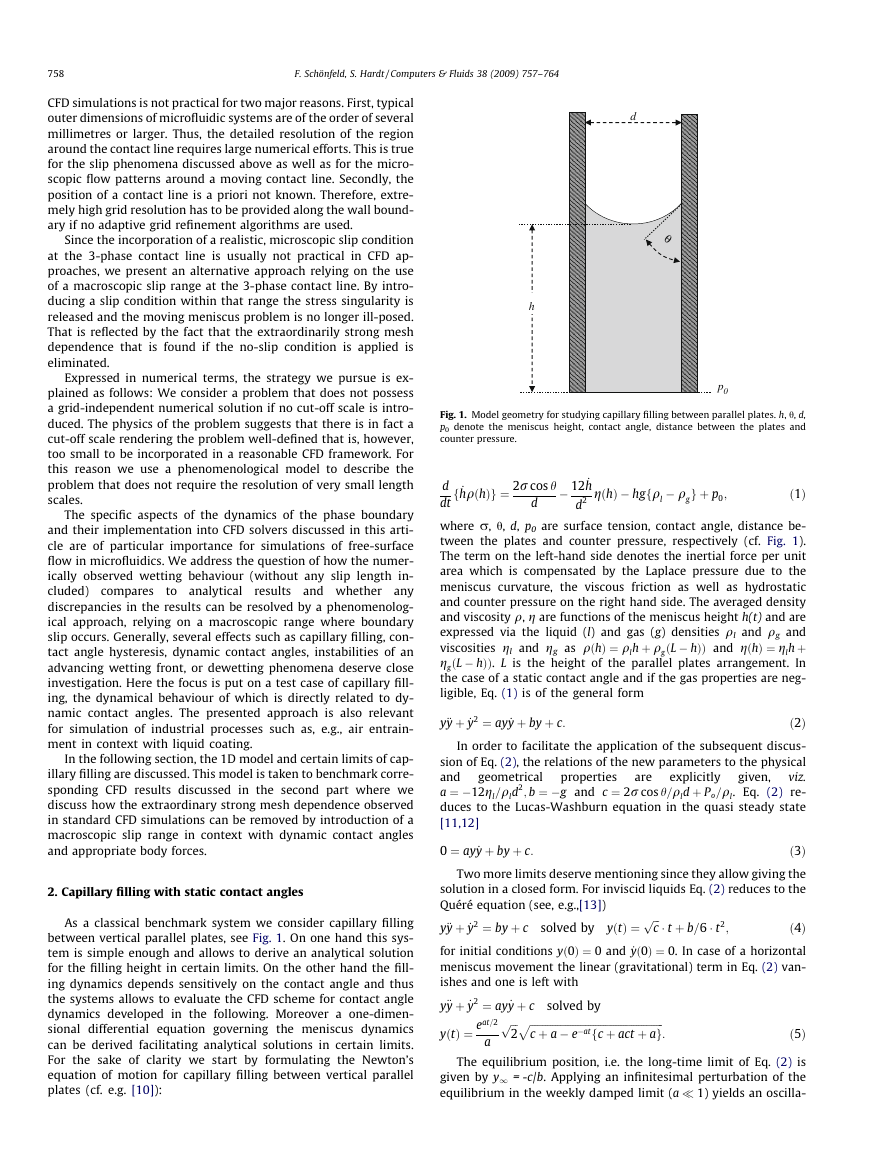
The comparison of the approximate solution (Eq. (8)) to the full
numerical solution is given in Fig. 2. Numerical quadrature was
done with the help of Mathematica 4 (Wolfram Research, Illinois,
US). For this comparison liquid properties of water were used
(q = 1000 kg/m3, g = 1 mPa s), furthermore r = 0.0725 N m, h = 0,
d = 1 mm, p0 = 0, h(0) = 1 mm and _hð0Þ ¼ 0 mm/s. The good agree-
ment between the numerical solution and the approximate analyt-
ical one does not sensitively depend on the chosen parameters.
Obviously, Eq. (8) serves as a reasonable approximation. The inten-
tion of this approximation, however, is not to provide an alterna-
tive to the numerical solution of Eq. (2) or Eq. (6), but rather to
show that the characteristic oscillatory behaviour and viscous
damping of capillary motion, which occur for certain parameter
sets and which are also observed in experiments [13], can be
understood on the basis of a damped harmonic oscillator.
F. Schönfeld, S. Hardt / Computers & Fluids 38 (2009) 757–764
759
3. Capillary filling with dynamic contact angles
The 1D model (Eq. (2)) and the analytical solutions are valuable
tools to predict the dynamics of marching menisci. Yet, two aspects
have been neglected so far. Firstly, since the meniscus moves with
a uniform velocity, the axial velocity profile has to change from a
parabolic one well in the liquid phase to a uniform velocity at
the advancing liquid front. The corresponding viscous dissipation
is similar to that connected with developing flow in the entrance
region of fluidic ducts. For a duct length larger than the entrance
length the increase in pressure drop is given by
Dp ¼ km
ð9Þ
qu2
2 ;
n
o
n
o
_hqðhÞ
where u denotes the average velocity and km equals 0.686 for par-
allel plates [14]. Secondly, the large shear-stress close to the 3-
phase contact line causes a deviation of the actual contact angle
from the static one (see e.g. [8]). The resulting dynamic contact an-
gle has to be taken into account. Hence, Eq. (1) is extended to
d
d
dt
þ p0 � km
¼ 2r cos hdðCa; h0Þ
� 12 _h
d2 gðhÞ� hg ql � qg
q _h2
2 :
ð10Þ
Here hd denotes the dynamic contact angle being a function of
the capillary number Ca ¼ _hgl=r and h0 the static (equilibrium)
contact angle. Eq. (10) together with an experimental or analytical
correlation for the dynamic contact angle hd as a function of Ca and
h0 determines the dynamics of capillary filling. It is worth mention-
ing that both modifications slow down the burst-like meniscus rise
which is for instance observed for the Washburn equation in the
short-time limit [13]. Several correlations hd(Ca, h0) have been re-
ported in the literature (see e.g. Tanner [15], Bracke et al. [16]),
most of them show a quite universal behaviour for contact angels
well below 90°. In most theoretical studies of moving contact lines
a velocity slip length is introduced to render the shear-stress sin-
gularity finite. The (finite) contact line friction obtained in that
way is responsible for the velocity dependence of the contact an-
gle. One of the most general analytical studies has been performed
by Cox [9]. His result can be summarized as
Fig. 2. 1D model results for capillary filling between parallel plates. Circles: exact numerical solution of Eq. (2); Line: approximate analytical solution (Eq. (8)). The inset
shows the absolute difference between both data sets.
�
760
F. Schönfeld, S. Hardt / Computers & Fluids 38 (2009) 757–764
gðhdÞ ¼ gðh0Þ þ Ca � lnðl�1
ð11Þ
s Þ;
where ls denotes the dimensionless length of the slip region and the
ffiffiffiffiffiffi
function g is given in [9]. In the following, the somewhat simpler
empirical correlation derived by Bracke et al. (1989) is used
p
cosðhdÞ ¼ cosðh0Þ � 2½1 þ cosðh0Þ
Ca
:
ð12Þ
It has to be stressed, however, that the CFD approach discussed
subsequently allows to implement other correlations as well and
does not depend on the particular choice of hd(Ca, h0). Inserting
Eq. (12) in Eq. (10) yields a highly non-linear differential equation
of the form
ffiffiffi
p
_y
;
the newly
introduced parameter
and
y€y ¼ ay _y þ by þ c0 þ d1 _y2 þ d2
ð13Þ
ffiffiffiffiffiffiffiffi
are defined as
where
d2 ¼ 4½1 þ cos h0
c0 ¼ 2r cos h0=qld þ P0=ql; d1 ¼ km=2 � 1,
p
rgl
=qld. The square-root term in Eq. (13) represents the friction
of the contact line motion. Interestingly, the square-root depen-
dence of the contact line friction was also derived independently
of any dynamic contact angle correlation by comparing numerical
solutions of the Navier–Stokes equations to experimental data
[17]. Since straightforward analytical approaches fail, Eq. (13) is
solved numerically (Mathematica 4, Wolfram Research, Illinois,
US). The solution of the 1D model is taken as a benchmark for the
CFD results discussed below. Already in the analysis of the 1D ap-
proach it will turn out that the dynamic behaviour is extremely
sensitive to details of the dynamic contact angle, thus facilitating
the evaluation of numerical accuracy. Such an indirect monitoring
of the contact angle is much more accurate than the direct quanti-
fication by numerical determination of the slope of the interface at
the wall.
3.1. CFD analysis
We start our CFD analysis by simulating capillary rise with a
static contact angle as it has been investigated by Quinte et al.
[18]. Many CFD solvers, as CFX4, allow for explicit application of
contact angles as boundary conditions which translates to defining
the tangential and normal component of the normalized volume-
fraction function at the boundary nodes (see. e.g. [19]). In this con-
text the term ‘‘static contact angle” means that a velocity-indepen-
dent contact angle has been applied as boundary condition to the
model, while friction forces in the vicinity of the contact line
may still alter the contact angle dynamically. The test case is worth
studying because up to date most CFD simulations of marching
contact lines are based on such a description. Hence, it gives valu-
able information about the performance of standard CFD tools. The
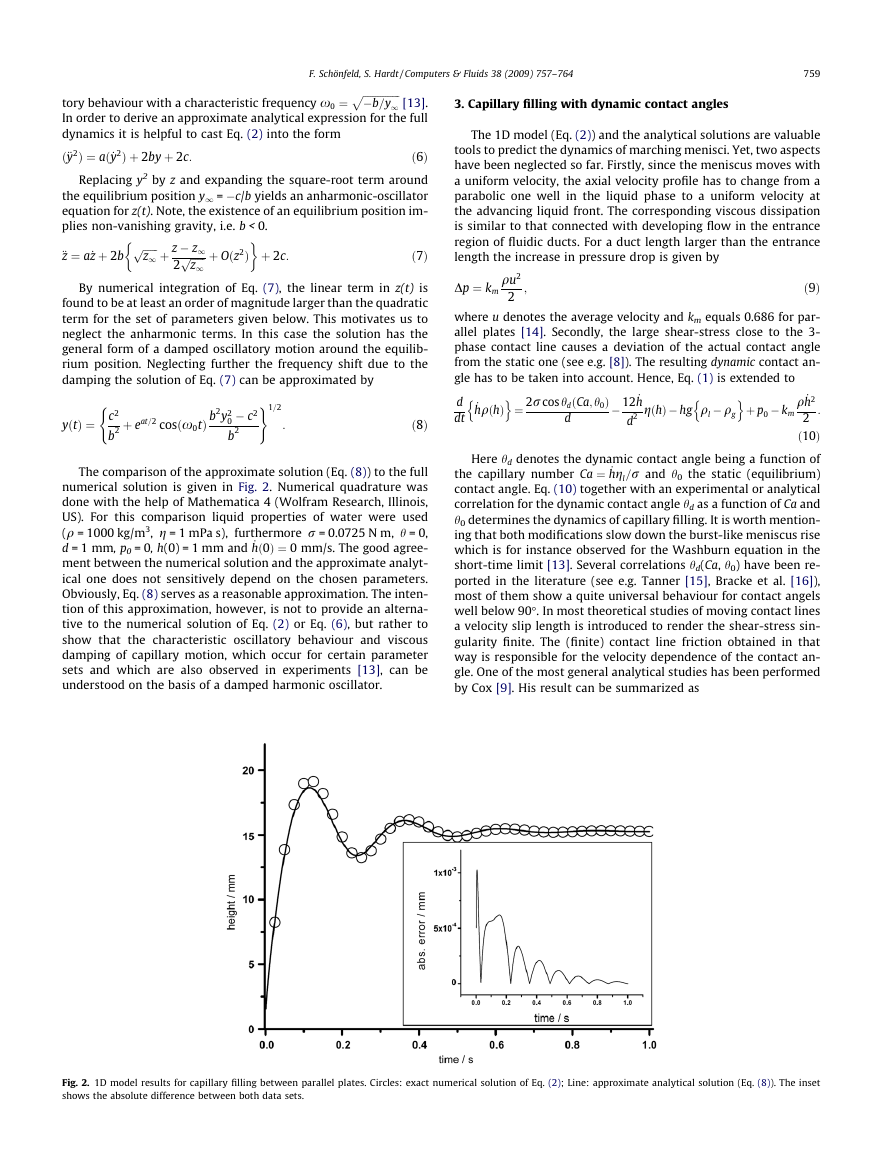
CFD results as well as the numerical solution of the 1D model are
displayed in Fig. 3. Again, liquid properties of water as given above
were chosen. The static contact angle was set to 55°, the plate dis-
tance to 1 mm and the initial height of the meniscus to 2 mm. In
order to lower the equilibrium position and to reduce the extent
of the computational domain a counter pressure of �49.95 Pa
was applied (total length L = 5 mm, cf. Fig. 1). The dashed lines in
Fig. 3 denote the CFD results based on the solution of the incom-
pressible Navier–Stokes equations on Cartesian meshes of 250,
1000, 4000, 16,000 and 64,000 cells in two dimensions (cf.
Fig. 4). For pressure–velocity coupling, the SIMPLEC algorithm
[20] was used. The free-surface flow was modelled using the vol-
ume-of-fluid (VOF) method (see, e.g., [21]) which describes the
time evolution of the separated phases on a fixed computational
grid by a convection equation for a volume-fraction function. For
discretization of the volume-fraction equation a flux-limited high-
er-order upwind scheme [22] was used. No particular scheme for
interface reconstruction is applied and surface tension is incorpo-
m
m
/
t
h
g
e
h
i
4.0
3.5
3.0
2.5
2.0
0.0 0.1 0.2 0.3 0.4
time / s
Fig. 3. Dynamics of the capillary rise between parallel plates. Numerical solutions
within the 1D approach described in the text, with constant and dynamic contact
angle are displayed with a bold and thin solid line, respectively. Dashed lines
represent results of CFD simulations on grids with 250, 1000, 4000, 16,000 and
64,000 cells (from top to bottom) as depicted partly in Fig. 4. The assumed static
contact angle of 55° implies an equilibrium meniscus position of about 3.39 mm.
rated as a volumetric force in the cells defining the phase boundary
[19]. The simulations were carried out using the commercial flow
solver CFX4 (CFX/ANSYS). Several simulations have been per-
formed in order to identify the appropriate temporal discretization.
It was observed that accurate, time step independent results are
obtained for steps of 2 � 10�5 s and below using quadratic time
differencing. The resulting curves obviously show a strong mesh
dependence of the capillary rise which persists even down to mesh
cell dimensions below about 10 lm. In context with the extraordi-
narily strong mesh dependence the following aspects need to be
considered:
1. With increasing mesh resolution the CFD results tend towards
the 1D results for a dynamic contact angle (thin solid line).
However, mesh independence is not obtained.
2. The large (cut-off limited) friction in close vicinity to the 3-
phase contact line is more accurately reproduced on finer
meshes. However, due to the non-integrability of the shear-
stress singularity arbitrary fine meshes are not expected to
yield realistic results.
3. Numerical diffusion (ND), i.e. the artificial smearing of the
phase boundary in the VOF simulations, is mesh dependent.
Close to the 3-phase contact line, particularly strong ND is
observed for higher velocities.
The fact that the observed oscillations on coarse meshes, corre-
sponding to the 1D solution for a static contact angle, are found to
be more and more damped on finer meshes has to be attributed to
point 2. The dynamic changes of the contact angle and the
corresponding changes in capillary rise dynamics are not even
approximately captured on the on the coarsest meshes with 250
and 1000 cells.
3.2. Phenomenological CFD approach
The above example demonstrates that even for simplified 2D
geometries free-surface flow simulations are notoriously time-
consuming if the effects of contact angle dynamics should be cap-
tured correctly in a qualitative manner. Approximately correct re-
sults can only be obtained on extremely fine meshes, with the
�
F. Schönfeld, S. Hardt / Computers & Fluids 38 (2009) 757–764
761
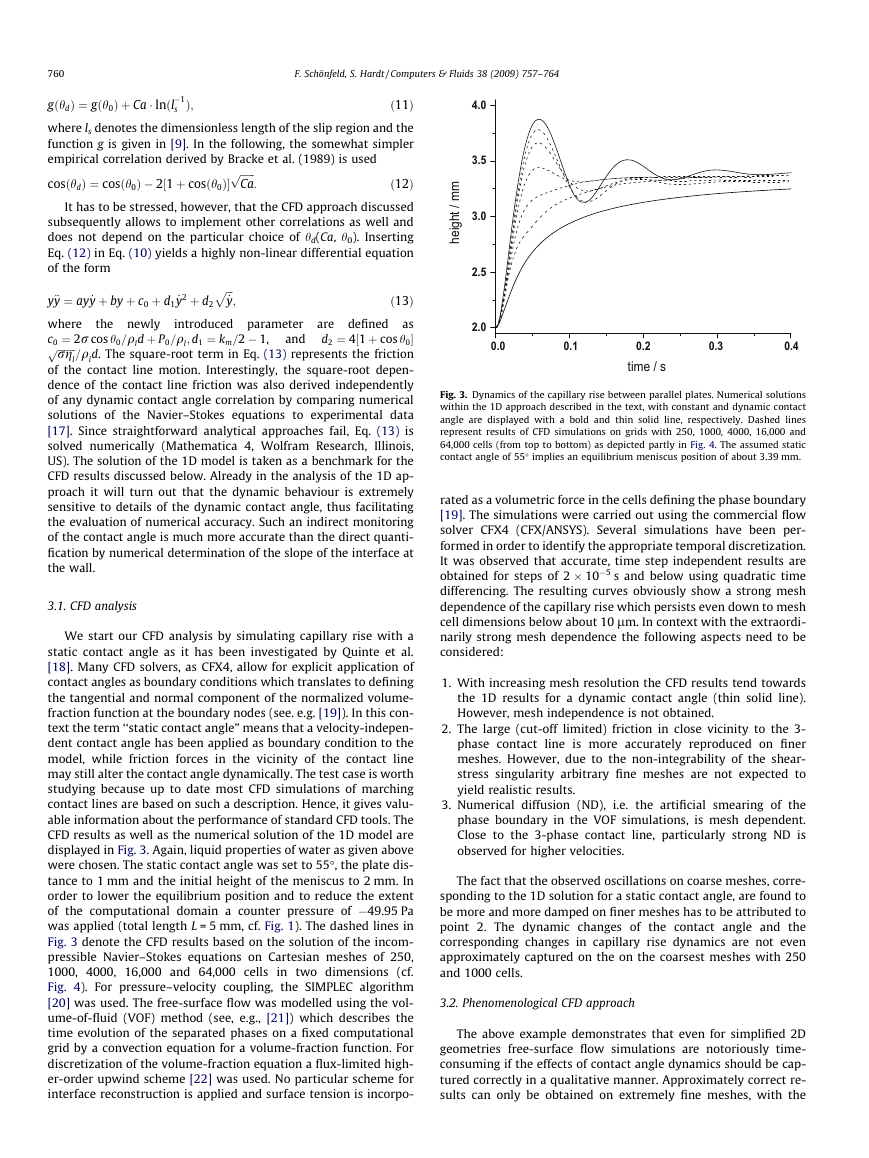
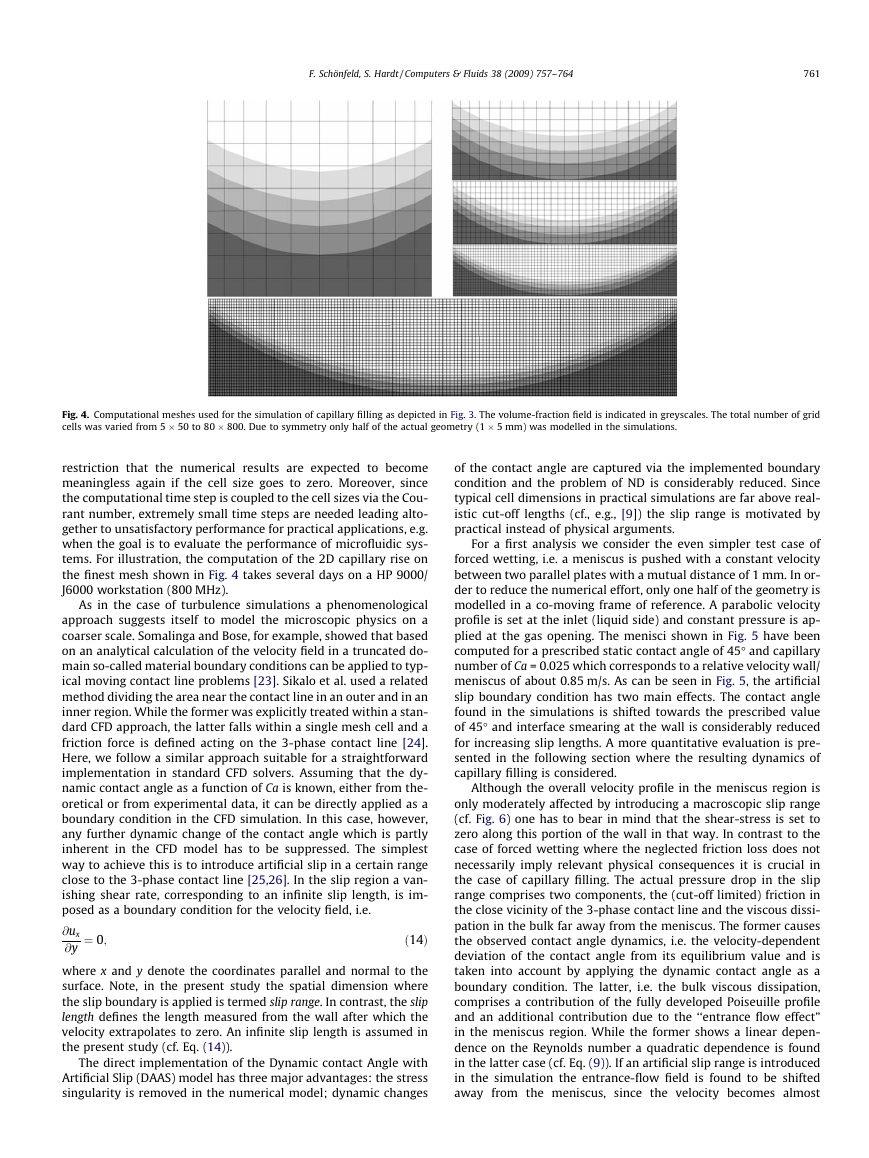
Fig. 4. Computational meshes used for the simulation of capillary filling as depicted in Fig. 3. The volume-fraction field is indicated in greyscales. The total number of grid
cells was varied from 5 � 50 to 80 � 800. Due to symmetry only half of the actual geometry (1 � 5 mm) was modelled in the simulations.
restriction that the numerical results are expected to become
meaningless again if the cell size goes to zero. Moreover, since
the computational time step is coupled to the cell sizes via the Cou-
rant number, extremely small time steps are needed leading alto-
gether to unsatisfactory performance for practical applications, e.g.
when the goal is to evaluate the performance of microfluidic sys-
tems. For illustration, the computation of the 2D capillary rise on
the finest mesh shown in Fig. 4 takes several days on a HP 9000/
J6000 workstation (800 MHz).
As in the case of turbulence simulations a phenomenological
approach suggests itself to model the microscopic physics on a
coarser scale. Somalinga and Bose, for example, showed that based
on an analytical calculation of the velocity field in a truncated do-
main so-called material boundary conditions can be applied to typ-
ical moving contact line problems [23]. Sikalo et al. used a related
method dividing the area near the contact line in an outer and in an
inner region. While the former was explicitly treated within a stan-
dard CFD approach, the latter falls within a single mesh cell and a
friction force is defined acting on the 3-phase contact line [24].
Here, we follow a similar approach suitable for a straightforward
implementation in standard CFD solvers. Assuming that the dy-
namic contact angle as a function of Ca is known, either from the-
oretical or from experimental data, it can be directly applied as a
boundary condition in the CFD simulation. In this case, however,
any further dynamic change of the contact angle which is partly
inherent in the CFD model has to be suppressed. The simplest
way to achieve this is to introduce artificial slip in a certain range
close to the 3-phase contact line [25,26]. In the slip region a van-
ishing shear rate, corresponding to an infinite slip length, is im-
posed as a boundary condition for the velocity field, i.e.
@ux
@y
ð14Þ
¼ 0;
where x and y denote the coordinates parallel and normal to the
surface. Note, in the present study the spatial dimension where
the slip boundary is applied is termed slip range. In contrast, the slip
length defines the length measured from the wall after which the
velocity extrapolates to zero. An infinite slip length is assumed in
the present study (cf. Eq. (14)).
The direct implementation of the Dynamic contact Angle with
Artificial Slip (DAAS) model has three major advantages: the stress
singularity is removed in the numerical model; dynamic changes
of the contact angle are captured via the implemented boundary
condition and the problem of ND is considerably reduced. Since
typical cell dimensions in practical simulations are far above real-
istic cut-off lengths (cf., e.g., [9]) the slip range is motivated by
practical instead of physical arguments.
For a first analysis we consider the even simpler test case of
forced wetting, i.e. a meniscus is pushed with a constant velocity
between two parallel plates with a mutual distance of 1 mm. In or-
der to reduce the numerical effort, only one half of the geometry is
modelled in a co-moving frame of reference. A parabolic velocity
profile is set at the inlet (liquid side) and constant pressure is ap-
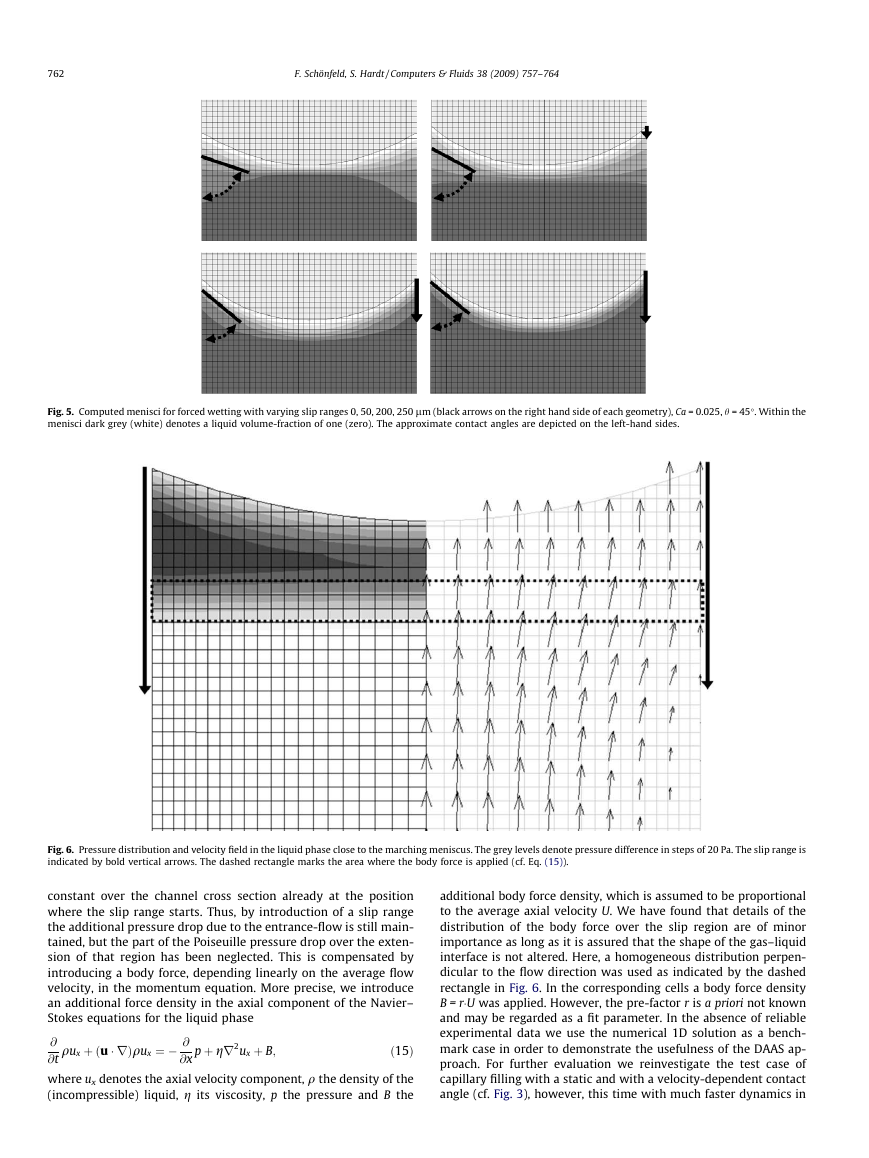
plied at the gas opening. The menisci shown in Fig. 5 have been
computed for a prescribed static contact angle of 45° and capillary
number of Ca = 0.025 which corresponds to a relative velocity wall/
meniscus of about 0.85 m/s. As can be seen in Fig. 5, the artificial
slip boundary condition has two main effects. The contact angle
found in the simulations is shifted towards the prescribed value
of 45° and interface smearing at the wall is considerably reduced
for increasing slip lengths. A more quantitative evaluation is pre-
sented in the following section where the resulting dynamics of
capillary filling is considered.
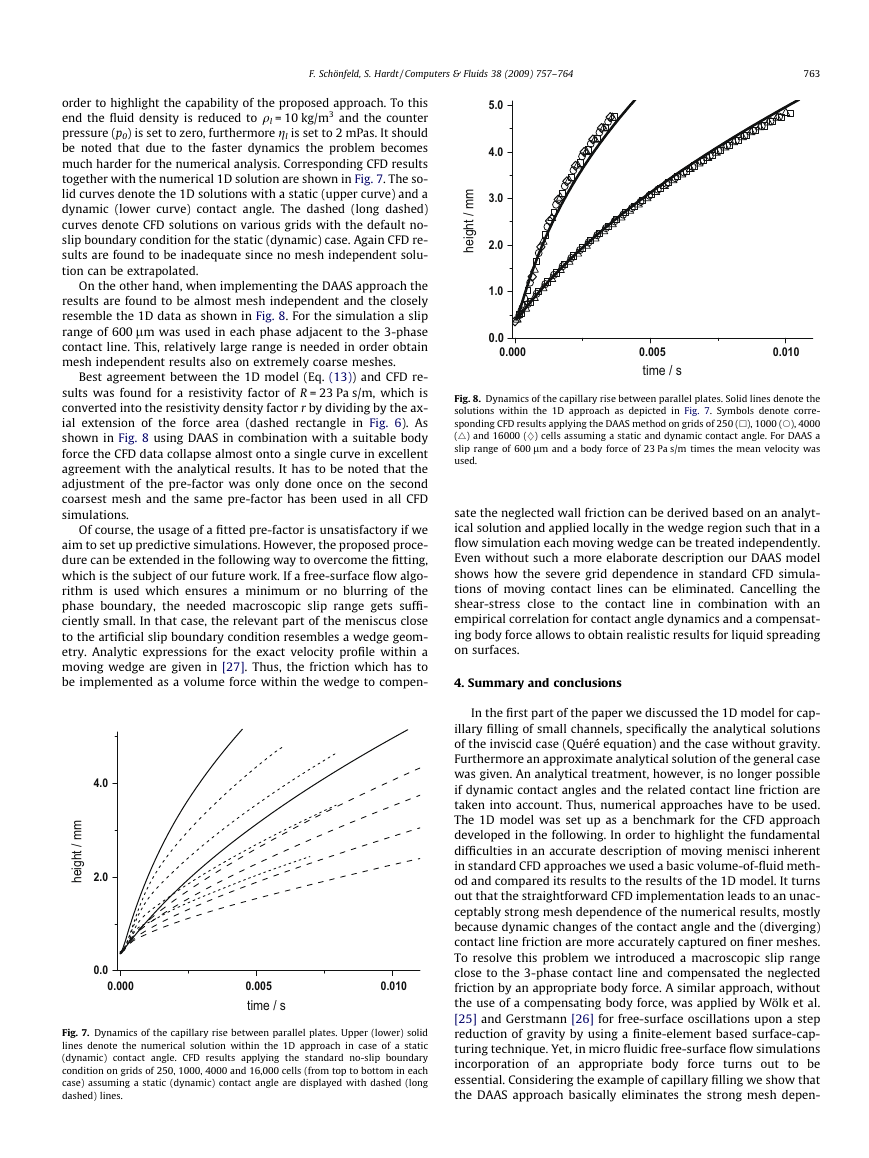
Although the overall velocity profile in the meniscus region is
only moderately affected by introducing a macroscopic slip range
(cf. Fig. 6) one has to bear in mind that the shear-stress is set to
zero along this portion of the wall in that way. In contrast to the
case of forced wetting where the neglected friction loss does not
necessarily imply relevant physical consequences it is crucial in
the case of capillary filling. The actual pressure drop in the slip
range comprises two components, the (cut-off limited) friction in
the close vicinity of the 3-phase contact line and the viscous dissi-
pation in the bulk far away from the meniscus. The former causes
the observed contact angle dynamics, i.e. the velocity-dependent
deviation of the contact angle from its equilibrium value and is
taken into account by applying the dynamic contact angle as a
boundary condition. The latter, i.e. the bulk viscous dissipation,
comprises a contribution of the fully developed Poiseuille profile
and an additional contribution due to the ‘‘entrance flow effect”
in the meniscus region. While the former shows a linear depen-
dence on the Reynolds number a quadratic dependence is found
in the latter case (cf. Eq. (9)). If an artificial slip range is introduced
in the simulation the entrance-flow field is found to be shifted
away from the meniscus, since the velocity becomes almost
�
762
F. Schönfeld, S. Hardt / Computers & Fluids 38 (2009) 757–764
Fig. 5. Computed menisci for forced wetting with varying slip ranges 0, 50, 200, 250 lm (black arrows on the right hand side of each geometry), Ca = 0.025, h = 45°. Within the
menisci dark grey (white) denotes a liquid volume-fraction of one (zero). The approximate contact angles are depicted on the left-hand sides.
Fig. 6. Pressure distribution and velocity field in the liquid phase close to the marching meniscus. The grey levels denote pressure difference in steps of 20 Pa. The slip range is
indicated by bold vertical arrows. The dashed rectangle marks the area where the body force is applied (cf. Eq. (15)).
constant over the channel cross section already at the position
where the slip range starts. Thus, by introduction of a slip range
the additional pressure drop due to the entrance-flow is still main-
tained, but the part of the Poiseuille pressure drop over the exten-
sion of that region has been neglected. This is compensated by
introducing a body force, depending linearly on the average flow
velocity, in the momentum equation. More precise, we introduce
an additional force density in the axial component of the Navier–
Stokes equations for the liquid phase
qux þ ðu � rÞqux ¼ � @
@x
@
@t
where ux denotes the axial velocity component, q the density of the
(incompressible) liquid, g its viscosity, p the pressure and B the
p þ gr2ux þ B;
ð15Þ
additional body force density, which is assumed to be proportional
to the average axial velocity U. We have found that details of the
distribution of the body force over the slip region are of minor
importance as long as it is assured that the shape of the gas–liquid
interface is not altered. Here, a homogeneous distribution perpen-
dicular to the flow direction was used as indicated by the dashed
rectangle in Fig. 6. In the corresponding cells a body force density
B = r�U was applied. However, the pre-factor r is a priori not known
and may be regarded as a fit parameter. In the absence of reliable
experimental data we use the numerical 1D solution as a bench-
mark case in order to demonstrate the usefulness of the DAAS ap-
proach. For further evaluation we reinvestigate the test case of
capillary filling with a static and with a velocity-dependent contact
angle (cf. Fig. 3), however, this time with much faster dynamics in
�
F. Schönfeld, S. Hardt / Computers & Fluids 38 (2009) 757–764
763
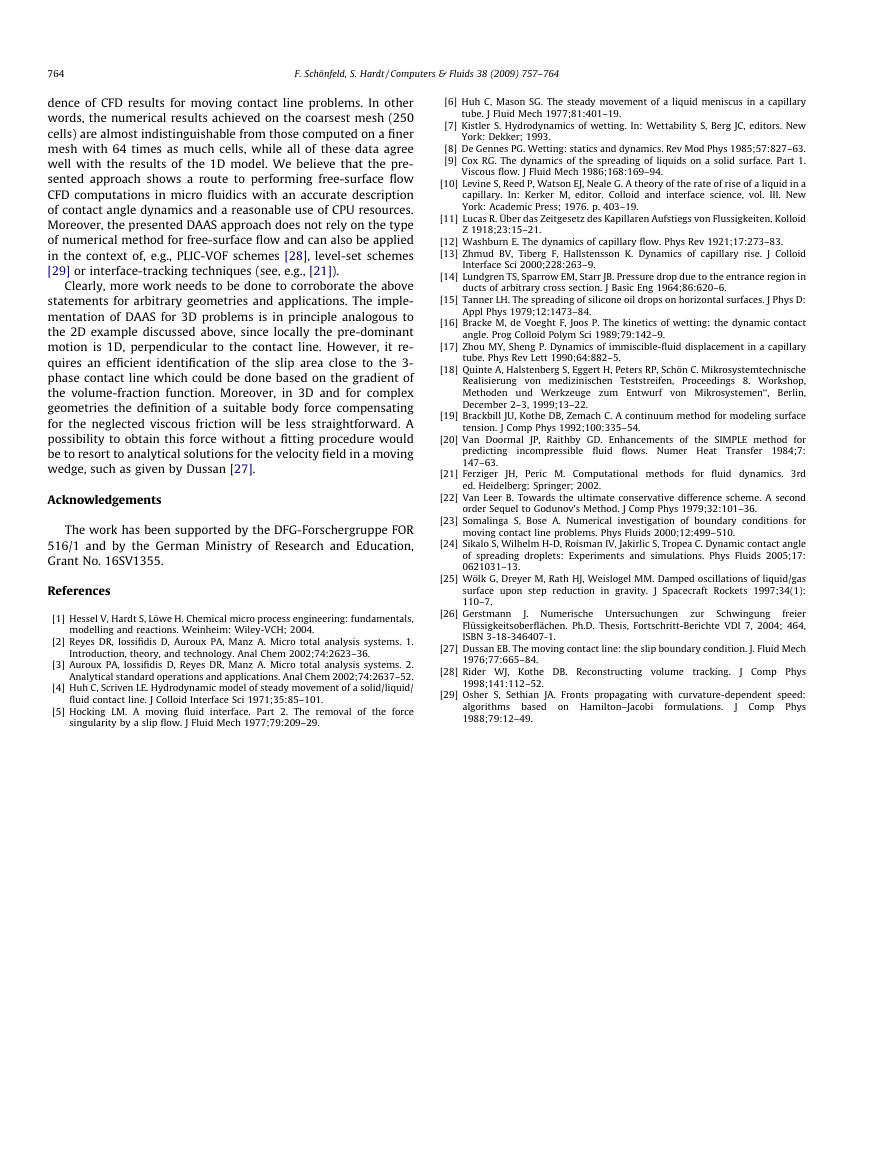
order to highlight the capability of the proposed approach. To this
end the fluid density is reduced to ql = 10 kg/m3 and the counter
pressure (p0) is set to zero, furthermore gl is set to 2 mPas. It should
be noted that due to the faster dynamics the problem becomes
much harder for the numerical analysis. Corresponding CFD results
together with the numerical 1D solution are shown in Fig. 7. The so-
lid curves denote the 1D solutions with a static (upper curve) and a
dynamic (lower curve) contact angle. The dashed (long dashed)
curves denote CFD solutions on various grids with the default no-
slip boundary condition for the static (dynamic) case. Again CFD re-
sults are found to be inadequate since no mesh independent solu-
tion can be extrapolated.
On the other hand, when implementing the DAAS approach the
results are found to be almost mesh independent and the closely
resemble the 1D data as shown in Fig. 8. For the simulation a slip
range of 600 lm was used in each phase adjacent to the 3-phase
contact line. This, relatively large range is needed in order obtain
mesh independent results also on extremely coarse meshes.
Best agreement between the 1D model (Eq. (13)) and CFD re-
sults was found for a resistivity factor of R = 23 Pa s/m, which is
converted into the resistivity density factor r by dividing by the ax-
ial extension of the force area (dashed rectangle in Fig. 6). As
shown in Fig. 8 using DAAS in combination with a suitable body
force the CFD data collapse almost onto a single curve in excellent
agreement with the analytical results. It has to be noted that the
adjustment of the pre-factor was only done once on the second
coarsest mesh and the same pre-factor has been used in all CFD
simulations.
Of course, the usage of a fitted pre-factor is unsatisfactory if we
aim to set up predictive simulations. However, the proposed proce-
dure can be extended in the following way to overcome the fitting,
which is the subject of our future work. If a free-surface flow algo-
rithm is used which ensures a minimum or no blurring of the
phase boundary, the needed macroscopic slip range gets suffi-
ciently small. In that case, the relevant part of the meniscus close
to the artificial slip boundary condition resembles a wedge geom-
etry. Analytic expressions for the exact velocity profile within a
moving wedge are given in [27]. Thus, the friction which has to
be implemented as a volume force within the wedge to compen-
4.0
2.0
m
m
/
t
h
g
e
h
i
0.0
0.000 0.005 0.010
time / s
Fig. 7. Dynamics of the capillary rise between parallel plates. Upper (lower) solid
lines denote the numerical solution within the 1D approach in case of a static
(dynamic) contact angle. CFD results applying the standard no-slip boundary
condition on grids of 250, 1000, 4000 and 16,000 cells (from top to bottom in each
case) assuming a static (dynamic) contact angle are displayed with dashed (long
dashed) lines.
5.0
4.0
3.0
2.0
1.0
m
m
/
t
h
g
e
h
i
0.0
0.000 0.005 0.010
time / s
Fig. 8. Dynamics of the capillary rise between parallel plates. Solid lines denote the
solutions within the 1D approach as depicted in Fig. 7. Symbols denote corre-
sponding CFD results applying the DAAS method on grids of 250 (h), 1000 (s), 4000
(4) and 16000 (}) cells assuming a static and dynamic contact angle. For DAAS a
slip range of 600 lm and a body force of 23 Pa s/m times the mean velocity was
used.
sate the neglected wall friction can be derived based on an analyt-
ical solution and applied locally in the wedge region such that in a
flow simulation each moving wedge can be treated independently.
Even without such a more elaborate description our DAAS model
shows how the severe grid dependence in standard CFD simula-
tions of moving contact lines can be eliminated. Cancelling the
shear-stress close to the contact line in combination with an
empirical correlation for contact angle dynamics and a compensat-
ing body force allows to obtain realistic results for liquid spreading
on surfaces.
4. Summary and conclusions
In the first part of the paper we discussed the 1D model for cap-
illary filling of small channels, specifically the analytical solutions
of the inviscid case (Quéré equation) and the case without gravity.
Furthermore an approximate analytical solution of the general case
was given. An analytical treatment, however, is no longer possible
if dynamic contact angles and the related contact line friction are
taken into account. Thus, numerical approaches have to be used.
The 1D model was set up as a benchmark for the CFD approach
developed in the following. In order to highlight the fundamental
difficulties in an accurate description of moving menisci inherent
in standard CFD approaches we used a basic volume-of-fluid meth-
od and compared its results to the results of the 1D model. It turns
out that the straightforward CFD implementation leads to an unac-
ceptably strong mesh dependence of the numerical results, mostly
because dynamic changes of the contact angle and the (diverging)
contact line friction are more accurately captured on finer meshes.
To resolve this problem we introduced a macroscopic slip range
close to the 3-phase contact line and compensated the neglected
friction by an appropriate body force. A similar approach, without
the use of a compensating body force, was applied by Wölk et al.
[25] and Gerstmann [26] for free-surface oscillations upon a step
reduction of gravity by using a finite-element based surface-cap-
turing technique. Yet, in micro fluidic free-surface flow simulations
incorporation of an appropriate body force turns out to be
essential. Considering the example of capillary filling we show that
the DAAS approach basically eliminates the strong mesh depen-
�
764
F. Schönfeld, S. Hardt / Computers & Fluids 38 (2009) 757–764
dence of CFD results for moving contact line problems. In other
words, the numerical results achieved on the coarsest mesh (250
cells) are almost indistinguishable from those computed on a finer
mesh with 64 times as much cells, while all of these data agree
well with the results of the 1D model. We believe that the pre-
sented approach shows a route to performing free-surface flow
CFD computations in micro fluidics with an accurate description
of contact angle dynamics and a reasonable use of CPU resources.
Moreover, the presented DAAS approach does not rely on the type
of numerical method for free-surface flow and can also be applied
in the context of, e.g., PLIC-VOF schemes [28], level-set schemes
[29] or interface-tracking techniques (see, e.g., [21]).
Clearly, more work needs to be done to corroborate the above
statements for arbitrary geometries and applications. The imple-
mentation of DAAS for 3D problems is in principle analogous to
the 2D example discussed above, since locally the pre-dominant
motion is 1D, perpendicular to the contact line. However, it re-
quires an efficient identification of the slip area close to the 3-
phase contact line which could be done based on the gradient of
the volume-fraction function. Moreover, in 3D and for complex
geometries the definition of a suitable body force compensating
for the neglected viscous friction will be less straightforward. A
possibility to obtain this force without a fitting procedure would
be to resort to analytical solutions for the velocity field in a moving
wedge, such as given by Dussan [27].
Acknowledgements
The work has been supported by the DFG-Forschergruppe FOR
516/1 and by the German Ministry of Research and Education,
Grant No. 16SV1355.
References
[1] Hessel V, Hardt S, Löwe H. Chemical micro process engineering: fundamentals,
modelling and reactions. Weinheim: Wiley-VCH; 2004.
[2] Reyes DR, Iossifidis D, Auroux PA, Manz A. Micro total analysis systems. 1.
Introduction, theory, and technology. Anal Chem 2002;74:2623–36.
[3] Auroux PA, Iossifidis D, Reyes DR, Manz A. Micro total analysis systems. 2.
Analytical standard operations and applications. Anal Chem 2002;74:2637–52.
[4] Huh C, Scriven LE. Hydrodynamic model of steady movement of a solid/liquid/
fluid contact line. J Colloid Interface Sci 1971;35:85–101.
[5] Hocking LM. A moving fluid interface. Part 2. The removal of the force
singularity by a slip flow. J Fluid Mech 1977;79:209–29.
[6] Huh C, Mason SG. The steady movement of a liquid meniscus in a capillary
tube. J Fluid Mech 1977;81:401–19.
[7] Kistler S. Hydrodynamics of wetting. In: Wettability S, Berg JC, editors. New
York: Dekker; 1993.
[8] De Gennes PG. Wetting: statics and dynamics. Rev Mod Phys 1985;57:827–63.
[9] Cox RG. The dynamics of the spreading of liquids on a solid surface. Part 1.
Viscous flow. J Fluid Mech 1986;168:169–94.
[10] Levine S, Reed P, Watson EJ, Neale G. A theory of the rate of rise of a liquid in a
capillary. In: Kerker M, editor. Colloid and interface science, vol. III. New
York: Academic Press; 1976. p. 403–19.
[11] Lucas R. Über das Zeitgesetz des Kapillaren Aufstiegs von Flussigkeiten. Kolloid
Z 1918;23:15–21.
[12] Washburn E. The dynamics of capillary flow. Phys Rev 1921;17:273–83.
[13] Zhmud BV, Tiberg F, Hallstensson K. Dynamics of capillary rise. J Colloid
Interface Sci 2000;228:263–9.
[14] Lundgren TS, Sparrow EM, Starr JB. Pressure drop due to the entrance region in
ducts of arbitrary cross section. J Basic Eng 1964;86:620–6.
[15] Tanner LH. The spreading of silicone oil drops on horizontal surfaces. J Phys D:
Appl Phys 1979;12:1473–84.
[16] Bracke M, de Voeght F, Joos P. The kinetics of wetting: the dynamic contact
angle. Prog Colloid Polym Sci 1989;79:142–9.
[17] Zhou MY, Sheng P. Dynamics of immiscible-fluid displacement in a capillary
tube. Phys Rev Lett 1990;64:882–5.
[18] Quinte A, Halstenberg S, Eggert H, Peters RP, Schön C. Mikrosystemtechnische
Realisierung von medizinischen Teststreifen, Proceedings 8. Workshop,
Methoden und Werkzeuge zum Entwurf von Mikrosystemen‘‘, Berlin,
December 2–3, 1999;13–22.
[19] Brackbill JU, Kothe DB, Zemach C. A continuum method for modeling surface
tension. J Comp Phys 1992;100:335–54.
[20] Van Doormal
JP, Raithby GD. Enhancements of the SIMPLE method for
predicting incompressible fluid flows. Numer Heat Transfer 1984;7:
147–63.
[21] Ferziger JH, Peric M. Computational methods for fluid dynamics. 3rd
ed. Heidelberg: Springer; 2002.
[22] Van Leer B. Towards the ultimate conservative difference scheme. A second
order Sequel to Godunov’s Method. J Comp Phys 1979;32:101–36.
[23] Somalinga S, Bose A. Numerical investigation of boundary conditions for
moving contact line problems. Phys Fluids 2000;12:499–510.
[24] Sikalo S, Wilhelm H-D, Roisman IV, Jakirlic S, Tropea C. Dynamic contact angle
of spreading droplets: Experiments and simulations. Phys Fluids 2005;17:
0621031–13.
[25] Wölk G, Dreyer M, Rath HJ, Weislogel MM. Damped oscillations of liquid/gas
surface upon step reduction in gravity. J Spacecraft Rockets 1997;34(1):
110–7.
[26] Gerstmann
zur
J. Numerische Untersuchungen
freier
Flüssigkeitsoberflächen. Ph.D. Thesis, Fortschritt-Berichte VDI 7, 2004; 464,
ISBN 3-18-346407-1.
Schwingung
[27] Dussan EB. The moving contact line: the slip boundary condition. J. Fluid Mech
1976;77:665–84.
[28] Rider WJ, Kothe DB. Reconstructing volume tracking.
J Comp Phys
1998;141:112–52.
[29] Osher S, Sethian JA. Fronts propagating with curvature-dependent speed:
J Comp Phys
formulations.
algorithms based on Hamilton–Jacobi
1988;79:12–49.
�


 2023年江西萍乡中考道德与法治真题及答案.doc
 2012年重庆南川中考生物真题及答案.doc
 2013年江西师范大学地理学综合及文艺理论基础考研真题.doc
 2020年四川甘孜小升初语文真题及答案I卷.doc
 2020年注册岩土工程师专业基础考试真题及答案.doc
 2023-2024学年福建省厦门市九年级上学期数学月考试题及答案.doc
 2021-2022学年辽宁省沈阳市大东区九年级上学期语文期末试题及答案.doc
 2022-2023学年北京东城区初三第一学期物理期末试卷及答案.doc
 2018上半年江西教师资格初中地理学科知识与教学能力真题及答案.doc
 2012年河北国家公务员申论考试真题及答案-省级.doc
 2020-2021学年江苏省扬州市江都区邵樊片九年级上学期数学第一次质量检测试题及答案.doc
 2022下半年黑龙江教师资格证中学综合素质真题及答案.doc