Battery Energy Storage Systems and Electric Vehicles Power Systems
A New Battery Model for use with
H.L. Chan, D. Sutanto
Department of Electrical Engineering,
The Hong Kong Polytechnic University,
Hung Hom. Hong Kong.
FCZX : (852) 2330-1514
eesritantG3ii)oolvu edu hk
Abstract: This paper will initially present a review of the several
battery models used for Electric Vehicles and Battery Energy Storage
System applications. A model will be discussed which takes into
account the non-linear characteristics of the battery with respect to
the battery’s state of charge. Comparisons between simulation and
laboratory measurements will be presented. The effects of high
frequency switching on the battery performance will also be
discussed. A strategy to reduce the high frequency charging and
discharging curre‘nt will be proposed.
Keywords: Battery Model, Battery Energy Storage Systems, Electric
Vehicles, Battery Management.
I. INTRODUCTION
The development of electric vehicle has been accelerated by
the recent “California Initiative” which has required increasing
proportions of new vehicles in Los Angeles area to be Zero
Emission vehicles. Similar legislation has now been passed in
several other US states. This has impelled car manufacturers
throughout the world to have Electric Vehicles ready for the
market when the legislation is enforced. General Motors, for
example, has recently released the new EV 1 in USA. The
possibility of large amounts of Electric Vehicles on the road,
has also created interest in making better use of the spare
batteries that each Electric Vehicle must have. It has been
suggested that a Battery Charging station be made available by
the electric utilities, so that cars can come into the charging
station and have they batteries replaced in a short time.
While extensive research has been carried out to develop new
types of batteriks and converters to convert the batteries output
into useful work, very little work has been done in modeling
the battery itself. The fact that most power converters are now
switched at relatively very high frequency (much higher than
50Hz), will require new model of the batteries to take into
account the operation of the battery under this high switching
mode. This paper will initially present the current state-of-the
art of battery modeling for use in Electric Vehicles and Battery
Energy Storage System. A new model will be introduced
which takes into account the response of the batteries to high
frequency switching in the converter. Impact of battery
chargers will be also be discussed. Comparisons between
simulation and laboratory measurements will be presented.
Some of the issues that will be considered are given below.
11. FACTORS DETERMINING BATTERY CAPACITY
To have better performance of EV, the energy utilization of
battery capacity must be ensured. The following factors are
critical to determine battery capacity and must be considered
in any battery model:
1. Internal Resistance
Self-discharge Resistance which takes account of
resistances in (a) electrolysis of water at high voltage
and (b) slow leakage across the battery terminal at low
voltage. This resistance is more temperature-sensitive
and inversely proportional to the temperature change.
Resistances for Charge and Discharge: These are the
resistances associated with electrolyte resistance, plates
resistance and fluid resistance, however all these
resistances can be different
in charging and
discharging.
Overcharge and Overdischarge Resistance: When the
battery is overcharged or overdischarged, the internal
resistance will be increased significantly due to the
electrolyte diffusion.
2. Discharge Type:
- _
-
Continuous Discharging: When battery continuously
delivers energy to load without rest, and the battery
capacity is dropping continuously.
Intermittent Discharging: When a battery drives a load
for a period and is disconnected from the load for some
time, then voltage recovery will be took place in the
battery to increase its voltage with some amount. When
the battery is operating in this intermittent manner, it
will give a longer discharge time.
3. Discharge Mode:
Constant Load: When a battery delivers energy to a
load of constant resistance, so the load current is
decreasing as battery voltage does.
Constant Current: Current drawn from a battery is kept
constant to a load that continuously reduces its
resistance, the discharge duration in this mode is
shorter due to the average current is higher. The
voltage drops more faster than that in constant load.
Constant Power: A constant electrical power is drawn
by load from a battery, such that the load current will
be increasing to compensate for the decreasing battery
voltage. This mode has the shortest discharge time.
0-7803-5935-6/00/$10.00 (c) 2000 IEEE
470
�
4. Rate of Charge/Discharge: To extend the service life of
battery the rate of charge and discharge can not be too
high. Excessive overcharging and over-discharging can
reduce battery life. Further, the frequency of switching
needs to be taken into account, particularly now when the
EV or BESS batteries are subjected to high switching
frequency associated with the converters in the control
system.
111. BATTERY MODEL
In the following section, six battery models will be described
briefly. One of these is found to be simple and yet represents
many of the important features of the EV batteries.
A. Simple Battery Model
This model has been used by many battery manufacturers for
battery monitoring purposes.
C. Thevenin Battery Model
The other commonly used model is the Thevenin battery
model, which consists of an ideal no-load battery voltage (Eo),
internal resistance (R), capacitance (CO) and overvoltage
resistance (Ro). CO represents the capacitance of the parallel
plates and Ro represents the non-linear resistance contributed
by the contact resistance of plate to electrolyte.
CO
I
"O
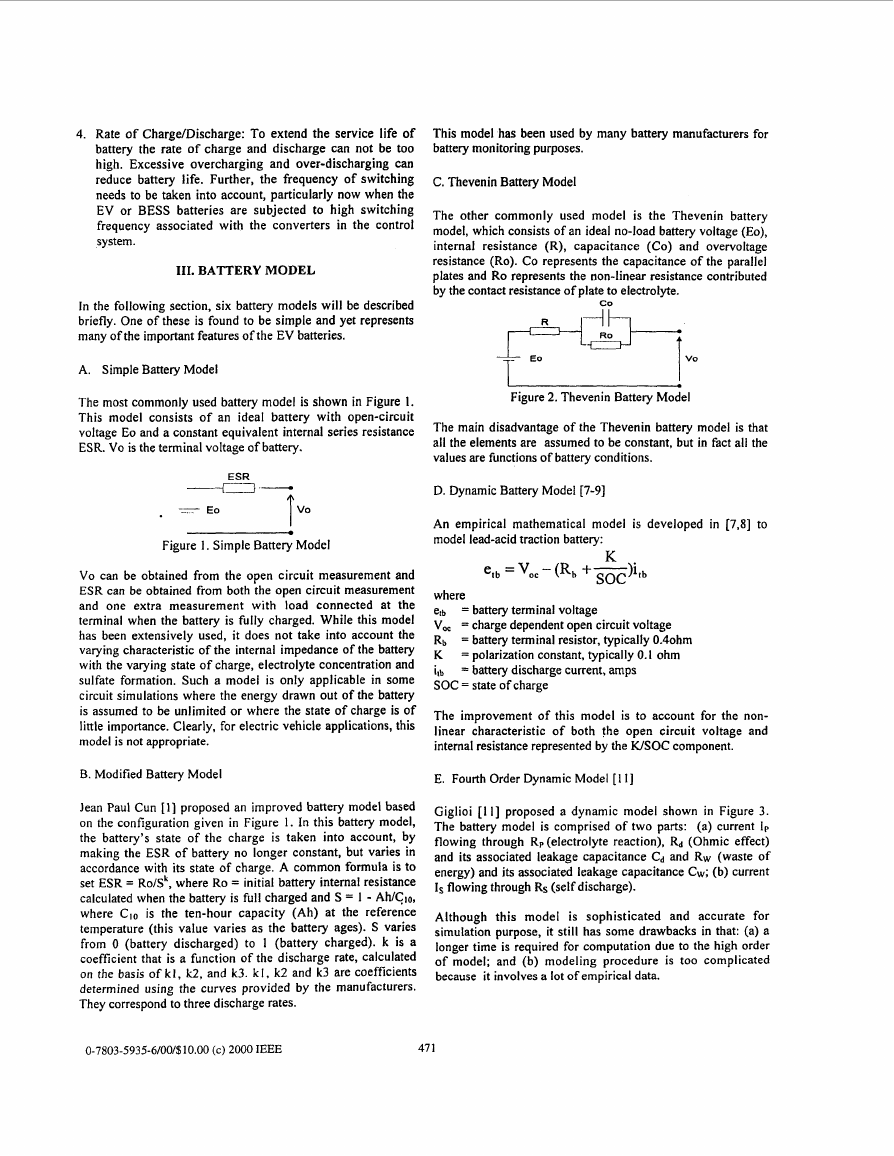
The most commonly used battery model is shown in Figure 1.
This model consists of an ideal battery with open-circuit
voltage Eo and a constant equivalent internal series resistance
ESR. Vo is the terminal voltage of battery.
Figure 2. Thevenin Battery Model
The main disadvantage of the Thevenin battery model is that
all the elements are assumed to be constant, but in fact all the
values are functions of battery conditions.
ESR
'--i.-4
--
Eo
I
v0
Figure I . Simple Battery Model
0
Vo can be obtained from the open circuit measurement and
ESR can be obtained from both the open circuit measurement
and one extra measurement with load connected at the
terminal when the battery is fully charged. While this model
has been extensively used, it does not take into account the
varying characteristic of the internal impedance of the battery
with the varying state of charge, electrolyte concentration and
sulfate formation. Such a model is only applicable in some
circuit simulations where the energy drawn out of the battery
is assumed to be unlimited or where the state of charge is of
little importance. Clearly, for electric vehicle applications, this
model is not appropriate.
B. Modified Battery Model
Jean Paul Cun [I] proposed an improved battery model based
on the configuration given in Figure 1. In this battery model,
the battery's state of the charge is taken into account, by
making the ESR of battery no longer constant, but varies in
accordance with its state of charge. A common formula is to
set ESR = Ro/Sk, where Ro = initial battery internal resistance
calculated when the battery is full charged and S = 1 - Ah/Clo,
where Clo is the ten-hour capacity (Ah) at the reference
temperature (this value varies as the battery ages). S varies
from 0 (battery discharged) to 1 (battery charged). k is a
coefficient that is a function of the discharge rate, calculated
on the basis of kl, k2, and k3. kl. k2 and k3 are coefficients
determined using the curves provided by the manufacturers.
They correspond to three discharge rates.
D. Dynamic Battery Model [7-91
An empirical mathematical model is developed in [7,8] to
model lead-acid traction battery:
K
e t b = - (Rb +=litb
= charge dependent open circuit voltage
where
etb = battery terminal voltage
V,
RI, = battery terminal resistor, typically OAohm
K = polarization constant, typically 0.1 ohm
i,b = battery discharge current, amps
SOC = state of charge
The improvement of this model is to account for the non-
linear characteristic of both the open circuit voltage and
internal resistance represented by the WSOC component.
E. Fourth Order Dynamic Model [ 1 I]
Giglioi [I I] proposed a dynamic model shown in Figure 3.
The battery model is comprised of two parts: (a) current Ip
flowing through RP (electrolyte reaction), Rd (Ohmic effect)
and its associated leakage capacitance Ca and RW (waste of
energy) and its associated leakage capacitance CW; (b) current
Is flowing through RS (self discharge).
Although this model is sophisticated and accurate for
simulation purpose, it still has some drawbacks in that: (a) a
longer time is required for computation due to the high order
of model; and (b) modeling procedure is too complicated
because it involves a lot of empirical data.
0-7803-5935-6/00/$10.00 (c) 2000 IEEE
47 1
�
F. Over-Current Battery Model [IO]
G. Improved Battery Model [2,4]
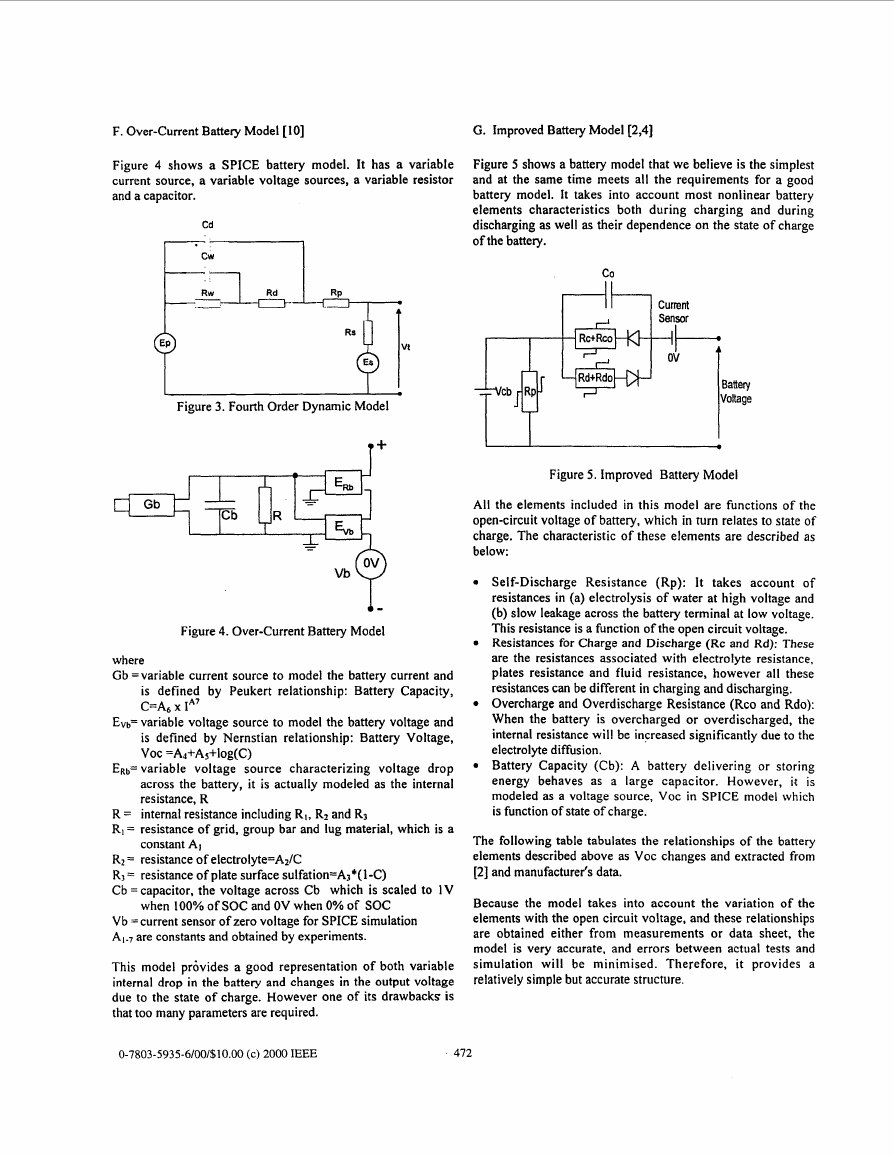
Figure 4 shows a SPICE battery model. It has a variable
current source, a variable voltage sources, a variable resistor
and a capacitor.
Figure 5 shows a battery model that we believe is the simplest
and at the same time meets all the requirements for a good
battery model. It takes into account most nonlinear battery
elements characteristics both during charging and during
discharging as well as their dependence on the state of charge
of the battery. fiji
Current
Sensor
L
Figure 3. Fourth Order Dynamic Model
I
.
I
I
1
'
2
Battery
Voltage
Gb
t+ - I
T J E m L
* -
Y
Evb A
vb
4-
Figure 4. Over-Current Battery Model
where
Gb =variable current source to model the battery current and
is defined by Peukert relationship: Battery Capacity,
C = A ~ x I*'
EVb= variable voltage source to model the battery voltage and
is defined by Nernstian relationship: Battery Voltage,
VOC =Ad+As+log(C)
ERI,= variable voltage source characterizing voltage drop
across the battery, it is actually modeled as the internal
resistance, R
constant AI
R = internal resistance including RI, R2 and Rs
RI = resistance of grid, group bar and lug material, which is a
R2 = resistance of electrolyte=Az/C
R3 = resistance of plate surface sulfation=AJ*(l-C)
Cb =capacitor, the voltage across Cb which is scaled to 1V
when 100% of SOC and OV when 0% of SOC
Vb =current sensor of zero voltage for SPICE simulation
A,-, are constants and obtained by experiments.
This model provides a good representation of both variable
internal drop in the battery and changes in the output voltage
due to the state of charge. However one of its drawbacks is
that too many parameters are required.
Figure 5 . Improved Battery Model
All the elements included in this model are functions of the
open-circuit voltage of battery, which in turn relates to state of
charge. The characteristic of these elements are described as
below:
Self-Discharge Resistance (Rp): It takes account of
resistances in (a) electrolysis of water at high voltage and
(b) slow leakage across the battery terminal at low voltage.
This resistance is a function of the open circuit voltage.
Resistances for Charge and Discharge (Rc and Rd): These
are the resistances associated with electrolyte resistance,
plates resistance and fluid resistance, however all these
resistances can be different in charging and discharging.
Overcharge and Overdischarge Resistance (Rco and Rdo):
When the battery is overcharged or overdischarged, the
internal resistance will be increased significantly due to the
electrolyte diffusion.
Battery Capacity (Cb): A battery delivering or storing
energy behaves as a large capacitor. However, it i s
modeled as a voltage source, VOC in SPICE model which
is function of state of charge.
The following table tabulates the relationships of the battery
elements described above as VOC changes and extracted from
[2] and manufacturer's data.
Because the model takes into account the variation of the
elements with the open circuit voltage. and these relationships
are obtained either from measurements or data sheet, the
model is very accurate, and errors between actual tests and
simulation will be minimised. Therefore, it provides a
relatively simple but accurate structure.
0-7803-5935-6/00/$10.00 (c) 2000 IEEE
47 2
�
Table I. Parameters of Battery Elements -
voc I Rp n voc I Rc I voc I Rd I soc,
O.OOoc(
195.d O.OO@ 0.1164 4.0000( 4 . 0 4
0.d
3%
0.000
5.450
5.700
5.8 IO
6. I87
6.406
6.718
3.437
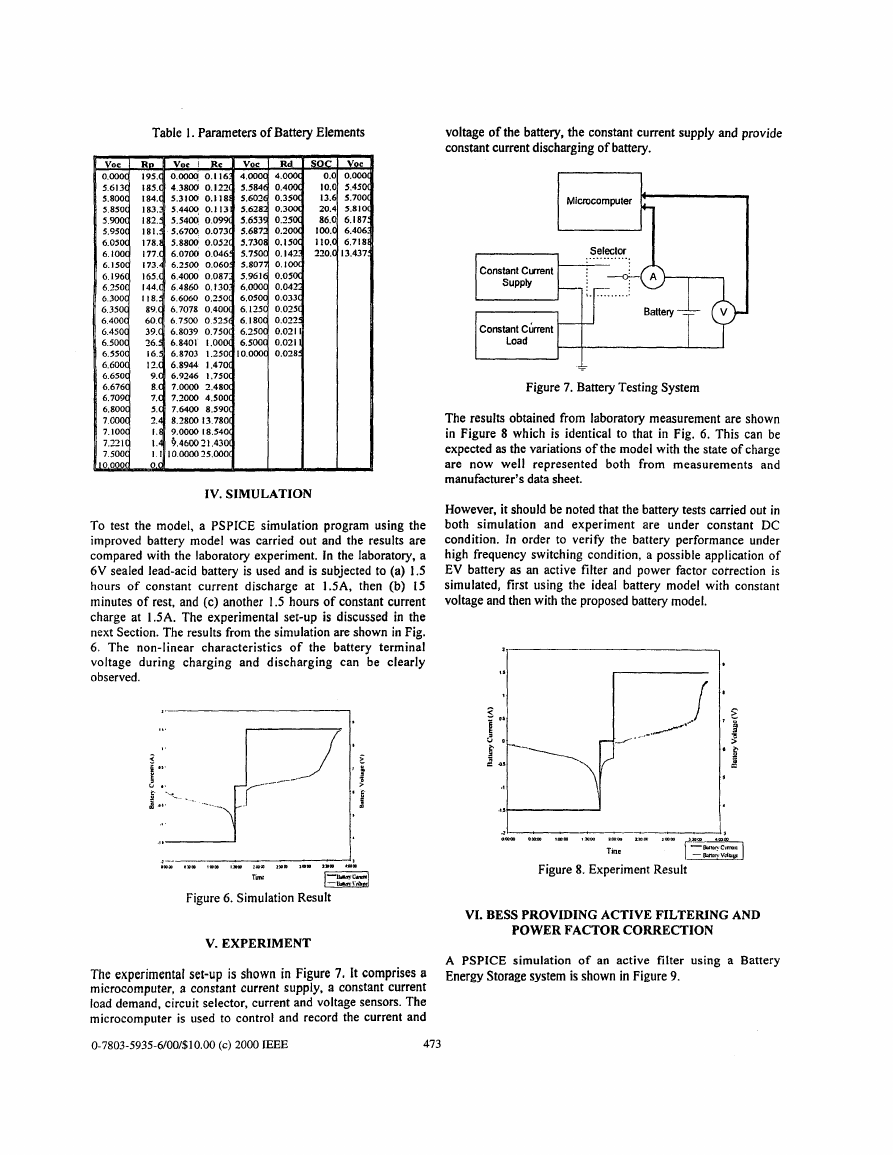
voltage of the battery, the constant current supply and provide
constant current discharging of battery.
Microcomputer m
,
Load
i [ . l ..........
Constant Chent
,
Figure 7. Battery Testing System
--
The results obtained from laboratory measurement are shown
in Figure 8 which is identical to that in Fig. 6. This can be
expected as the variations of the model with the state of charge
are now well represented both from measurements and
manufacturer's data sheet.
However, it should be noted that the battery tests carried out in
both simulation and experiment are under constant DC
condition. in order to verify the battery performance under
high frequency switching condition, a possible application of
EV battery as an active filter and power factor correction is
simulated, first using the ideal battery model with constant
voltage and then withthe proposed battery model.
'I
*mm
0"
,mm I"
*"
2"
Tine
Figure 8. Experiment Result
VI. BESS PROVIDING ACTIVE FILTERING AND
POWER FACTOR CORRECTION
A PSPICE simulation of an active filter using a Battery
Energy Storage system is shown in Figure 9.
poood
0.d
I
I
IV. SIMULATION
To test the model, a PSPICE simulation program using the
improved battery model was carried out and the results are
compared with the laboratory experiment. In the laboratory, a
6V sealed lead-acid battery is used and is subjected to (a) 1.5
hours of constant current discharge at 1.5A. then (b) 15
minutes of rest, and (c) another 1.5 hours of constant current
charge at 1.5A. The experimental set-up is discussed in the
next Section. The results from the simulation are shown in Fig.
6. The non-linear characteristics of the battery terminal
voltage during charging and discharging can be clearly
observed.
1.
V. EXPERIMENT
The experimental set-up is shown in Figure 7. It comprises a
microcomputer, a constant current supply. a constant current
load demand, circuit selector, current and voltage sensors. The
microcomputer is used to control and record the current and
0-7803-5935-6/00/$10.00 (c) 2000 IEEE
473
�
..............................................
Active Filter
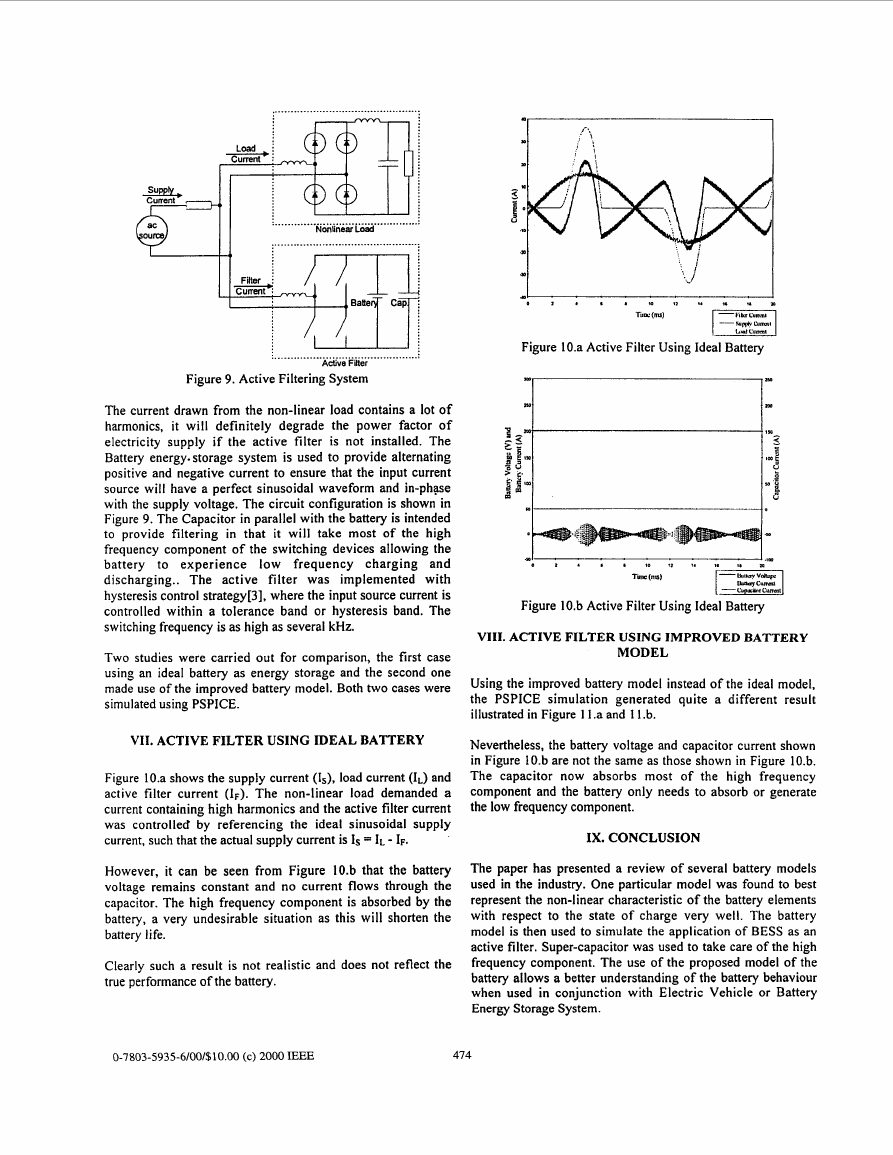
Figure 9. Active Filtering System
8
The current drawn from the non-linear load contains a lot of
harmonics, it will definitely degrade the power factor of
electricity supply if the active filter is not installed. The
Battery energy. storage system is used to provide alternating
positive and negative current to ensure that the input current
source will have a perfect sinusoidal waveform and in-phase
with the supply voltage. The circuit configuration is shown in
Figure 9. The Capacitor in parallel with the battery is intended
to provide filtering in that it will take most of the high
frequency component of the switching devices allowing the
battery
low frequency charging and
discharging.. The active filter was implemented with
hysteresis control strategy[3], where the input source current is
controlled within a tolerance band or hysteresis band. The
switching frequency is as high as several kHz.
to experience
Two studies were carried out for comparison, the first case
using an ideal battery as energy storage and the second one
made use of the improved battery model. Both two cases were
simulated using PSPICE.
VII. ACTIVE FILTER USING IDEAL BATTERY
Figure 10.a shows the supply current (Is),
load current (IL) and
active filter current (IF). The non-linear load demanded a
current containing high harmonics and the active filter current
was controlled by referencing the ideal sinusoidal supply
current, such that the actual supply current is IS = I t - IF.
However, it can be seen from Figure 1O.b that the battery
voltage remains constant and no current flows through the
capacitor. The high frequency component is absorbed by the
battery, a very undesirable situation as this will shorten the
battery life.
Clearly such a result is not realistic and does not reflect the
true performance of the battery.
0
I
.
' I
,
0
1
,
*
.
Tim (nu)
Figure 10.a Active Filter Using Ideal Battery
I
. ' I
4 1
0
2
Tinu! (nu)
I
4
------+
Figure 10.b Active Filter Using Ideal Battery
VJII. ACTIVE FILTER USING IMPROVED BATTERY
MODEL
Using the improved battery model instead of the ideal model,
the PSPICE simulation generated quite a different result
illustrated in Figure 1 1 .a and 1 1 .b.
Nevertheless, the battery voltage and capacitor current shown
in Figure 10.b are not the same as those shown in Figure 10.b.
The capacitor now absorbs most of the high frequency
component and the battery only needs to absorb or generate
the low frequency component.
IX. CONCLUSION
The paper has presented a review of several battery models
used in the industry. One particular model was found to best
represent the non-linear characteristic of the battery elements
with respect to the state of charge very well. The battery
model is then used to simulate the application of BESS as an
active filter. Super-capacitor was used to take care of the high
frequency component. The use of the proposed model of the
battery allows a better understanding of the battery behaviour
when used in conjunction with Electric Vehicle or Battery
Energy Storage System.
0-7803-5935-6/001$10.00 (c) 2000 IEEE
474
�
Ziyad M. Salameh, Margaret A. Casacca and William
A. Lynch, "A Mathematical Model for Lead-Acid
Batteries", IEEE Trans. on Energy Conversion. Vol. 7,
No. 1, March 1992
C. E. Lin, M. T. Tsai, Y. S. Shiao and C. L. Huang,
"An Active Filter for Reactive and Harmonic
Compensation Using Voltage Source Inverter", IEE
Int'l Conference on Advances in Power System
Control, Operation and Management, November
199 1, Hong Kong.
Margaret A. Casacca and Ziyad M. Salameh,
"Determination of Lead-Acid Battery Capacity
Via Mathematical Modeling Techniques", IEEE
Trans. on Energy Conversion. Vol. 7, No. 3, Sept.
1992
"Rechargeable Batteries Applications Handbook",
TK294 I .R43 1991, Technical Marketing Staff of
Gates Energy Products, Inc.
David Linden, "Handbook of Batteries" Second
Edition, TK290 1 .H36 1994, McGraw-Hill, 1994
and Morgan, C., "A N e w
Jayne, M.G.,
Mathematical Model of a Lead Acid Battery for
Electric Vehicles", Eighth Int'l Electric Vehicle
Conference, Washington, D.C., October 1986.
Sims, R.I., Carnes, J.C., Dzieciuch, M.A. and
Fenton, J.E., "Computer Modeling of Automotive
Lead Acid Batteries", Ford Research Laboratories
Technical Report SR-90- 154, Sept., 25, I990
Jayanths, M.S., Hayhoe, G.F., and Henry, J.J.,
"Modeling and Digital Computer Simulation of an
Electric Vehicle", Technical Report, Pennsylvania
Transportation Institute, Pennsylvania State
University, University Park Pennsylvania, August,
1979.
Robbins, T.; Hawkins, J. "Battery model for
Overcurrent Protection Simulation of DC
Di s t r i but i o n System S",
INTEL E C . S i x t e e n t h
International Telecommunications Energy
Conference, p307- 14.
Giglioli R., Cerolo P., "Charge and Discharge Fourth
Order Dynamic Model of the Lead Battery", 10Ih Int'l
Electric Vehicle Symposium, Hong Kong, 1990, p. 1-9.
4
1
D
,
.
.
I
W
I
I
~
.
Tinw(mr)
I
[41
Figure 1 1 .a Active Filter Using Improved Model
The supply current, load current and filter current in Figure
10.a follows similar pattern as before.
rm-
i m
t-
.
,
0
2
4
2
,
.
7
6
m
*
T k (m)
r61
171
r81
[91
Figure 1 I .b Active Filter Using Improved Model
X. ACKNOWLEDGMENTS
The authors gratefully acknowledge the financial contributions
of the Hong Kong University Grants Committee and the Hong
Kong Polytechnic University to the project and to Mr. Jim
McDowall, Chair, PES Stationary Battery Committee for his
comments on the abstract of the paper.
XI. REFERENCES
[I]
Jean Paul CUN, Jean No FIORINA, Michael
FRAISSE, Henri MABBOUX, "The Experience of a
UPS Company in Advanced Battery Monitoring",
MGE UPS Systems, Grenoble, France,'http://www-
merlin-gerin.eunet.fr/news/techpap/tp02us.ht'
0-7803-5935-6/00/$10.00 (c) 2000 IEEE
475
�



 2023年江西萍乡中考道德与法治真题及答案.doc
 2012年重庆南川中考生物真题及答案.doc
 2013年江西师范大学地理学综合及文艺理论基础考研真题.doc
 2020年四川甘孜小升初语文真题及答案I卷.doc
 2020年注册岩土工程师专业基础考试真题及答案.doc
 2023-2024学年福建省厦门市九年级上学期数学月考试题及答案.doc
 2021-2022学年辽宁省沈阳市大东区九年级上学期语文期末试题及答案.doc
 2022-2023学年北京东城区初三第一学期物理期末试卷及答案.doc
 2018上半年江西教师资格初中地理学科知识与教学能力真题及答案.doc
 2012年河北国家公务员申论考试真题及答案-省级.doc
 2020-2021学年江苏省扬州市江都区邵樊片九年级上学期数学第一次质量检测试题及答案.doc
 2022下半年黑龙江教师资格证中学综合素质真题及答案.doc