IET Signal Processing
Research Article
Inverse synthetic aperture radar imaging of
targets with complex motion based on cubic
Chirplet decomposition
Yong Wang ✉, Bin Zhao, Yicheng Jiang
Research Institute of Electronic Engineering Technology, Harbin Institute of Technology, Harbin 150001, People’s Republic of China
✉ E-mail: wangyong6012@hit.edu.cn
ISSN 1751-9675
Received on 18th December 2013
Revised on 6th August 2014
Accepted on 4th February 2015
doi: 10.1049/iet-spr.2014.0086
www.ietdl.org
Abstract: High resolution inverse synthetic aperture radar (ISAR) imaging of targets with complex motion is a main topic in
the radar imaging domain. In fact, the traditional range-Doppler algorithm is not appropriate to generate a focused ISAR
images because of the time-varying Doppler shifts caused by the target’s complex motion. In this study, the azimuth
received signal is modelled as multi-component amplitude-modulated and frequency-modulated (AM–FM) signal, and a
novel algorithm for the cubic Chirplet decomposition based on generalised cubic phase function is proposed to
investigate the AM–FM signal analytically. Then, the corresponding ISAR imaging algorithm associated with the range-
instantaneous-Doppler technique is proposed. Results of simulated and real data demonstrate the effectiveness of the
presented algorithm.
1
Introduction
(RD)
range-Doppler
Inverse synthetic aperture radar (ISAR) imaging has received much
attention for more than three decades and is used to reconstruct
high-resolution radar images of targets [1–4]. For the targets with
smooth motion, the focused ISAR images can be obtained by the
conventional
technique [5]. The highest
resolution in the range coordinate is achieved by the large
bandwidth transmitted signals combined with pulse compression
technique, and the high cross-range resolution is obtained by using
the Doppler effect of a revolving target. The primary step for the
RD algorithm is the translational motion compensation, which
includes
the range alignment and phase adjustment. Many
available approaches have been proposed in recent years about the
motion compensation [6–9].
However, in many applications, the target is manoeuvring or
undergoes non-uniform angular motions. The RD algorithm fails
in this case because of the time varying character of the Doppler
frequency of each scatterer contribution. Therefore the received
signal in a range bin can be considered as multi-component, high
order polynomial phase signal with time-varying amplitude, and
several effective algorithms based on range-instantaneous-Doppler
(RID) or range-instantaneous-chirp-rate (RIC) techniques [10, 11]
have been proposed to deal with this problem. They can be
summarised as follows:
(1) Linear frequency modulated (LFM) signal model. It is used in the
situation where the target’s manoeuvrability is not too severe, and
the received signal
in a range bin can be approximated as
multi-component LFM signal with constant amplitude. The high
quality instantaneous ISAR images can be obtained by estimating
the parameters of the LFM signal associated with the RID or RIC
techniques. These algorithms include Radon–Wigner transform
[12], DechirpClean [13], fractional Fourier transform [14] and the
match Fourier transform [15].
(2) Cubic phase signal (CPS) model. For targets with significant
complex motion, the high order terms will exist in the azimuth
echoes, and the received signal
should be modelled as a
multi-component CPS. It is more accurate than the LFM signal
model
in ISAR imaging. The corresponding ISAR imaging
methods include the TC-DechirpClean algorithm [16], the cubic
phase function (CPF) algorithm [17], the product generalised CPF
IET Signal Process., 2015, Vol. 9, Iss. 5, pp. 419–429
& The Institution of Engineering and Technology 2015
algorithm [18], the product high-order matched-phase transform
(PHMT) [19] and the modified discrete chirp Fourier transform [20].
(3) Amplitude-modulated and frequency-modulated (AM–FM)
signal model. Compared with the aforementioned LFM and CPS
the AM–FM signal model considers the time-varying
models,
character for the amplitude, and this is more close to the real
situation. One kind of ISAR imaging algorithm based on the AM–
FM model uses the time–frequency distributions (TFDs), where
high resolution TFDs with reduced cross-term are used to
substitute the Fourier
transform in azimuth focusing. These
algorithms include joint time–frequency analysis [21, 22], short
time Fourier transform [23], high order TFDs [24, 25] and some
improved version of Cohen’s class distributions [26, 27]. The
other kind of
ISAR imaging algorithm is based on adaptive
Chirplet decomposition. It is an efficient way to analyse AM–FM
signals by decomposing it
redundant well
into parametric,
localised components in the time–frequency plane [28]. These
ISAR imaging algorithms are shown in [29–32].
the AM–FM signal model
Considering the complication for the target’s motion and the
accuracy for the received signal,
is
studied in this paper. A novel signal decomposition method known
as the cubic Chirplet decomposition based on the generalised CPF
(GCPF) [33] is proposed. By extending the conventional Chirplet
atom with cubic phase term, the signal decomposition accuracy
can be improved. This is advantageous for ISAR imaging of
targets with complex motion.
1.1 Background for the algorithms of Chirplet
decomposition with improved version
load. Then,
from the exhaustive computational
The Chirplet decomposition based on the maximum-likelihood
algorithm is a multi-dimensional optimisation procedure, and
suffers
the
matching pursuit-based adaptive Chirplet decomposition algorithm
is proposed, but the signal is usually dominated by a few leading
terms and the computational speed still needs to be improved [34].
Some other efficient algorithms, such as the fast refinement for
adaptive Chirplet decomposition is proposed in [35] with high
accuracy,
the RELAX method for recursive Chirplet parameter
estimation is proposed in [36], and the product CPF (PCPF)-based
algorithm is proposed in [37]. In [38], a modified version of
419
�
Chirplet atom is proposed by introducing an extra curvature
parameter, which is more effective for the signals with high
non-linearity than the conventional Chirplet atom. In [39],
the
polynomial Chirplet transform is proposed as an extension for the
traditional Chirplet transform, but it suffers from the computational
load for the iteration procedure. In [40], the authors proposed the
maximum-likelihood
Chirplet
decomposition, and it still suffers from the computational load for
the multi-dimensional maximisations. Hence,
the parameters
estimation of high order Chirplet atom remains an open research
topic in the field of signal processing.
algorithm for
cubic
the
1.2 Contributions and organisations of this paper
cubic Chirplet
This paper deals with the problem of novel algorithm of signal
decomposition based on the
atom and its
application in ISAR imaging of target with complex motion, and it
is organised as follows. In Section 2, the ISAR imaging geometry
and the AM–FM signal model for the azimuth received signal are
established; in Section 3, the implementation of the cubic Chirplet
decomposition and the corresponding ISAR imaging algorithm for
targets with complex motion are presented; in Section 4, the ISAR
imaging results for simulated and real data are provided. Section 5
is the conclusion for the paper.
2
ISAR imaging geometry and signal model
The primary step for ISAR imaging is the motion compensation for
the received signal. It
includes the range alignment and phase
adjustment [41]. The range alignment can be implemented by the
accumulated form of a maximum correlation method with the
purpose of translational component compensation of each scatterer
after the range compressed. This can be shown as follows
+1
N−1
−1
i=1
R(s) =
si(r)
sN (r − s) dr
where si(r), i = 1, 2, … is the range profile after range compressed. It
is assumed that the former (N − 1) range profiles have been aligned
by the maximum correlation method, and the sN(r) can be aligned
with the accumulated form of them in order to reduce the drift and
jump errors.
The phase adjustment can be implemented by the constant phase
error elimination algorithm to eliminate the phase shift between two
adjacent range profiles. This can be shown as follows
∗
i (r)si+1(r) dr
s
si(r)si+1(r)
dr
,
w= angle
After
the motion compensation,
where * denotes the conjugate. Then, the phase error between si(r)
and si+1(r) can be eliminated by ejj, and the average phase shift
between the two range profiles tends to zero.
the imaging target can be
considered as a ‘turntable’ target, and the ISAR imaging geometry
of it is shown in Fig. 1. The essence of Fig. 1 is expounding the
concept of ISAR image projection plane. In Fig. 1, the original
point O in the (X, Y, Z) Cartesian coordinate representing the
rotating centre of the target, the unit vector of the radar line of
sight (RLOS) is represented as r, and the synthetic vector for the
angular velocity of the rotating target is represented as Ω. The
vector Ω can be decomposed into two independent components Ωr
and Ωe, which indicate the components parallel and perpendicular
to the vector r, respectively. Vector Ωr has no effect on the
received signal phase because it does not cause radial motion, but
vector Ωe will affect the phase and cause the change of Doppler
frequency, which is the effective rotating vector for the azimuth
imaging. R is a vector from the origin to the position vector of a
420
Fig. 1 Geometry of radar imaging of target with complex motion
random scatterer P on the target. The line velocity of scatterer P is
Ωe × R, and the radial component is (Ωe × R)·r [16].
Then, we can obtain the Doppler frequency of scatterer P from
Fig. 1 as follows
= 2
l
fd
V
e
· r
× R
= 2
l
· R × r
(
)
V
e
(3)
where × and · denote the outer and inner products, respectively, and
lis the wavelength. The derivation of (3) has used the mixed product
property. The effective vector Ωe can be expressed as follows for the
target’s complex motion
(1)
=
V
e
Vm−1tm−1
(4)
K
m=1
where Ω0, Ω1, Ω2, Ω3 … are the coefficients, K is the phase order and
t represents the azimuth time (or slow time). Substitute (4) into (3),
the Doppler frequency can be further written as
K
m=1
= 2
l
fd
Vm−1tm−1
· (R × r)
i = 1, 2, . . .
(2)
Then, the distance from scatterer P to the radar can be expressed as
[16]
(5)
(6)
t
fddt =
K
t0
+ 1
m
m=1
t
t0
D(t) = l
2
= R0
K
Vm−1tm−1
m=1
· (R × r)
Vm−1tm
· (R × r)
dt
where R0 denotes the initial distance from radar to the target centre at
the initial time t0. Assume that there are Q scatterers in a range bin,
and the corresponding azimuth received signal can be expressed as
Q
Q
i=1
i=1
Ai(t) exp −j
K
Di(t)
4p
l
+
Ai(t) exp j Fi
hi,mtm
m=1
s(t) =
=
(7)
where Ai(t), i = 1, 2, …, Q is the time-varying amplitude of the ith
IET Signal Process., 2015, Vol. 9, Iss. 5, pp. 419–429
& The Institution of Engineering and Technology 2015
�
scatterer, ηi,m is the phase coefficient and
⎧⎪⎨
⎪⎩
Fi
hi,m
R0,
= − 4p
l
= 1
Vm−1
m
i = 1, 2, . . . , Q
· Ri × r
,
i = 1, 2, . . . , Q
(8)
We can see from (7) that the received signal in a range bin can be
characterised as multi-component AM–FM signal for the complex
motion of the target.
Cubic Chirplet decomposition and ISAR
3
imaging algorithm
3.1
Traditional Chirplet decomposition
The Chirplet decomposition for signal s(t) decomposes it into terms
of well-defined and localised energy components, and consequently
the localised time–frequency variations can be captured for the
signal. The Chirplet atom is defined as follows [28]
4
1
ps2
k
exp − (t − tk)2
2s2
k
gk(t) =
+ jvk(t − tk) + jbk(t − tk)2
(9)
where the parameter (tk, ωk) ∈ R determines the time and frequency
centres for the chirp function, βk ∈ R denotes the chirp rate and the
variance σk ∈ R+ controls the width for the chirp function. Then,
the signal s(t) can be expressed as
1
s(t) =
Ckgk(t)
k=0
(10)
where Ck is the weighted coefficient.
Some efficient algorithms for the Chirplet decomposition have
recently been proposed, which has been introduced in [34–37].
Here, we consider an example where the Chirplet decomposition is
applied to a signal consisting of two cubic chirps as the form of
(7), and the parameters are shown in Table 1, where t ∈ [ −2s, 2s]
Table 1 Parameters of the simulated signal
Components (i)
Ai(t)
1
2
2
1
Φi
0
0
ηi,1
1.2π
0.2π
ηi,2
× 2.3
× 1.3
1
2
1
2
ηi,3
× 5
1
3
× 14
− 1
3
decomposition. We
and the sampling frequency is 64 Hz. Fig. 2a is the Wigner–Ville
distribution (WVD) for the signal; Fig. 2b is the WVD after the
Chirplet
the Chirplet
decomposition is an efficient way to analyse the multi-component
cubic chirp signals, but the Chirplet atom still has the form of
LFM signal, and cannot characterise the complicated polynomial
phase signals with more accuracy, especially in the joint for the
two Chirplet components.
that
can
see
Remark 1: The WVD is a bilinear TFD [27], and thus it suffers from
the cross-term for multi-component signals. This is obvious in
Fig. 2a, and the auto-term cannot be detected correctly with the
influence of the cross term. After the Chirplet decomposition, the
original signal can be represented as the sum of weighted Chirplet
atoms, as shown in (9) and (10). The Chirplet atom has the form
of a LFM signal with Gaussian envelope, and it can be well
represented by the WVD with optimal time–frequency resolution,
which can be seen from Fig. 2b. Furthermore, the cross-term can
be avoided after
is very
signal. The
significant
‘relative time’ and ‘relative frequency’ in Fig. 2 represent
the
number of
in the time and frequency domains,
respectively, and are not the true values of time and frequency.
the Chirplet decomposition. This
the analysis of multi-component
samplings
for
In order to improve the analysis performance of multi-component
signals with high non-linear instantaneous frequency trajectories,
such as the aforementioned two-component cubic chirps, the cubic
Chirplet decomposition is more appropriate than the traditional
Chirplet decomposition. The cubic Chirplet atom can match the
complicated signals with high precision, and it is proposed in [38]
as a modified version of Chirplet atom. In this paper, an efficient
algorithm for cubic Chirplet decomposition is proposed, which is
introduced in Section 3.2.
3.2 Cubic Chirplet decomposition
The cubic Chirplet atom is defined as follows by introducing a
curvature parameter γk to the conventional Chirplet atom in [38]
hk(t) =
4
1
ps2
k
exp − (t − tk)2
2s2
k
+jbk(t − tk)2 + jgk(t − tk)3
+ jvk(t − tk)
(11)
Compared with the conventional Chirplet atom in (9), we can notice
that the cubic Chirplet atom consists of further multiplying gk(t) with
the term exp[ jγk(t − tk)3]. The curvature parameter γk has a bending
effect and it is particularly effective to track the evolution against
Fig. 2 Time–frequency representations for two-component cubic chirps
a WVD
b WVD after Chirplet decomposition
c RSPWVD after cubic Chirplet decomposition
IET Signal Process., 2015, Vol. 9, Iss. 5, pp. 419–429
& The Institution of Engineering and Technology 2015
421
�
time of
non-linearity.
the instantaneous
frequency characterised by high
where
Then, the signal s(t) can be represented by a sum of hk(t), that is
1
s(t) =
Dkhk(t)
k=0
(12)
where Dk is the weighted coefficient to be determined.
In this paper, a novel algorithm for cubic Chirplet decomposition
based on the GCPF is proposed. This algorithm requires only
one-dimensional (1D) maximisations with high accuracy, and the
principle of it can be summarised as three steps:
B3
B1
k ps2
k
= D4
−1
= exp − 2 t2 + t2
= exp 4jt vk
B2
k
s2
k
+ gkt2 + 3gkt2
− p
k
− 2bktk
kt u − 12gk
s2
2
4
F = 1
2
arctan
(19)
(20)
(21)
(22)
Step 1: Construct a cubic Chirplet atom h0(t) with the condition that
the distance between s(t) and its orthogonal projection on h0(t) is
minimum, which can be illustrated as
D0
2= max
h0
2,
ks0(t), h0(t)l
s0(t) = s(t)
(13)
Step 2: Compute the remainder signal s1(t) after h0(t) is estimated
s1(t) = s0(t) − D0h0(t)
(14)
Step 3: Repeat the steps above until the residual signal energy
satisfies a given threshold, we obtain
u)|
the
|GCPF(t,
It is obvious from (18) that, for a cubic Chirplet atom as shown in
u = 12γk. For
(16),
multi-component cubic Chirplet atoms, the cross term or spurious
peak will appear for the non-linearity of GCPF. In this case, the
integrated form of GCPF (IGCPF) can be used to reduce the cross
term or spurious peak, and it is defined as follows
yields
peak
at
a
+1
dt
IGCPF(u) =
GCPF(t, u)
(23)
0
The principle of cross term or spurious peak elimination for IGCPF
algorithm is based on the time-dependent and dispersion character
for the cross term or spurious peak, whereas the autoterm is
time-independent and therefore can be amplified by the integration
operation.
Hence, for multi-component cubic Chirplet atoms, the curvature
γk for the first component can be estimated by
= arg max
u
/12
IGCPF(u)
(24)
Then, the original cubic Chirplet atom can be dechirped as follows
sk(t) = sk−1(t) − Dk−1hk−1(t)
(15)
gk
We can see from the steps above that the essence of cubic Chirplet
decomposition is the parameters estimation of each cubic Chirplet
atom. This can be implemented by the GCPF algorithm in this paper.
For a weighted cubic Chirplet atom with the following structure
where
s(t) = Dk
exp − (t − tk)2
+ jbk(t − tk)2 + jgk(t − tk)3
1
ps2
k
2s2
k
4
+ jvk(t − tk)
(16)
y(t) = s(t) exp (−jgkt3) = y1(t) + y2(t)
× exp jF3
−0.25
exp − (t − tk)2
y1(t) = Dk ps2
× exp jF2
× exp jF1
2s2
k
k
(25)
(26)
1
y2(t) =
− (t − tm)2
m=0,m=k
2s2
m
4
Dm
1
ps2
m
exp
+ jvm(t − tm) + jbm(t − tm)2 + j(gm
− gk)(t − tk)3
The GCPF is proposed in [33] for the parameters estimation of cubic
Chirps, and it is defined as
+1
GCPF(t, u) =
s(t + t)s(t − t)s
∗
( − t + t)s
∗
0
× (−t − t) exp (−jutt2) dt
and
(17)
Substitute (16) into (17), we obtain
+1
exp − 2t2
GCPF(t, u) = B1B2B3
s2
k
× exp jt2 12gk
− u
√
dt
t
2t2 + 4/s4
= B1B2B3
p
− u
2
0
4
12gk
k
exp jF
(18)
We can see from (28)–(30) that, y1(t) has the form of LFM signal
− 3gktk.
with Gaussian envelop, and the chirp rate is
y2(t) is the residual multi-component cubic Chirplet atoms. The
following step is estimating the chirp rate ˆbk from y1(t) by the
= bk
ˆbk
422
IET Signal Process., 2015, Vol. 9, Iss. 5, pp. 419–429
& The Institution of Engineering and Technology 2015
(27)
(28)
(29)
(30)
− 3gktk
= t2 bk
F1
= t vk
= −vktk
F2
F3
− 2bktk
+ bkt2
+ 3gkt2
− gkt3
k
k
k
�
CPF proposed in [42], just as follows
(t, v) =
CPFy1
0
+1
y1(t + t)y1(t − t) exp (−jvt2) dt
−0.5
exp − (t − tk)2
= D2
× exp 2jF2
× exp 2jF3
k ps2
k
+1
× exp 2jF1
exp − t2
×
− v
+ jt2 2 ˆbk
s2
k
s2
k
dt
0
(31)
Hence
CPFy1
(t, v)
= D2
k ps2
k
−0.5
exp − (t − tk)2
s2
k
4
2
√
2+1/s4
p
− v
2 ˆbk
k
(32)
It is obvious from (31) that, |CPFy1(t, v)| yields a peak at v = 2 ˆbk,
whereas the CPF for the residual signal y2(t) is spread. Analogous
with the IGCPF, we use the integrated form of CPF (ICPF) to
reduce the cross term or spurious peak for multi-component
signals. The ICPF is proposed in [43]
the parameters
estimation of multi-component LFM signals, and it is defined as
for
+1
0
ICPF(v) =
CPFy1
(t, v)
dt
= arg max
v
ˆbk
/2
ICPF(v)
Hence, the chirp rate ˆbk for y1(t) can be estimated as follows
Then, dechirp the signal y(t) by multiplying it with exp −j ˆbkt2
obtain
Hence, we can estimate the time centre tk from z1(t) by computing
the WVD of it, just as follows
= arg max
t
tk
WVD(t, f )
(38)
After the procedure above, the chirp rate βk for the first cubic
Chirplet component can be estimated as follows
= ˆbk
+ 3gktk
bk
(39)
Then, the other parameters can be estimated by the Fourier transform
and 1D maximisations, and the whole procedure for the cubic
Chirplet decomposition algorithm based on GCPF can be
summarised as follows:
Step 1: Initialise k = 0 in (12), and estimate the curvature γk for the
first component.
Step 2: Dechirp the cubic Chirplet atom to the form of (25), and
estimate the chirp rate ˆbk for y1(t) based on (34).
Step 3: Dechirp the signal y(t) to the form of (35), and estimate the
time centre tk by (38).
Step 4: Estimate the chirp rate βk for the first cubic Chirplet
component by (39).
Step 5: The frequency centre ωk for
the first cubic Chirplet
component can be estimated by dechirping s(t) with the reference
signal
sref (t) = exp −jbk(t − tk)2 − jgk(t − tk)3
(33)
we obtain
vk
+1
−1 s(t)sref (t) exp (−jvt)dt
= arg max
v
(40)
(41)
(42)
(43)
where
z(t) = y(t) exp (−j ˆbkt2) = z1(t) + z2(t)
−0.25
exp − (t − tk)2
z1(t) = Dk ps2
× exp jF3
× exp jF2
z2(t) = y2(t) exp −j ˆbkt2
2s2
k
k
signal
z1(t), whereas
We can see from (36) and (37) that, y1(t) has been dechirped to a
still has the form of
sinusoidal
multi-component cubic Chirplet atom. Then, we should separate
z1(t) from z(t) to continue the parameters estimation procedure.
This can be implemented by a filtering in the frequency domain,
just as follows:
z2(t)
(1) Compute the Fourier transform of z(t), and the result consists of a
narrow band spectrum and a spread spectrum. The narrow band
the Fourier transform of the sinusoidal signal
spectrum is just
z1(t), and the spread spectrum is the Fourier
transform of
multi-component cubic Chirplet z2(t).
(2) Filter out the narrow band spectrum by a band-pass filter with the
width determined by the narrow band spectrum.
(3) Compute the inverse Fourier transform for the filtered narrow
band spectrum, and the sinusoidal signal z1(t) can be separated
from z(t).
IET Signal Process., 2015, Vol. 9, Iss. 5, pp. 419–429
& The Institution of Engineering and Technology 2015
(34)
, we
(35)
(36)
(37)
Step 6: The variance σk for the first cubic Chirplet component can be
estimated by 1D maximisations as follows
+1
−1
sk
= arg max
sk
∗
s(t)h
k (t)dt
Step 7: The weighted coefficient Dk for the first cubic Chirplet
component can be estimated as follows
Dk
2= arg max
hk
ks(t), hk(t)l
Step 8: Eliminated the estimated cubic Chirplet component from the
original signal based on CLEAN technique [44]. Set k = k + 1, and
repeat the aforementioned steps until the residual signal energy is
less than a pre-determined threshold.
Remark 2: For the cubic Chirplet atom with length N, the directly
computation of (17) requires about O(N2) operations. By using the
subband decomposition technique [33], the maximisations of the
GCPF algorithm can be
reduced to O(NlogN) operations.
Analogous as GCPF algorithm for the curvature estimation, the
implementation of CPF algorithm for the chirp rate estimation also
requires O(NlogN) operations. Whereas the polynomial Chirplet
the iteration procedure and the
transform in [39]
maximum-likelihood
Chirplet
cubic
decomposition in [40] requires O(N3logN) operations.
algorithm for
requires
the
The cubic Chirplet decomposition can be implemented by the
above procedure, and the corresponding decomposition result for
the signal in Table 1 is shown in Fig. 2c. Here, we compute the
423
�
Fig. 3 Time–frequency representations for the simulated signals
a WVD for two Chirplet atoms
b WVD for two Chirplet atoms after cubic Chirplet decomposition
c WVD for a fourth-order Chirplet atom
d WVD for a fourth-order Chirplet atom after cubic Chirplet decomposition
reassigned smoothed pseudo WVD (RSPWVD) of the estimated
cubic Chirplets for their non-linearity. Compared with Figs. 2a
and b, we can see that the cubic Chirplet decomposition is more
accurate than the conventional Chirplet decomposition.
Then,
two special cases are given below to demonstrate the
effectiveness of the cubic Chirplet decomposition algorithm. One
is the cubic Chirplet decomposition results for a signal consists of
two components traditional Chirplet atom, and the corresponding
results are shown in Figs. 3a and b, respectively; the other is the
cubic Chirplet decomposition results for a signal with the form of
fourth-order phase, and the corresponding results are shown in
Figs. 3c and d, respectively.
We can see from Fig. 3 that, the cubic Chirplet decomposition
algorithm proposed in this paper is valid for the two special cases.
In Figs. 3a and b, the estimated curvature parameter is equal to
zero, and the cubic Chirplet decomposition algorithm is suitable
for the representations of traditional Chirplet atoms; in Figs. 3c
and d,
the cubic Chirplet decomposition algorithm is used to
represent a fourth-order Chirlet atom, and the corresponding
results demonstrates the effectiveness of it.
ISAR imaging algorithm based on cubic Chirplet
3.3
decomposition
In Section 2, we have concluded that the received signal in a range
bin can be characterised as multi-component AM–FM signal for
the targets with complex motion. In Sections 3.1 and 3.2, an
efficient way to analyse the multi-component AM–FM signal
based on cubic Chirplet decomposition is proposed. Based on the
424
above fact,
illustrated as follows:
the corresponding ISAR imaging algorithm can be
Implement
Step 1: Motion compensation for the received signal.
Step 2: Characterise the received signal in a certain range bin as
multi-component AM–FM signals, as shown in (7).
Step 3:
the
multi-component AM–FM signals, and the corresponding cubic
Chirplet atoms parameters can be obtained.
Step 4: From the instantaneous ISAR images based on the cubic
Chirplet atoms parameters for all range bins associated with the
RID algorithm.
the cubic Chirplet decomposition for
Remark 3: For the complex motion of a target, the scatterers in a
range bin can migrate, and this can be solved by the keystone
transform in [45] before ISAR imaging.
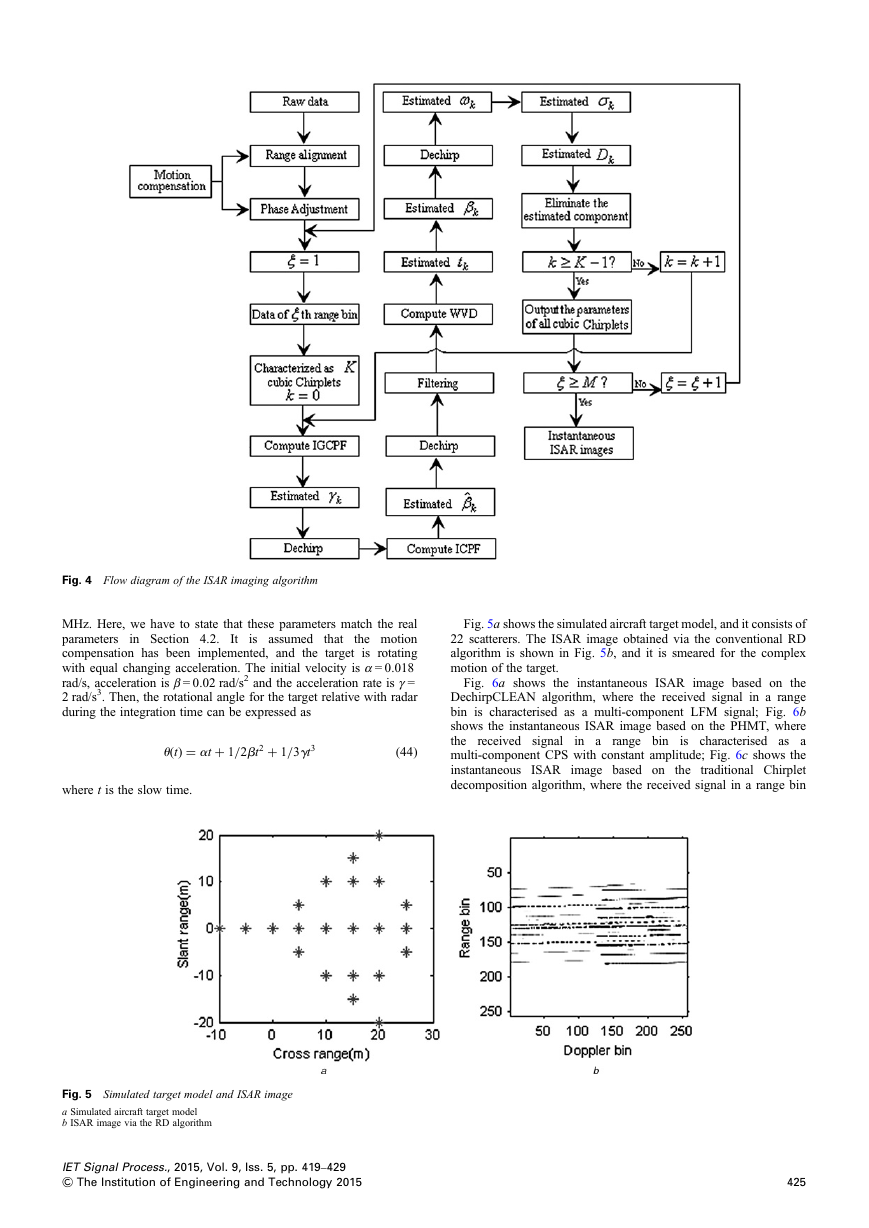
The flow diagram of the novel ISAR imaging algorithm is shown
in Fig. 4, where M is the number of range bins.
4
ISAR imaging results
4.1 Simulated data
The radar parameters for the simulated data are as follows: the carrier
frequency for the transmitted signal is 5.52 GHz, the bandwidth is
400 MHz, the pulse width is 25.6 μs and the sampling rate is 10
IET Signal Process., 2015, Vol. 9, Iss. 5, pp. 419–429
& The Institution of Engineering and Technology 2015
�
Fig. 4 Flow diagram of the ISAR imaging algorithm
in Section 4.2.
It
MHz. Here, we have to state that these parameters match the real
the motion
parameters
compensation has been implemented, and the target
is rotating
with equal changing acceleration. The initial velocity is α = 0.018
rad/s, acceleration is β = 0.02 rad/s2 and the acceleration rate is γ =
2 rad/s3. Then, the rotational angle for the target relative with radar
during the integration time can be expressed as
is assumed that
u(t) = at + 1/2bt2 + 1/3gt3
(44)
where t is the slow time.
Fig. 5a shows the simulated aircraft target model, and it consists of
22 scatterers. The ISAR image obtained via the conventional RD
algorithm is shown in Fig. 5b, and it is smeared for the complex
motion of the target.
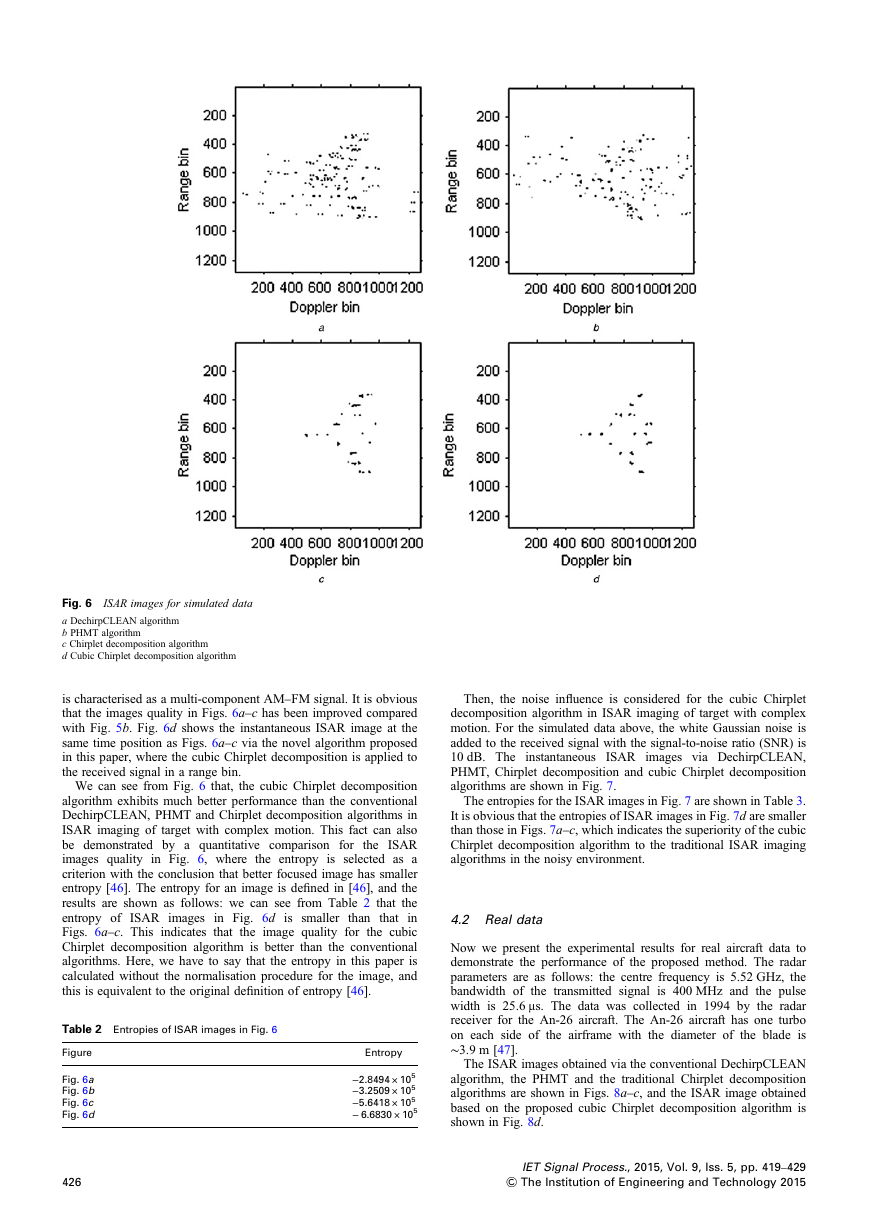
Fig. 6a shows the instantaneous ISAR image based on the
DechirpCLEAN algorithm, where the received signal in a range
bin is characterised as a multi-component LFM signal; Fig. 6b
shows the instantaneous ISAR image based on the PHMT, where
the received signal
in a range bin is characterised as a
multi-component CPS with constant amplitude; Fig. 6c shows the
instantaneous ISAR image based on the traditional Chirplet
decomposition algorithm, where the received signal in a range bin
Fig. 5 Simulated target model and ISAR image
a Simulated aircraft target model
b ISAR image via the RD algorithm
IET Signal Process., 2015, Vol. 9, Iss. 5, pp. 419–429
& The Institution of Engineering and Technology 2015
425
�
Fig. 6 ISAR images for simulated data
a DechirpCLEAN algorithm
b PHMT algorithm
c Chirplet decomposition algorithm
d Cubic Chirplet decomposition algorithm
is characterised as a multi-component AM–FM signal. It is obvious
that the images quality in Figs. 6a–c has been improved compared
with Fig. 5b. Fig. 6d shows the instantaneous ISAR image at the
same time position as Figs. 6a–c via the novel algorithm proposed
in this paper, where the cubic Chirplet decomposition is applied to
the received signal in a range bin.
We can see from Fig. 6 that, the cubic Chirplet decomposition
algorithm exhibits much better performance than the conventional
DechirpCLEAN, PHMT and Chirplet decomposition algorithms in
ISAR imaging of target with complex motion. This fact can also
be demonstrated by a quantitative comparison for
the ISAR
images quality in Fig. 6, where the entropy is selected as a
criterion with the conclusion that better focused image has smaller
entropy [46]. The entropy for an image is defined in [46], and the
results are shown as follows: we can see from Table 2 that the
entropy of
in
Figs. 6a–c. This indicates that the image quality for the cubic
Chirplet decomposition algorithm is better than the conventional
algorithms. Here, we have to say that the entropy in this paper is
calculated without the normalisation procedure for the image, and
this is equivalent to the original definition of entropy [46].
ISAR images in Fig. 6d is smaller
than that
Table 2 Entropies of ISAR images in Fig. 6
Figure
Fig. 6a
Fig. 6b
Fig. 6c
Fig. 6d
426
Entropy
−2.8494 × 10⁵
−3.2509 × 10⁵
−5.6418 × 10⁵
− 6.6830 × 10⁵
Then, the noise influence is considered for the cubic Chirplet
decomposition algorithm in ISAR imaging of target with complex
motion. For the simulated data above, the white Gaussian noise is
added to the received signal with the signal-to-noise ratio (SNR) is
10 dB. The instantaneous ISAR images via DechirpCLEAN,
PHMT, Chirplet decomposition and cubic Chirplet decomposition
algorithms are shown in Fig. 7.
The entropies for the ISAR images in Fig. 7 are shown in Table 3.
It is obvious that the entropies of ISAR images in Fig. 7d are smaller
than those in Figs. 7a–c, which indicates the superiority of the cubic
Chirplet decomposition algorithm to the traditional ISAR imaging
algorithms in the noisy environment.
4.2 Real data
Now we present the experimental results for real aircraft data to
demonstrate the performance of the proposed method. The radar
parameters are as follows: the centre frequency is 5.52 GHz, the
bandwidth of the transmitted signal
is 400 MHz and the pulse
width is 25.6 μs. The data was collected in 1994 by the radar
receiver for the An-26 aircraft. The An-26 aircraft has one turbo
on each side of the airframe with the diameter of the blade is
∼3.9 m [47].
The ISAR images obtained via the conventional DechirpCLEAN
algorithm, the PHMT and the traditional Chirplet decomposition
algorithms are shown in Figs. 8a–c, and the ISAR image obtained
based on the proposed cubic Chirplet decomposition algorithm is
shown in Fig. 8d.
IET Signal Process., 2015, Vol. 9, Iss. 5, pp. 419–429
& The Institution of Engineering and Technology 2015
�




 2023年江西萍乡中考道德与法治真题及答案.doc
 2012年重庆南川中考生物真题及答案.doc
 2013年江西师范大学地理学综合及文艺理论基础考研真题.doc
 2020年四川甘孜小升初语文真题及答案I卷.doc
 2020年注册岩土工程师专业基础考试真题及答案.doc
 2023-2024学年福建省厦门市九年级上学期数学月考试题及答案.doc
 2021-2022学年辽宁省沈阳市大东区九年级上学期语文期末试题及答案.doc
 2022-2023学年北京东城区初三第一学期物理期末试卷及答案.doc
 2018上半年江西教师资格初中地理学科知识与教学能力真题及答案.doc
 2012年河北国家公务员申论考试真题及答案-省级.doc
 2020-2021学年江苏省扬州市江都区邵樊片九年级上学期数学第一次质量检测试题及答案.doc
 2022下半年黑龙江教师资格证中学综合素质真题及答案.doc