i
R
e
m
o
t
e
S
e
n
s
n
g
o
f
t
h
e
E
n
v
i
r
o
n
m
e
n
t
J
e
n
s
e
n
S
e
c
o
n
d
E
d
i
t
i
o
n
Remote Sensing of the Environment
An Earth Resource Perspective
John R. Jensen
Second Edition
9781292021706ISBN 978-1-29202-170-6�
Remote Sensing of the EnvironmentAn Earth Resource PerspectiveJohn R. JensenSecond Edition�
Pearson Education LimitedEdinburgh GateHarlowEssex CM20 2JEEngland and Associated Companies throughout the worldVisit us on the World Wide Web at: www.pearsoned.co.uk© Pearson Education Limited 2014 All rights reserved. No part of this publication may be reproduced, stored in a retrieval system, or transmitted in any form or by any means, electronic, mechanical, photocopying, recording or otherwise, without either the prior written permission of the publisher or a licence permitting restricted copying in the United Kingdom issued by the Copyright Licensing Agency Ltd, Saffron House, 6–10 Kirby Street, London EC1N 8TS.All trademarks used herein are the property of their respective owners. The use of any trademark in this text does not vest in the author or publisher any trademark ownership rights in such trademarks, nor does the use of such trademarks imply any affi liation with or endorsement of this book by such owners. British Library Cataloguing-in-Publication DataA catalogue record for this book is available from the British Library Printed in the United States of AmericaISBN 10: 1-292-02170-5ISBN 13: 978-1-292-02170-6ISBN 10: 1-292-02170-5ISBN 13: 978-1-292-02170-6�
Table of ContentsPEARSON CUSTOM LIBRARY I1. Remote Sensing of the Environment11John R. Jensen2. Electromagnetic Radiation Principles3939John R. Jensen3. Aerial Photography – Vantage Point, Cameras, Filters, and Film6565John R. Jensen4. Elements of Visual Image Interpretation105105John R. Jensen5. Photogrammetry129129John R. Jensen6. Multispectral Remote Sensing Systems177177John R. Jensen7. Thermal Infrared Remote Sensing243243John R. Jensen8. Active and Passive Microwave Remote Sensing287287John R. Jensen9. LIDAR Remote Sensing337337John R. Jensen10. Remote Sensing of Vegetation357357John R. Jensen11. Remote Sensing of Water417417John R. Jensen12. Remote Sensing of Soils, Minerals, and Geomorphology457457John R. Jensen13. Remote Sensing the Urban Landscape525525John R. Jensen�
II14. In Situ Spectral Reflectance Measurement591591John R. JensenAppendix—Sources of Remote Sensing Information601601John R. Jensen605605Index�
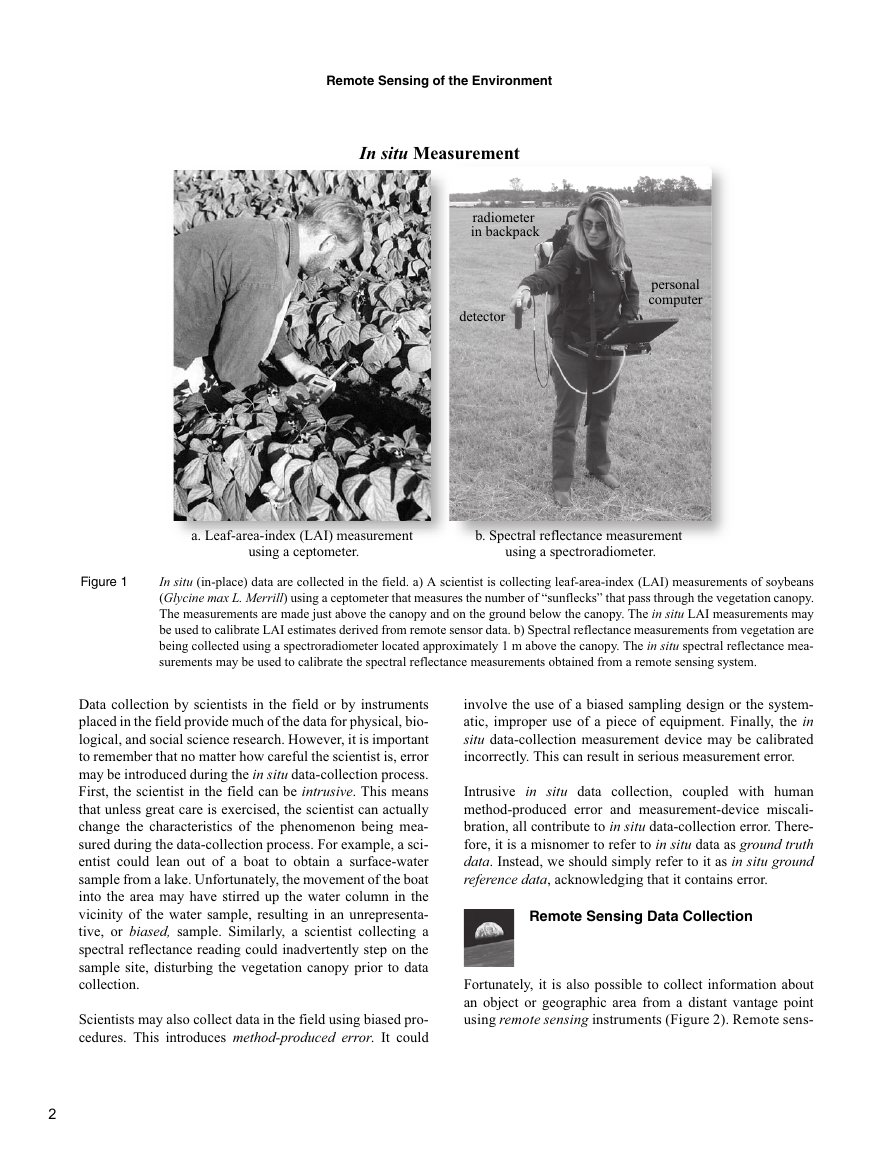
Remote Sensing of the EnvironmentScientists observe nature, make measurements, and then attempt to accept orreject hypotheses concerning these phenomena. The data collection may takeplace directly in the field (referred to as in situ or in-place data collection), orat some remote distance from the subject matter (referred to as remote sens-ing of the environment).In situ Data CollectionOne form of in situ data collection involves the scientist going out in the field and questioning the phenomena of interest. For example, a census enumera-tor may go door to door, asking people questions about their age, sex, educa-tion, income, etc. These data are recorded and used to document the demographic characteristics of the population. Conversely, a scientist may use a transducer or other in situ measurement device at the study site to make measurements. Transducers are usually placed in direct physical contact with the object of interest. Many different types of transducers are available. For example, a scientist could use a ther-mometer to measure the temperature of the air, soil, or water; an anemometer to measure wind speed; or a psychrometer to measure air humidity. The data recorded by the transducers may be an analog electrical signal with voltage variations related to the intensity of the property being measured. Often these analog signals are transformed into digital values using analog-to-digital (A-to-D) conversion procedures. In situ data collection using transducers relieves the scientist of monotonous data collection often in inclement weather. Also, the scientist can distribute the transducers at important geo-graphic locations throughout the study area, allowing the same type of mea-surement to be obtained at many locations at the same time. Sometimes data from the transducers are telemetered electronically to a central collection point for rapid evaluation and archiving (e.g., Teillet et al., 2002). Two examples of in situ data collection are demonstrated in Figure 1. Lea-farea-index (LAI) measurements are being collected by a scientist at a study site using a handheld ceptometer in Figure 1a. Spectral reflectance measur-ements of vegetation are being obtained at a study site using a handheld spectroradiometer in Figure 1b. LAI and spectral reflectance measurements obtained in the field may be used to calibrate LAI and spectral reflectance mea-surements collected by a remote sensing system located on an aircraft or satel-lite (Jensen et al., 2005). From Chapter 1 of Remote Sensing of the Environment: An Earth Resource Perspective, Second Edition. John R. Jensen. Copyright © 2007 by Pearson Education, Inc. Published by Pearson Prentice Hall. All rights reserved. 1�
Data collection by scientists in the field or by instrumentsplaced in the field provide much of the data for physical, bio-logical, and social science research. However, it is importantto remember that no matter how careful the scientist is, errormay be introduced during the in situ data-collection process.First, the scientist in the field can be intrusive. This meansthat unless great care is exercised, the scientist can actuallychange the characteristics of the phenomenon being mea-sured during the data-collection process. For example, a sci-entist could lean out of a boat to obtain a surface-watersample from a lake. Unfortunately, the movement of the boatinto the area may have stirred up the water column in thevicinity of the water sample, resulting in an unrepresenta-tive, or biased, sample. Similarly, a scientist collecting aspectral reflectance reading could inadvertently step on thesample site, disturbing the vegetation canopy prior to datacollection. Scientists may also collect data in the field using biased pro-cedures. This introduces method-produced error. It couldinvolve the use of a biased sampling design or the system-atic, improper use of a piece of equipment. Finally, the insitu data-collection measurement device may be calibratedincorrectly. This can result in serious measurement error. Intrusive in situ data collection, coupled with humanmethod-produced error and measurement-device miscali-bration, all contribute to in situ data-collection error. There-fore, it is a misnomer to refer to in situ data as ground truthdata. Instead, we should simply refer to it as in situ groundreference data, acknowledging that it contains error.Remote Sensing Data CollectionFortunately, it is also possible to collect information aboutan object or geographic area from a distant vantage pointusing remote sensing instruments (Figure 2). Remote sens-a. Leaf-area-index (LAI) measurement using a ceptometer.b. Spectral reflectance measurement using a spectroradiometer.radiometer in backpackdetectorpersonalcomputerIn situ MeasurementFigure 1In situ (in-place) data are collected in the field. a) A scientist is collecting leaf-area-index (LAI) measurements of soybeans(Glycine max L. Merrill) using a ceptometer that measures the number of “sunflecks” that pass through the vegetation canopy.The measurements are made just above the canopy and on the ground below the canopy. The in situ LAI measurements maybe used to calibrate LAI estimates derived from remote sensor data. b) Spectral reflectance measurements from vegetation arebeing collected using a spectroradiometer located approximately 1 m above the canopy. The in situ spectral reflectance mea-surements may be used to calibrate the spectral reflectance measurements obtained from a remote sensing system. Remote Sensing of the Environment2�
ing data collection was originally performed using camerasmounted in suborbital aircraft. Photogrammetry was definedin the early editions of the Manual of Photogrammetry as:the art or science of obtaining reliable measurementby means of photography (American Society ofPhotogrammetry, 1952; 1966).Photographic interpretation is defined as: the act of examining photographic images for thepurpose of identifying objects and judging their sig-nificance (Colwell, 1960).Remote sensing was formally defined by the American Soci-ety for Photogrammetry and Remote Sensing (ASPRS) as: the measurement or acquisition of information ofsome property of an object or phenomenon, by arecording device that is not in physical or intimatecontact with the object or phenomenon under study(Colwell, 1983).In 1988, ASPRS adopted a combined definition of photo-grammetry and remote sensing:Photogrammetry and remote sensing are the art, sci-ence, and technology of obtaining reliable informa-tion about physical objects and the environment,through the process of recording, measuring andinterpreting imagery and digital representations ofenergy patterns derived from non-contact sensorsystems (Colwell, 1997).But where did the term remote sensing come from? Theactual coining of the term goes back to an unpublished paperin the early 1960s by the staff of the Office of NavalResearch Geography Branch (Pruitt, 1979; Fussell et al.,1986). Evelyn L. Pruitt was the author of the paper. She wasassisted by staff member Walter H. Bailey. Aerial photointerpretation had become very important in World War II.The space age was just getting under way with the 1957launch of Sputnik (U.S.S.R.), the 1958 launch of Explorer 1(U.S.), and the collection of photography from the thensecret CORONA program initiated in 1960 (Table 1). Inaddition, the Geography Branch of ONR was expanding itsresearch using instruments other than cameras (e.g., scan-ners, radiometers) and into regions of the electromagneticspectrum beyond the visible and near-infrared regions (e.g.,thermal infrared, microwave). Thus, in the late 1950s it hadbecome apparent that the prefix “photo” was being stretchedtoo far in view of the fact that the root word, photography,Suborbital platform Object, area, or materials within the ground-projected IFOV Remote sensing instrumentOrbital platform Haltitude above ground level (AGL)β instantaneous-field-of-view (IFOV) of the sensor systemβdiameter of the ground-projected IFOVDSuborbital platform Remote Sensing MeasurementFigure 2A remote sensing instrument collects informationabout an object or phenomenon within the instanta-neous-field-of-view (IFOV) of the sensor systemwithout being in direct physical contact with it. The remote sensing instrument may be located just a few meters above the ground and/or onboard an air-craft or satellite platform. Remote Sensing of the Environment3�


 2023年江西萍乡中考道德与法治真题及答案.doc
 2012年重庆南川中考生物真题及答案.doc
 2013年江西师范大学地理学综合及文艺理论基础考研真题.doc
 2020年四川甘孜小升初语文真题及答案I卷.doc
 2020年注册岩土工程师专业基础考试真题及答案.doc
 2023-2024学年福建省厦门市九年级上学期数学月考试题及答案.doc
 2021-2022学年辽宁省沈阳市大东区九年级上学期语文期末试题及答案.doc
 2022-2023学年北京东城区初三第一学期物理期末试卷及答案.doc
 2018上半年江西教师资格初中地理学科知识与教学能力真题及答案.doc
 2012年河北国家公务员申论考试真题及答案-省级.doc
 2020-2021学年江苏省扬州市江都区邵樊片九年级上学期数学第一次质量检测试题及答案.doc
 2022下半年黑龙江教师资格证中学综合素质真题及答案.doc