Theoretical Economics Letters, 2018, 8, 1905-1934
http://www.scirp.org/journal/tel
ISSN Online: 2162-2086
ISSN Print: 2162-2078
An Empirical Analysis of Substitution and
Complementarity of Gender Labor Demand of
Enterprises in Japan, Korea, and China: With a
Factor Decomposition of Gender Wage
Differentials
Hiromi Ishizuka
Sanno University, Kanagawa, Japan
How to cite this paper: Ishizuka, H. (2018)
An Empirical Analysis of Substitution and
Complementarity of Gender Labor Demand
of Enterprises in Japan, Korea, and China:
With a Factor Decomposition of Gender
Wage Differentials. Theoretical Economics
Letters, 8, 1905-1934.
https://doi.org/10.4236/tel.2018.810125
Received: May 7, 2018
Accepted: June 23, 2018
Published: June 26, 2018
Copyright © 2018 by author and
Scientific Research Publishing Inc.
This work is licensed under the Creative
Commons Attribution International
License (CC BY 4.0).
http://creativecommons.org/licenses/by/4.0/
Open Access
Abstract
The purpose of this study is the effect of expansion of female labor demand on
male labor demand for labor market reform to facilitate Japanese economic
development. Firstly, the estimates using Hicks’ (1970) partial elasticity of
complementarity and Allen’s (1938) partial elasticity of substitution revealed
an increase in male labor demand when female labor demand increased in all
three countries. The results were a relationship of complementarity in labor
demand between male and female regular employees in the order of China,
South Korea, Japan. However, a push factor or a pull factor is assumed to
make up a complementarity relationship. Therefore secondly, the factor de-
composition analysis of wage gap is used to investigate which factors are ap-
plicable. The gender wage gap consists of economic rationality and economic
irrational discriminatory [Neumark (1988); Oaxaca and Ransom (1994)]. The
gap was confirmed in all three countries. Although the actual gender average
wage difference was small in China, “discriminatory preference theory” was
suggested that there is underpayment of women in Japan and Korea. In Japan,
as women have a high potential labor force participation rate, expansion of
female labor demand seems promising as an economic policy, not least be-
cause of the declining population. Labor-related economic policies are
needed, such as the creation of a fluid labor market in China, or the imple-
mentation of effective policies in Korea.
Keywords
Labor Demand, Complementarity, Substitution, Women, Men, Gender Wage
Differentials, Japan, South Korea, China
DOI: 10.4236/tel.2018.810125 Jun. 26, 2018
1905
Theoretical Economics Letters
�
H. Ishizuka
DOI: 10.4236/tel.2018.810125
1. Introduction: Expansion of Female Labor Demand as an
Economic Issue
The purpose of this study is to make policy recommendations for labor market
reform to facilitate economic development in Japan. Japanese enterprises were
obliged since 2015 to implement initiatives to promote expansion of female la-
bor demand.
We perform an empirical analysis of the impact on male labor demand of the
expansion of female labor demand. An analysis of the factors involved in such an
expansion at Japanese enterprises is also carried out in comparison to Korean
and Chinese enterprises.
According to World Economic Forum [1], the Global Gender Gap Index
(GGGI), the economic gender gap is particularly big in Japan, Korea, and China,
which all rank around 100th among 144 countries (regions). The data show a
gender gap in terms of labor demand “quantity” (the female ratio of workers),
“quality” (the female ratio of managerial positions), and earnings. Ishizuka [2]
has already investigated “quality” by promotions to managerial positions. This
study estimates the expansion of female labor demand and a factor decomposi-
tion of the gender wage gap.
Part of the significance of this study lies in the fact that Japan, Korea, and
China are all located in northeast Asia and have some commonalities, allowing
them to learn from each other’s experiences; in addition, there is hardly any
comparative research, making this study somewhat pioneering. The Asian
economy is active, and the role played within it, and within the global economy,
by Japan, Korea, and China seems set to grow. Declining and aging in popula-
tion are issues common to all three countries.
For many years, Japan, as the only developed major country in Asia, has been
a leader in the global economy. However, it has a substantial gender gap, and is
reforming working way [3] [4]. Although Korea has a bigger gender gap than
Japan, it adopted an “effective quota system” which obliged businesses to have
numerical targets for female employment and managerial positions in 2006. This
policy has been shown to have an impact [5]. As a result of the introduction of
an “effective quota system” in China in 1949 aimed at equality of employment
between men and women as the planned economy, China is seen as a model of
deep-rooted normalization of female employment and as an exemplar of a fluid
labor market [6].
The first method of empirical analysis estimates Hicks’ [7] partial elasticity of
complementarity and Allen’s [8] partial elasticity of substitution with regard to
three factors of production, a male regular employee, a female regular employee,
and capital1. The definition of a regular employee is a full-time permanent em-
1Substitution and complementarity analysis of regular and non-regular employees was carried out
for Japan only. In Japan and Korea, the disparity between the contractual treatment of the two
groups of workers is significant, and is itself an issue for discussion. However, in this study, the focus
is mainly on regular employees, because this is the group that is subject to promotion and for
whomcontractual treatment of men and women is uniform, making comparison possible.
1906
Theoretical Economics Letters
�
H. Ishizuka
ployee. In Japan and Korea, they are under the work system peculiar to Japan.
The second method decomposes the gender wage gap into factors consistent
with economic rationality and economic irrational discriminatory. The factor of
discriminatory consists of an underpayment of women and an overpayment of
men [9] [10]. That is, the origins of the relationships obtained from the first
method are examined.
This study uses Chinese and Korean corporate data from a survey carried out
in 2013, lent by RIETI, and Japanese corporate data obtained in 2015 using the
same questionnaire.
This paper is constituted as follows. Section 2 analyzes the current situation,
Section 3 explains the data, section4 analyzes the econometric substitution and
complementarity of the gender labor demand, and section 5 analyzes the eco-
nometric factor decomposition of the gender wage gap, in Japan, South Korea,
and China.
2. The Current Situation: GGGI and the Gender Labor
Demand Gap in Japan, Korea, and China
2.1. GGGI in Japan, Korea and China
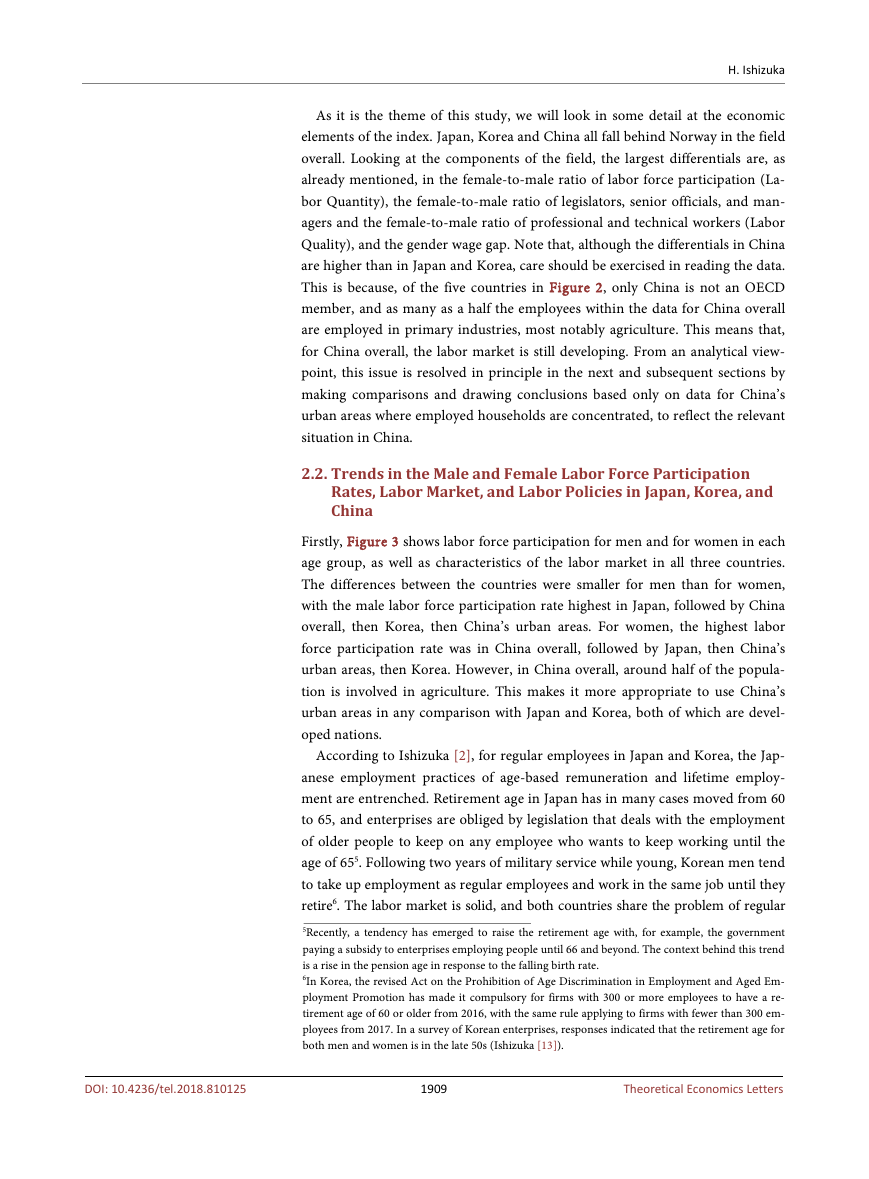
How do the gender gaps in Japan, Korea, and China rank globally? Figure 1
shows overall ranking using the Global Gender Gap Index (GGGI). It shows
that, in 2017, among the 144 countries (regions) covered, Japan ranked 114th,
Korea 118th and China 100th. This means that for all three countries the gender
gap remains significant [1].
Looking at trends in the overall GGGI ranking, the number of countries (re-
gions) covered is increasing, but the order in which the three countries rank is
unchanged. That said, in the four years since 2013, Japan has dropped nine posi-
tions in ranking, Korea seven and China thirty-one. While it is true that em-
ployment of women is embedded within Chinese business culture, there does
seem to have been an impact due to progress made in the marketization of labor
accompanying the creation of a market-orientated economy [11]. In addition,
Ishizuka [12] noted, particularly in cities in central China, a slight increase in
unemployed women who fulfill the role of “housewives” typical of developed
countries.
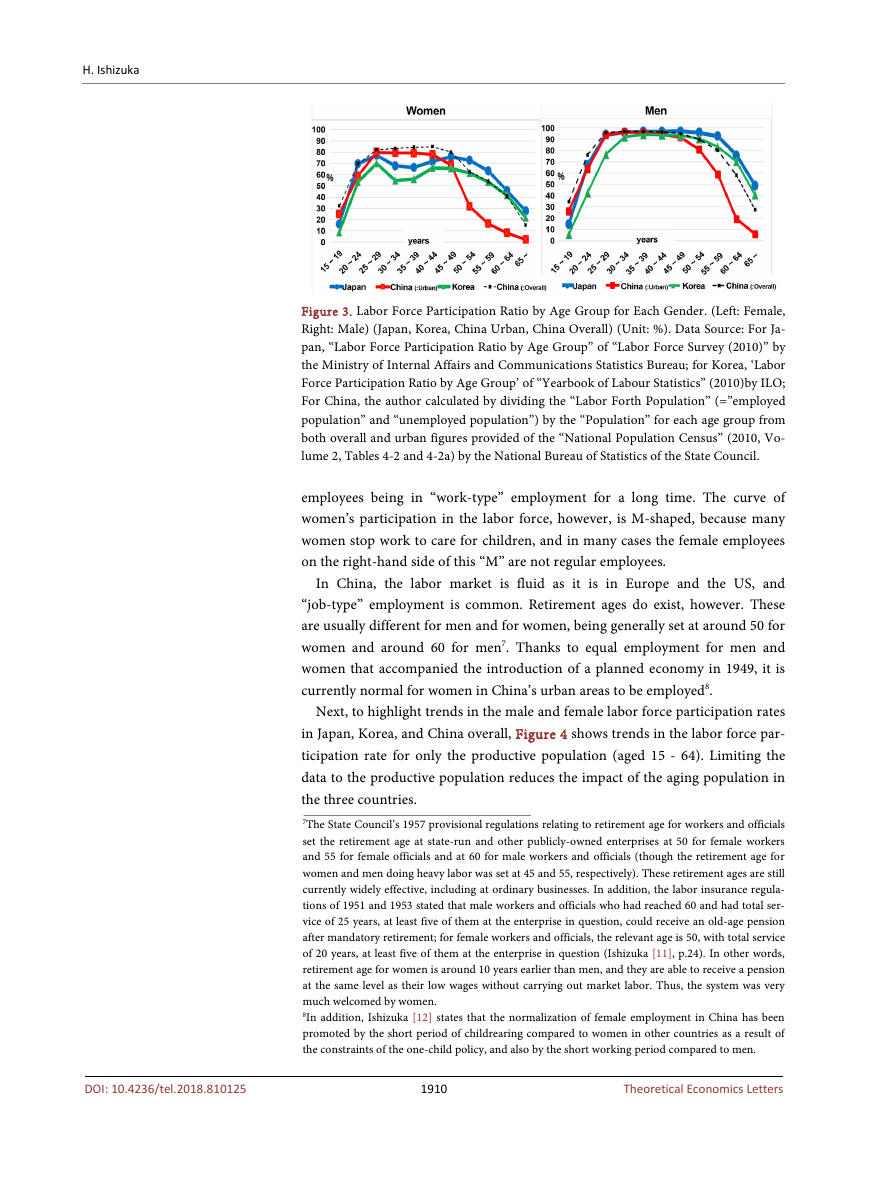
Figure 2 shows the GGGI in 2017 in Japan, Korea, and China in more detail.
The GGGI is divided into four fields of 1) economy, 2) education, 3) health, and
4) politics. As a reference, the scores of second-ranked Norway, 49th-ranked US,
and tenth-ranked Philippines in Asia are also shown on the line graph. As a re-
sult of gender diversity management policies, the proportion of women on cor-
porate boards in Norway has risen to about 40%2, and it is exemplary in terms of
actively adopting strategies that promote a work-life balance, whereby both work
and the home/children are supported. Also, while it would be incorrect to say
that either factor results from any active strategy on the part of its government,
2Norway did not adopt a quota system, considering the introduction of such a policy to be an in-
fringement of corporate autonomy.
1907
Theoretical Economics Letters
DOI: 10.4236/tel.2018.810125
�
H. Ishizuka
Figure 1. GGGI (Global Gender Gap Index): Trend in Overall Ranking. (Japan, South
Korea, China). Data Source: World Economic Forum [1].
1.1
1.0
0.9
0.8
0.7
0.6
0.5
0.4
0.3
0.2
0.1
0.0
Japan (114th)
Norway (2nd)
China (100th)
US (49th)
Korea (118th)
Philippines (49th)
Figure 2. Details of GGGI (2017) (Japan, Korea, China, Norway, US, Philippines). Date
Source: World Economic Forum [1].
the US has maintained a fertility rate of around 2.0, the level at which the popu-
lation is sustained, and women themselves are choosing to work; in addition, the
US ranks at the global top in terms of GDP.
The scores in Japan, Korea, and China for 2) education and 3) health are not
problematic when compared to the scores of European countries and the US,
with one exception3. The fields in which Japan’s GGGI ranking has fallen signif-
icantly are 1) economics and 4) politics. These are both fields that impact the
actual workings of society, and there is indeed substantial gender disparity in all
three countries4.
3In 2) education, the only low score is “Enrollment in Higher Education.” The Japanese gender gap
in tertiary education can be quantified at 0.93, with 61% of women receiving a higher education and
66% of men. In Korea, the same figures are 0.77, 80% and 105%, while in the whole China, at the
level of secondary education (junior high/high school), the figures are 0.95, 47% and 53%. Treating
the whole China as irrelevant, we can say that there is a gender gap in terms of the rate of higher
education in Japan and Korea.
4In 4: Political Sector, Japan, Korea, and China all fall behind to Norway. The inferiority of the situa-
tion in Japan is particularly striking. China, not least because of the impact of socialism, has pro-
duced a certain level of female participation in the field of politics. Korea resembles Japan in that it
falls behind Norway, but in recent years it has made significant progress: it has introduced a quota
for female National Assembly members and for female elected local government representatives and
also produced a female president. However, in this study, no deeper investigation will be made in
this field.
DOI: 10.4236/tel.2018.810125
1908
Theoretical Economics Letters
�
H. Ishizuka
As it is the theme of this study, we will look in some detail at the economic
elements of the index. Japan, Korea and China all fall behind Norway in the field
overall. Looking at the components of the field, the largest differentials are, as
already mentioned, in the female-to-male ratio of labor force participation (La-
bor Quantity), the female-to-male ratio of legislators, senior officials, and man-
agers and the female-to-male ratio of professional and technical workers (Labor
Quality), and the gender wage gap. Note that, although the differentials in China
are higher than in Japan and Korea, care should be exercised in reading the data.
This is because, of the five countries in Figure 2, only China is not an OECD
member, and as many as a half the employees within the data for China overall
are employed in primary industries, most notably agriculture. This means that,
for China overall, the labor market is still developing. From an analytical view-
point, this issue is resolved in principle in the next and subsequent sections by
making comparisons and drawing conclusions based only on data for China’s
urban areas where employed households are concentrated, to reflect the relevant
situation in China.
2.2. Trends in the Male and Female Labor Force Participation
Rates, Labor Market, and Labor Policies in Japan, Korea, and
China
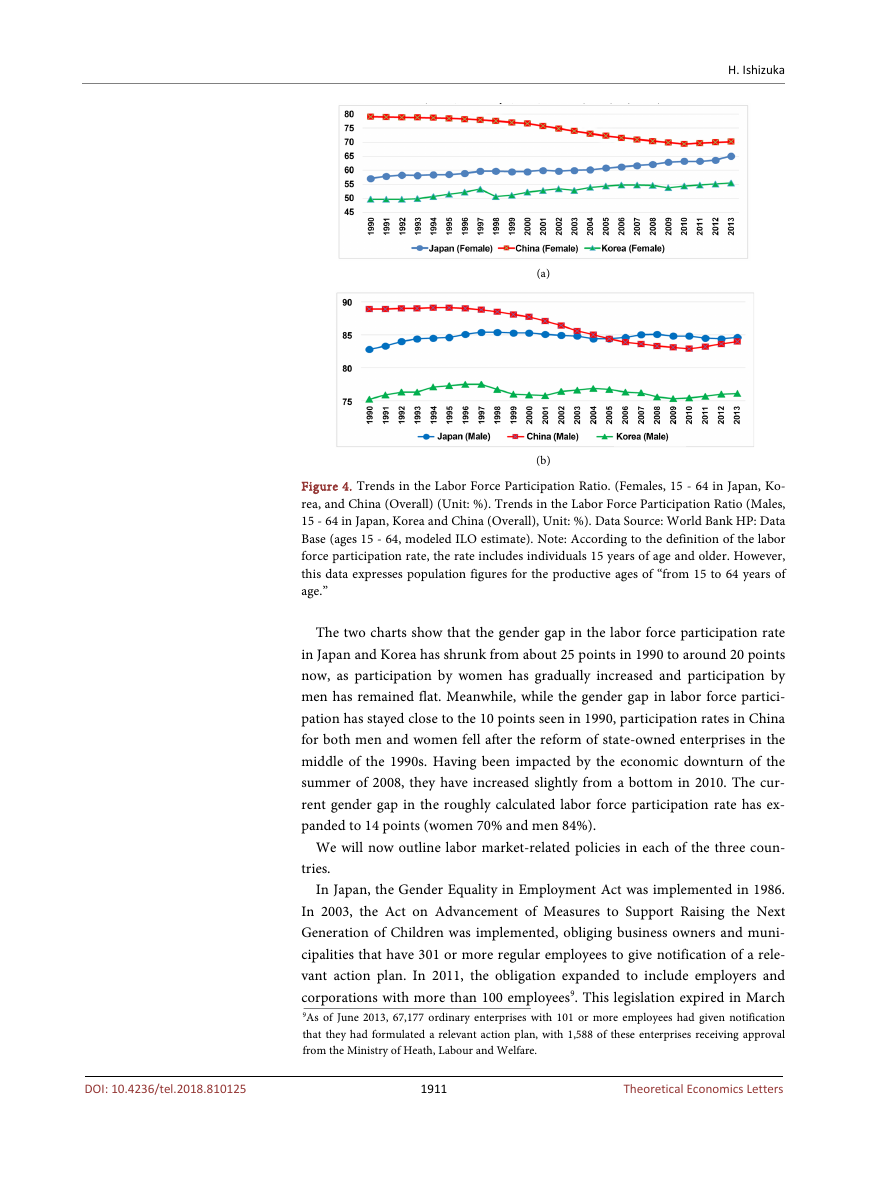
Firstly, Figure 3 shows labor force participation for men and for women in each
age group, as well as characteristics of the labor market in all three countries.
The differences between the countries were smaller for men than for women,
with the male labor force participation rate highest in Japan, followed by China
overall, then Korea, then China’s urban areas. For women, the highest labor
force participation rate was in China overall, followed by Japan, then China’s
urban areas, then Korea. However, in China overall, around half of the popula-
tion is involved in agriculture. This makes it more appropriate to use China’s
urban areas in any comparison with Japan and Korea, both of which are devel-
oped nations.
According to Ishizuka [2], for regular employees in Japan and Korea, the Jap-
anese employment practices of age-based remuneration and lifetime employ-
ment are entrenched. Retirement age in Japan has in many cases moved from 60
to 65, and enterprises are obliged by legislation that deals with the employment
of older people to keep on any employee who wants to keep working until the
age of 655. Following two years of military service while young, Korean men tend
to take up employment as regular employees and work in the same job until they
retire6. The labor market is solid, and both countries share the problem of regular
5Recently, a tendency has emerged to raise the retirement age with, for example, the government
paying a subsidy to enterprises employing people until 66 and beyond. The context behind this trend
is a rise in the pension age in response to the falling birth rate.
6In Korea, the revised Act on the Prohibition of Age Discrimination in Employment and Aged Em-
ployment Promotion has made it compulsory for firms with 300 or more employees to have a re-
tirement age of 60 or older from 2016, with the same rule applying to firms with fewer than 300 em-
ployees from 2017. In a survey of Korean enterprises, responses indicated that the retirement age for
both men and women is in the late 50s (Ishizuka [13]).
1909
Theoretical Economics Letters
DOI: 10.4236/tel.2018.810125
�
H. Ishizuka
Figure 3. Labor Force Participation Ratio by Age Group for Each Gender. (Left: Female,
Right: Male) (Japan, Korea, China Urban, China Overall) (Unit: %). Data Source: For Ja-
pan, “Labor Force Participation Ratio by Age Group” of “Labor Force Survey (2010)” by
the Ministry of Internal Affairs and Communications Statistics Bureau; for Korea, ‘Labor
Force Participation Ratio by Age Group’ of “Yearbook of Labour Statistics” (2010)by ILO;
For China, the author calculated by dividing the “Labor Forth Population” (=”employed
population” and “unemployed population”) by the “Population” for each age group from
both overall and urban figures provided of the “National Population Census” (2010, Vo-
lume 2, Tables 4-2 and 4-2a) by the National Bureau of Statistics of the State Council.
employees being in “work-type” employment for a long time. The curve of
women’s participation in the labor force, however, is M-shaped, because many
women stop work to care for children, and in many cases the female employees
on the right-hand side of this “M” are not regular employees.
In China, the labor market is fluid as it is in Europe and the US, and
“job-type” employment is common. Retirement ages do exist, however. These
are usually different for men and for women, being generally set at around 50 for
women and around 60 for men7. Thanks to equal employment for men and
women that accompanied the introduction of a planned economy in 1949, it is
currently normal for women in China’s urban areas to be employed8.
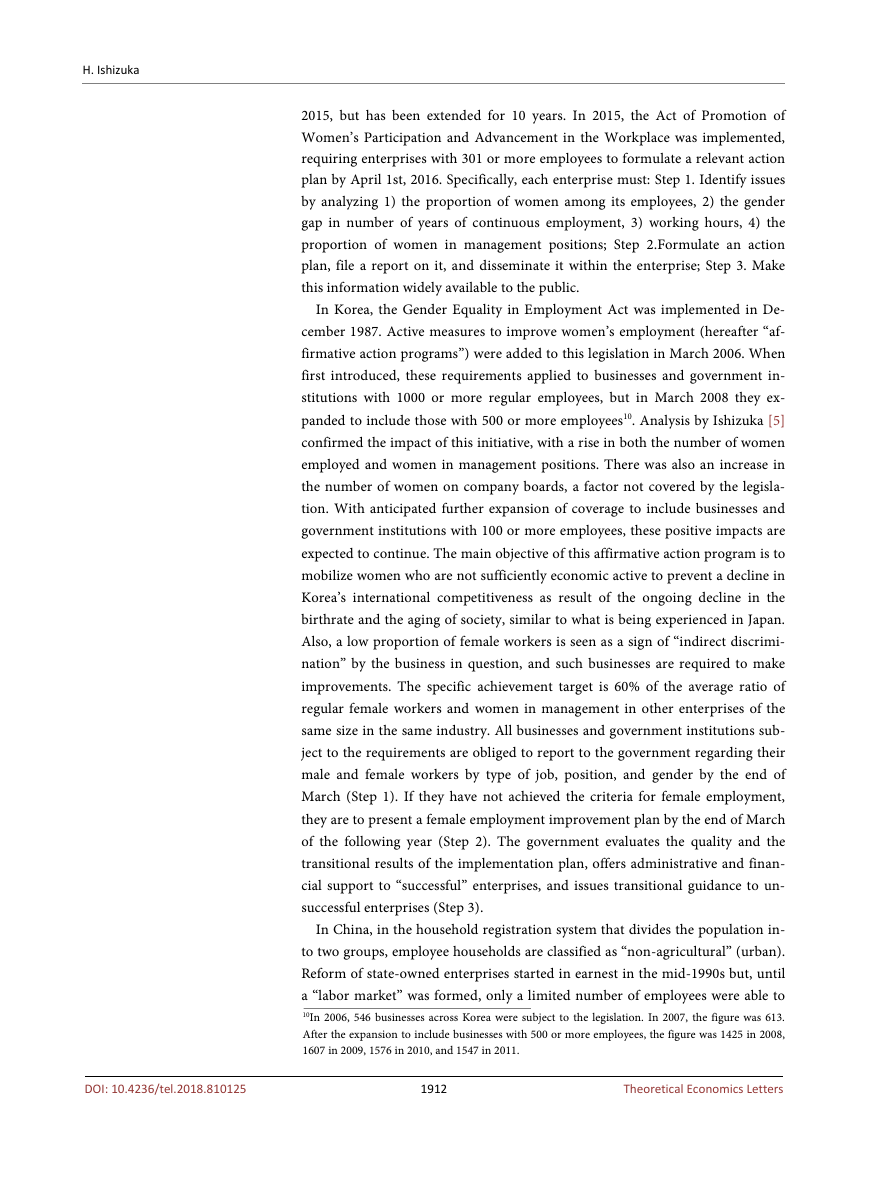
Next, to highlight trends in the male and female labor force participation rates
in Japan, Korea, and China overall, Figure 4 shows trends in the labor force par-
ticipation rate for only the productive population (aged 15 - 64). Limiting the
data to the productive population reduces the impact of the aging population in
the three countries.
7The State Council’s 1957 provisional regulations relating to retirement age for workers and officials
set the retirement age at state-run and other publicly-owned enterprises at 50 for female workers
and 55 for female officials and at 60 for male workers and officials (though the retirement age for
women and men doing heavy labor was set at 45 and 55, respectively). These retirement ages are still
currently widely effective, including at ordinary businesses. In addition, the labor insurance regula-
tions of 1951 and 1953 stated that male workers and officials who had reached 60 and had total ser-
vice of 25 years, at least five of them at the enterprise in question, could receive an old-age pension
after mandatory retirement; for female workers and officials, the relevant age is 50, with total service
of 20 years, at least five of them at the enterprise in question (Ishizuka [11], p.24). In other words,
retirement age for women is around 10 years earlier than men, and they are able to receive a pension
at the same level as their low wages without carrying out market labor. Thus, the system was very
much welcomed by women.
8In addition, Ishizuka [12] states that the normalization of female employment in China has been
promoted by the short period of childrearing compared to women in other countries as a result of
the constraints of the one-child policy, and also by the short working period compared to men.
1910
Theoretical Economics Letters
DOI: 10.4236/tel.2018.810125
�
H. Ishizuka
(a)
(b)
Figure 4. Trends in the Labor Force Participation Ratio. (Females, 15 - 64 in Japan, Ko-
rea, and China (Overall) (Unit: %). Trends in the Labor Force Participation Ratio (Males,
15 - 64 in Japan, Korea and China (Overall), Unit: %). Data Source: World Bank HP: Data
Base (ages 15 - 64, modeled ILO estimate). Note: According to the definition of the labor
force participation rate, the rate includes individuals 15 years of age and older. However,
this data expresses population figures for the productive ages of “from 15 to 64 years of
age.”
The two charts show that the gender gap in the labor force participation rate
in Japan and Korea has shrunk from about 25 points in 1990 to around 20 points
now, as participation by women has gradually increased and participation by
men has remained flat. Meanwhile, while the gender gap in labor force partici-
pation has stayed close to the 10 points seen in 1990, participation rates in China
for both men and women fell after the reform of state-owned enterprises in the
middle of the 1990s. Having been impacted by the economic downturn of the
summer of 2008, they have increased slightly from a bottom in 2010. The cur-
rent gender gap in the roughly calculated labor force participation rate has ex-
panded to 14 points (women 70% and men 84%).
We will now outline labor market-related policies in each of the three coun-
tries.
In Japan, the Gender Equality in Employment Act was implemented in 1986.
In 2003, the Act on Advancement of Measures to Support Raising the Next
Generation of Children was implemented, obliging business owners and muni-
cipalities that have 301 or more regular employees to give notification of a rele-
vant action plan. In 2011, the obligation expanded to include employers and
corporations with more than 100 employees9. This legislation expired in March
9As of June 2013, 67,177 ordinary enterprises with 101 or more employees had given notification
that they had formulated a relevant action plan, with 1,588 of these enterprises receiving approval
from the Ministry of Heath, Labour and Welfare.
1911
Theoretical Economics Letters
DOI: 10.4236/tel.2018.810125
�
H. Ishizuka
DOI: 10.4236/tel.2018.810125
2015, but has been extended for 10 years. In 2015, the Act of Promotion of
Women’s Participation and Advancement in the Workplace was implemented,
requiring enterprises with 301 or more employees to formulate a relevant action
plan by April 1st, 2016. Specifically, each enterprise must: Step 1. Identify issues
by analyzing 1) the proportion of women among its employees, 2) the gender
gap in number of years of continuous employment, 3) working hours, 4) the
proportion of women in management positions; Step 2.Formulate an action
plan, file a report on it, and disseminate it within the enterprise; Step 3. Make
this information widely available to the public.
In Korea, the Gender Equality in Employment Act was implemented in De-
cember 1987. Active measures to improve women’s employment (hereafter “af-
firmative action programs”) were added to this legislation in March 2006. When
first introduced, these requirements applied to businesses and government in-
stitutions with 1000 or more regular employees, but in March 2008 they ex-
panded to include those with 500 or more employees10. Analysis by Ishizuka [5]
confirmed the impact of this initiative, with a rise in both the number of women
employed and women in management positions. There was also an increase in
the number of women on company boards, a factor not covered by the legisla-
tion. With anticipated further expansion of coverage to include businesses and
government institutions with 100 or more employees, these positive impacts are
expected to continue. The main objective of this affirmative action program is to
mobilize women who are not sufficiently economic active to prevent a decline in
Korea’s international competitiveness as result of the ongoing decline in the
birthrate and the aging of society, similar to what is being experienced in Japan.
Also, a low proportion of female workers is seen as a sign of “indirect discrimi-
nation” by the business in question, and such businesses are required to make
improvements. The specific achievement target is 60% of the average ratio of
regular female workers and women in management in other enterprises of the
same size in the same industry. All businesses and government institutions sub-
ject to the requirements are obliged to report to the government regarding their
male and female workers by type of job, position, and gender by the end of
March (Step 1). If they have not achieved the criteria for female employment,
they are to present a female employment improvement plan by the end of March
of the following year (Step 2). The government evaluates the quality and the
transitional results of the implementation plan, offers administrative and finan-
cial support to “successful” enterprises, and issues transitional guidance to un-
successful enterprises (Step 3).
In China, in the household registration system that divides the population in-
to two groups, employee households are classified as “non-agricultural” (urban).
Reform of state-owned enterprises started in earnest in the mid-1990s but, until
a “labor market” was formed, only a limited number of employees were able to
10In 2006, 546 businesses across Korea were subject to the legislation. In 2007, the figure was 613.
After the expansion to include businesses with 500 or more employees, the figure was 1425 in 2008,
1607 in 2009, 1576 in 2010, and 1547 in 2011.
1912
Theoretical Economics Letters
�


 2023年江西萍乡中考道德与法治真题及答案.doc
 2012年重庆南川中考生物真题及答案.doc
 2013年江西师范大学地理学综合及文艺理论基础考研真题.doc
 2020年四川甘孜小升初语文真题及答案I卷.doc
 2020年注册岩土工程师专业基础考试真题及答案.doc
 2023-2024学年福建省厦门市九年级上学期数学月考试题及答案.doc
 2021-2022学年辽宁省沈阳市大东区九年级上学期语文期末试题及答案.doc
 2022-2023学年北京东城区初三第一学期物理期末试卷及答案.doc
 2018上半年江西教师资格初中地理学科知识与教学能力真题及答案.doc
 2012年河北国家公务员申论考试真题及答案-省级.doc
 2020-2021学年江苏省扬州市江都区邵樊片九年级上学期数学第一次质量检测试题及答案.doc
 2022下半年黑龙江教师资格证中学综合素质真题及答案.doc