实验考试报告
实验名称
一、用计算机仿真的方法求解微分方程(10 分)
实验目的
实验工具
测试微分方程的计算机仿真求解
MATLAB7.0
考
题
,
实
验
代
码
及
结
果
8’
参考微分方程:
2
d y
2
dt
2
d y
2
dt
3
y t
dy
dt
9
y t
4exp
t
/ 2 ,
t
20
3
dy
dt
9
y t
4exp
t
/ 2 ,
t
20
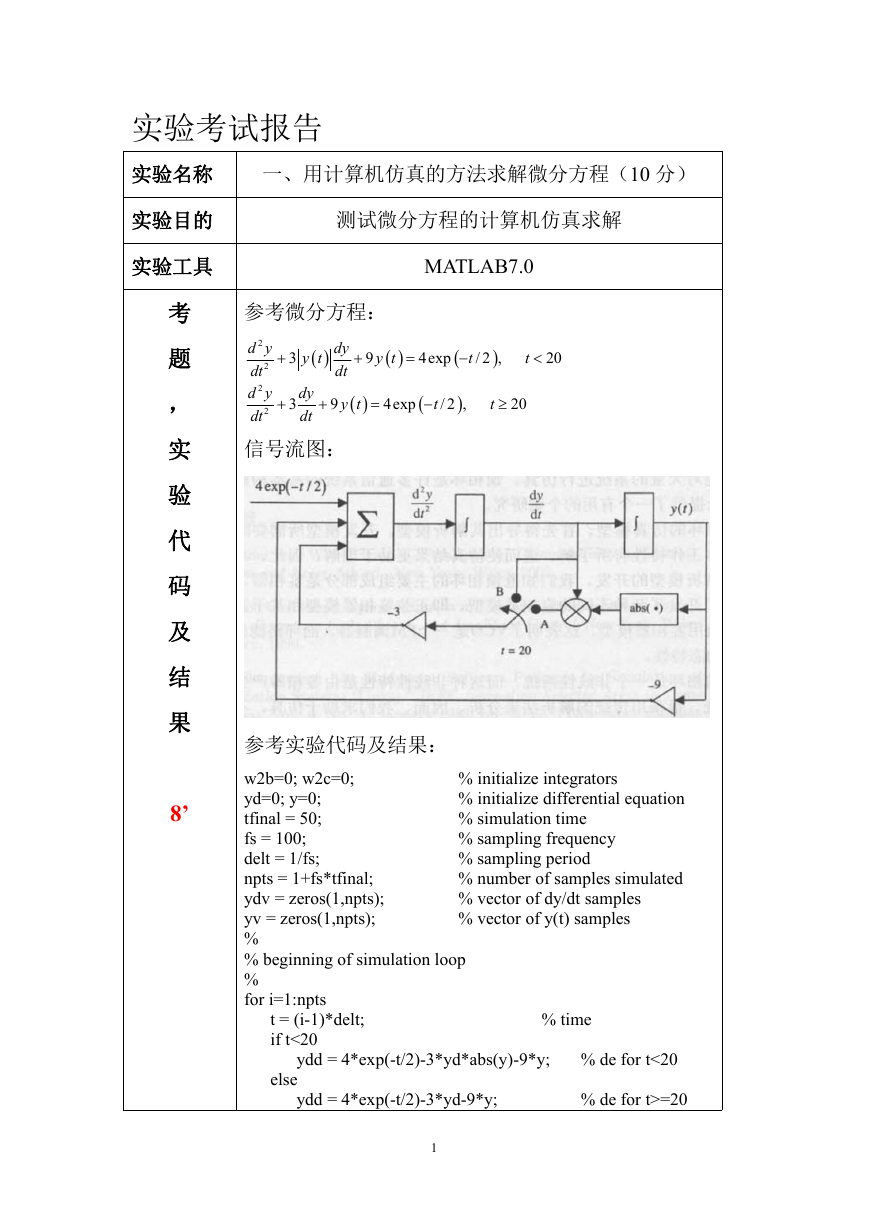
信号流图:
参考实验代码及结果:
w2b=0; w2c=0;
yd=0; y=0;
tfinal = 50;
fs = 100;
delt = 1/fs;
npts = 1+fs*tfinal;
ydv = zeros(1,npts);
yv = zeros(1,npts);
%
% beginning of simulation loop
%
for i=1:npts
% initialize integrators
% initialize differential equation
% simulation time
% sampling frequency
% sampling period
% number of samples simulated
% vector of dy/dt samples
% vector of y(t) samples
t = (i-1)*delt;
if t<20
else
ydd = 4*exp(-t/2)-3*yd*abs(y)-9*y;
ydd = 4*exp(-t/2)-3*yd-9*y;
% time
% de for t<20
% de for t>=20
1
�
end
w1b=ydd+w2b;
w2b=ydd+w1b;
yd=w1b/(2*fs);
w1c=yd+w2c;
w2c=yd+w1c;
y=w1c/(2*fs);
ydv(1,i) = yd;
yv(1,i) = y;
end
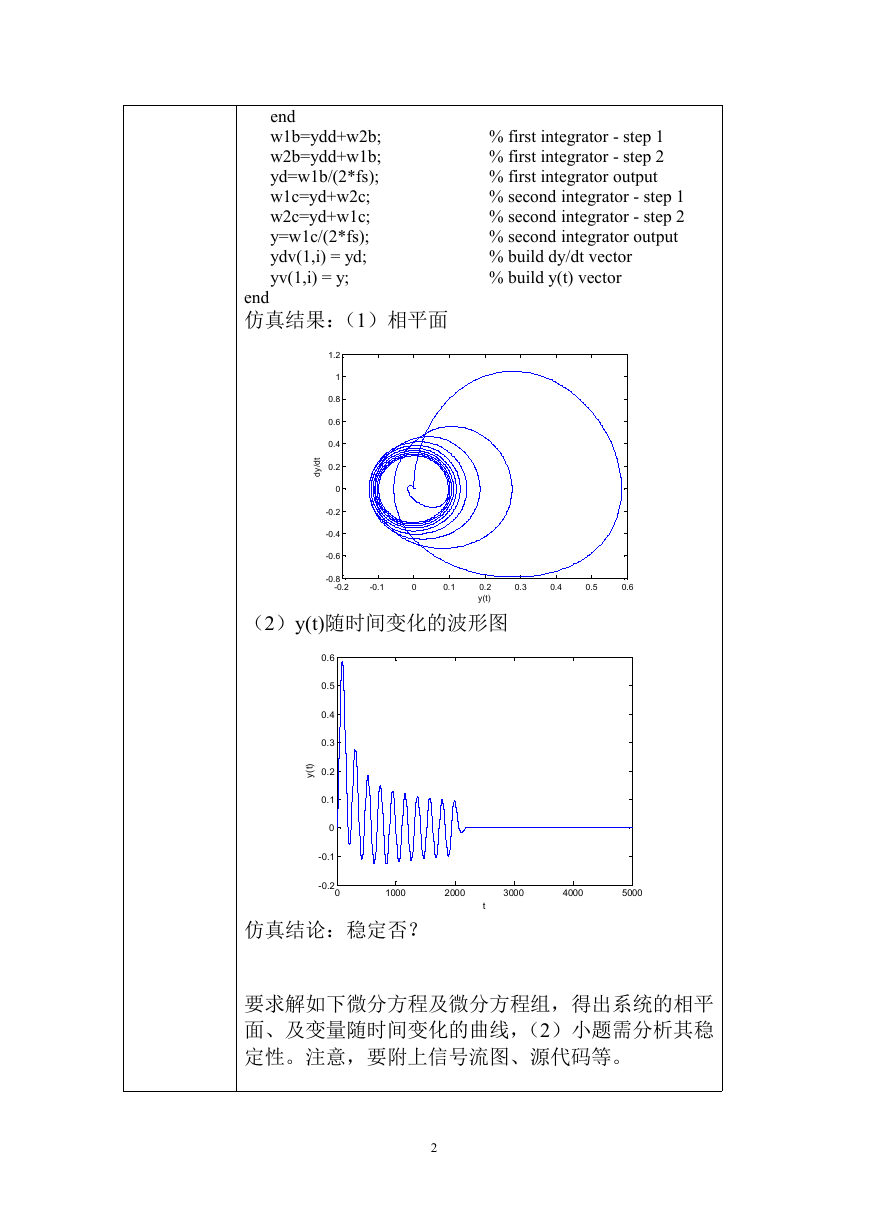
仿真结果:(1)相平面
% first integrator - step 1
% first integrator - step 2
% first integrator output
% second integrator - step 1
% second integrator - step 2
% second integrator output
% build dy/dt vector
% build y(t) vector
1.2
1
0.8
0.6
0.4
0.2
0
-0.2
-0.4
-0.6
t
d
/
y
d
-0.8
-0.2
-0.1
0
0.1
0.2
y(t)
0.3
0.4
0.5
0.6
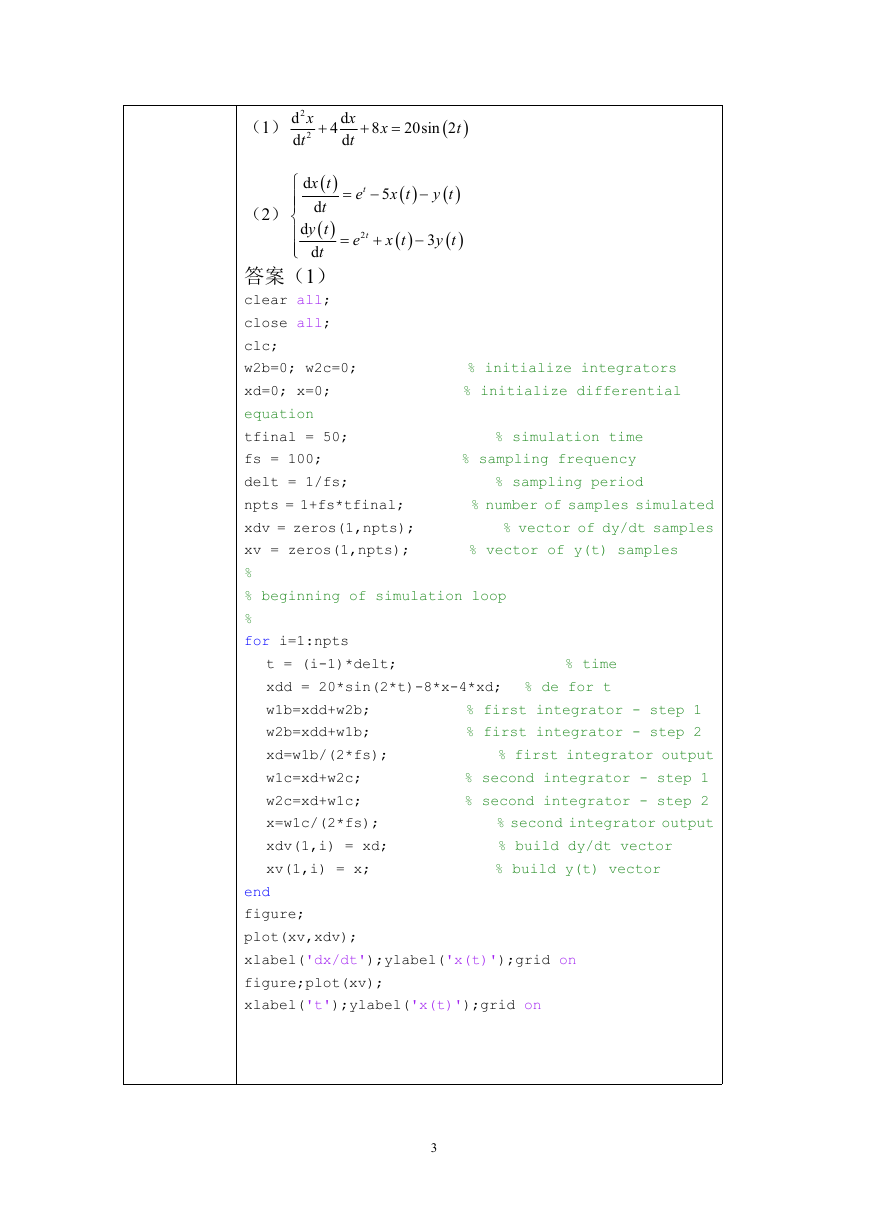
(2)y(t)随时间变化的波形图
0.6
0.5
0.4
0.3
)
t
(
y
0.2
0.1
0
-0.1
-0.2
0
1000
2000
t
3000
4000
5000
仿真结论:稳定否?
要求解如下微分方程及微分方程组,得出系统的相平
面、及变量随时间变化的曲线,(2)小题需分析其稳
定性。注意,要附上信号流图、源代码等。
2
�
(1)
x
2
2
d
d
t
d4
x
d
t
8
x
20sin 2
t
d
2
t
e
d
t
e
3
x t
5
x t
y t
y t
(2)
x t
d
t
y t
d
t
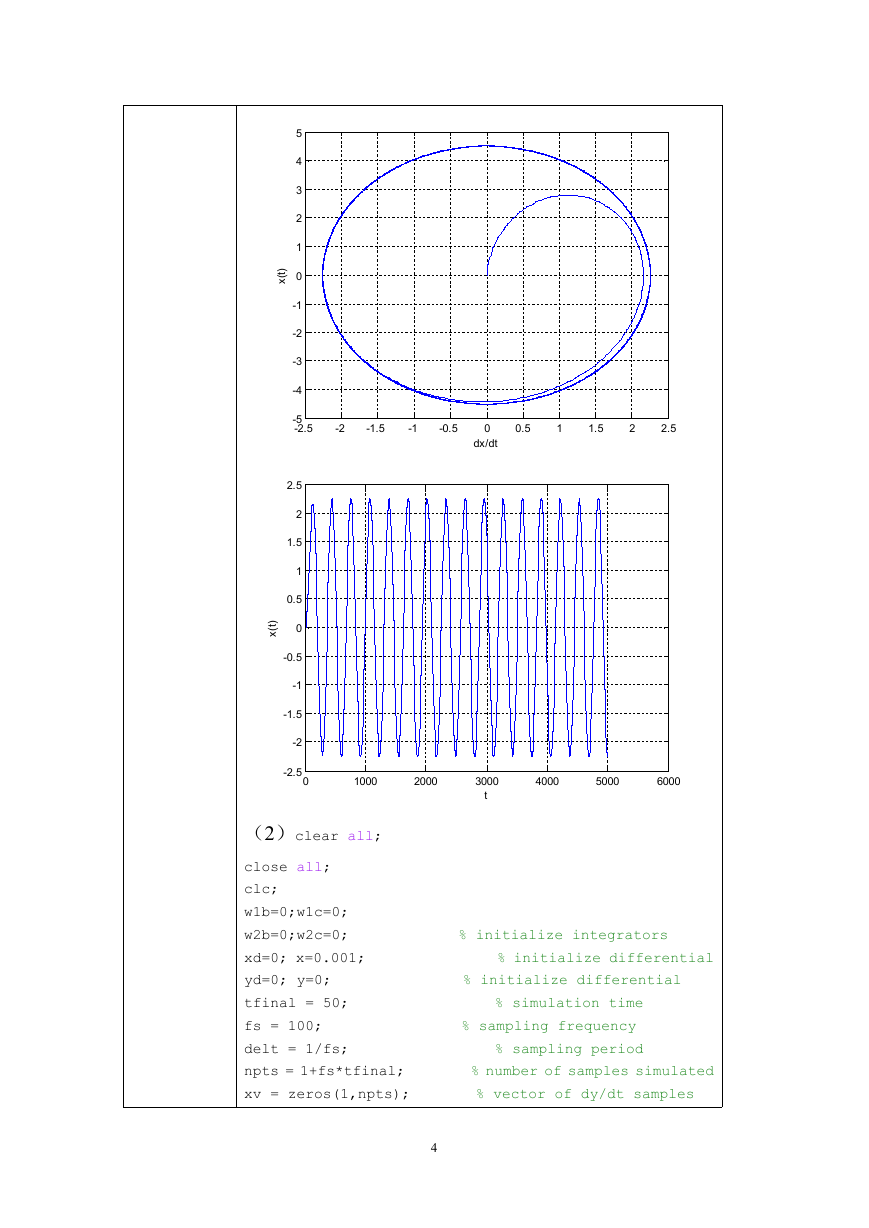
答案(1)
clear all;
close all;
clc;
w2b=0; w2c=0;
xd=0; x=0;
equation
tfinal = 50;
fs = 100;
delt = 1/fs;
npts = 1+fs*tfinal;
xdv = zeros(1,npts);
xv = zeros(1,npts);
%
% beginning of simulation loop
%
for i=1:npts
% initialize integrators
% initialize differential
% simulation time
% sampling frequency
% sampling period
% number of samples simulated
% vector of dy/dt samples
% vector of y(t) samples
% time
% de for t
t = (i-1)*delt;
xdd = 20*sin(2*t)-8*x-4*xd;
w1b=xdd+w2b;
w2b=xdd+w1b;
xd=w1b/(2*fs);
w1c=xd+w2c;
w2c=xd+w1c;
x=w1c/(2*fs);
xdv(1,i) = xd;
xv(1,i) = x;
% first integrator - step 1
% first integrator - step 2
% first integrator output
% second integrator - step 1
% second integrator - step 2
% second integrator output
% build dy/dt vector
% build y(t) vector
end
figure;
plot(xv,xdv);
xlabel('dx/dt');ylabel('x(t)');grid on
figure;plot(xv);
xlabel('t');ylabel('x(t)');grid on
3
�
5
4
3
2
1
0
-1
-2
-3
-4
)
t
(
x
-5
-2.5
-2
-1.5
-1
-0.5
0.5
1
1.5
2
2.5
0
dx/dt
2.5
2
1.5
1
0.5
)
t
(
x
0
-0.5
-1
-1.5
-2
-2.5
0
1000
2000
3000
t
4000
5000
6000
(2)clear all;
close all;
clc;
w1b=0;w1c=0;
w2b=0;w2c=0;
xd=0; x=0.001;
yd=0; y=0;
tfinal = 50;
fs = 100;
delt = 1/fs;
npts = 1+fs*tfinal;
xv = zeros(1,npts);
4
% initialize integrators
% initialize differential
% initialize differential
% simulation time
% sampling frequency
% sampling period
% number of samples simulated
% vector of dy/dt samples
�
yv = zeros(1,npts);
for i=1:npts
t(i) = (i-1)*delt;
xd = exp(t(i))-5*x-y;
w1b=xd+w2b;
w2b=xd+w1b;
x=w1b/(2*fs);
xx(i)=x;
% vector of y(t) samples
% time
% de for t
% first integrator - step 1
% first integrator - step 2
% first integrator output
% second integrator - step 1
% second integrator - step 2
% second integrator output
% build dy/dt vector
% build y(t) vector
yd = exp(2*t(i))-x-3*y; % de for t
w1c=yd+w2c;
w2c=yd+w1c;
y=w1c/(2*fs);
yy(i)=y;
xv(1,i) = x;
yv(1,i) = y;
end
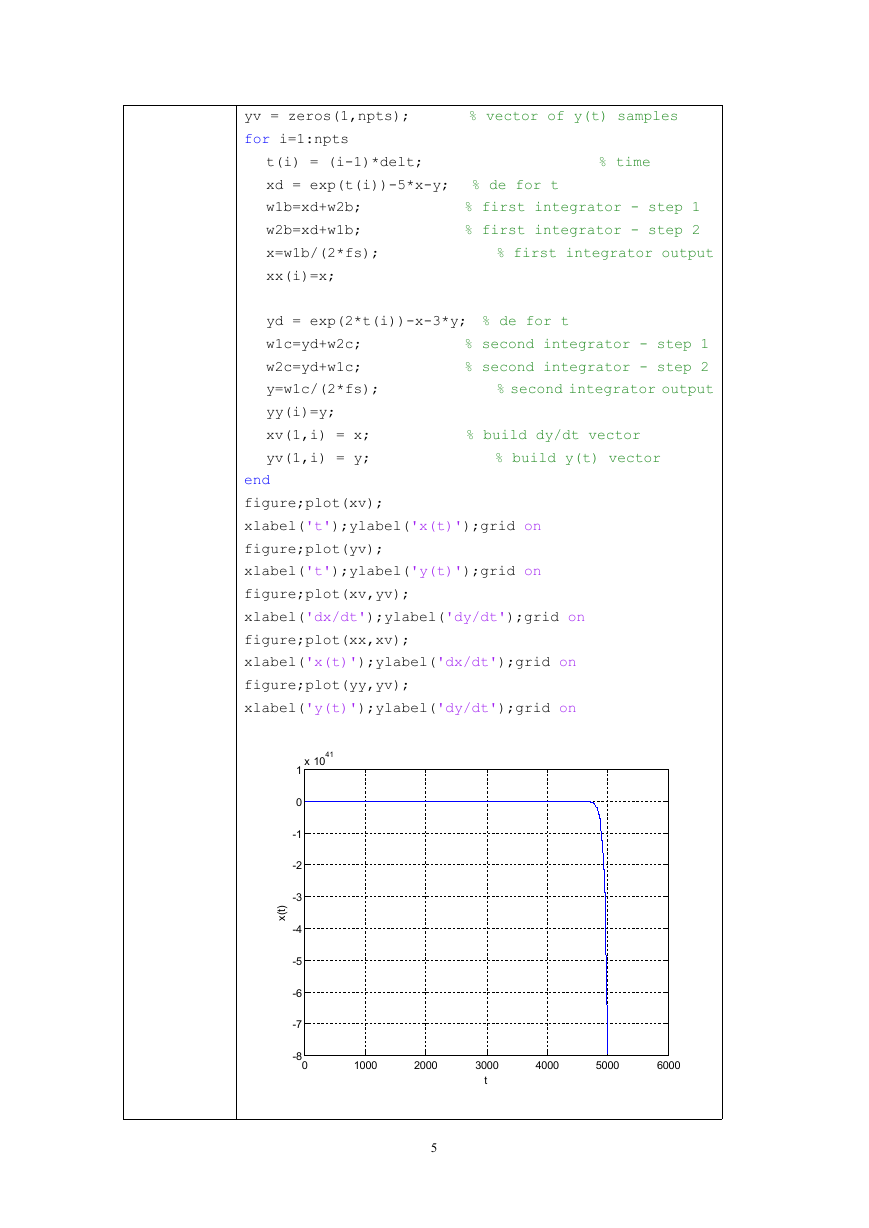
figure;plot(xv);
xlabel('t');ylabel('x(t)');grid on
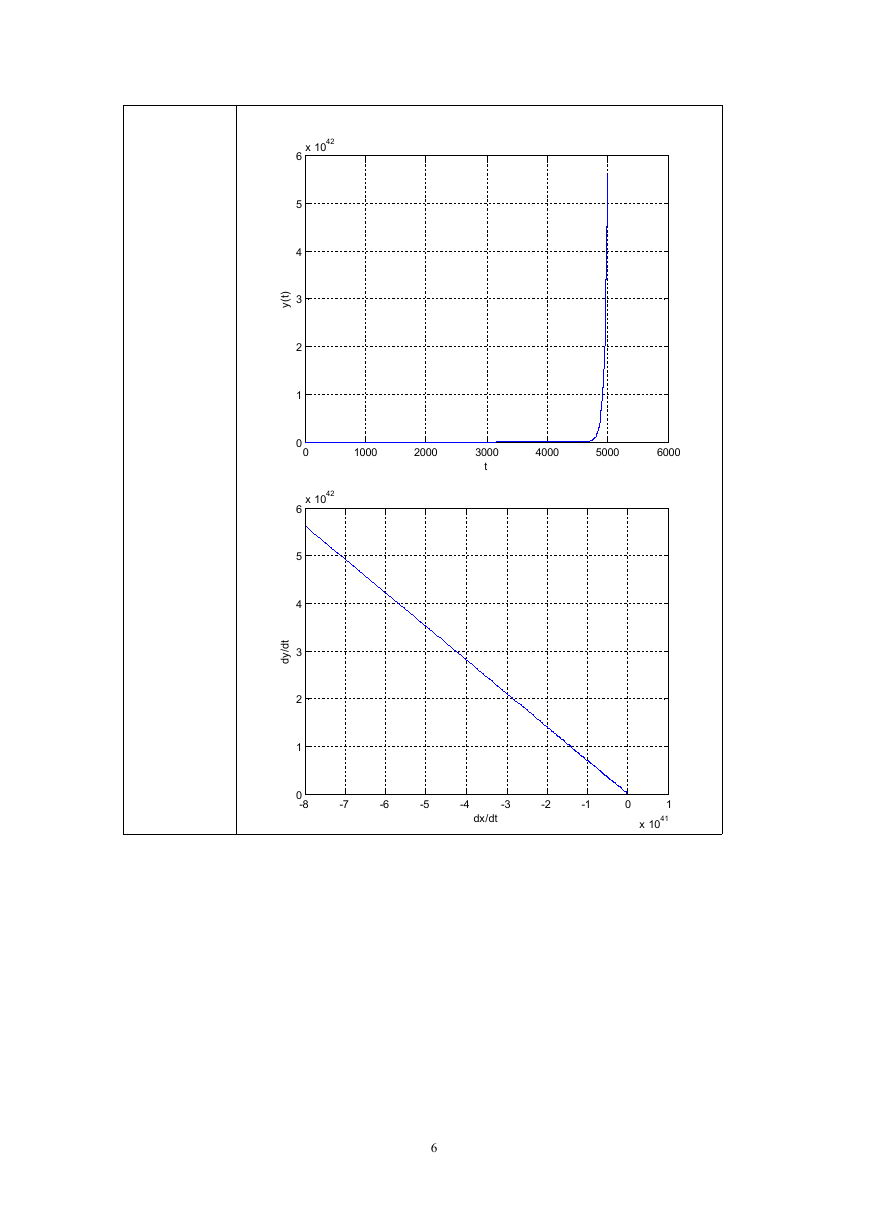
figure;plot(yv);
xlabel('t');ylabel('y(t)');grid on
figure;plot(xv,yv);
xlabel('dx/dt');ylabel('dy/dt');grid on
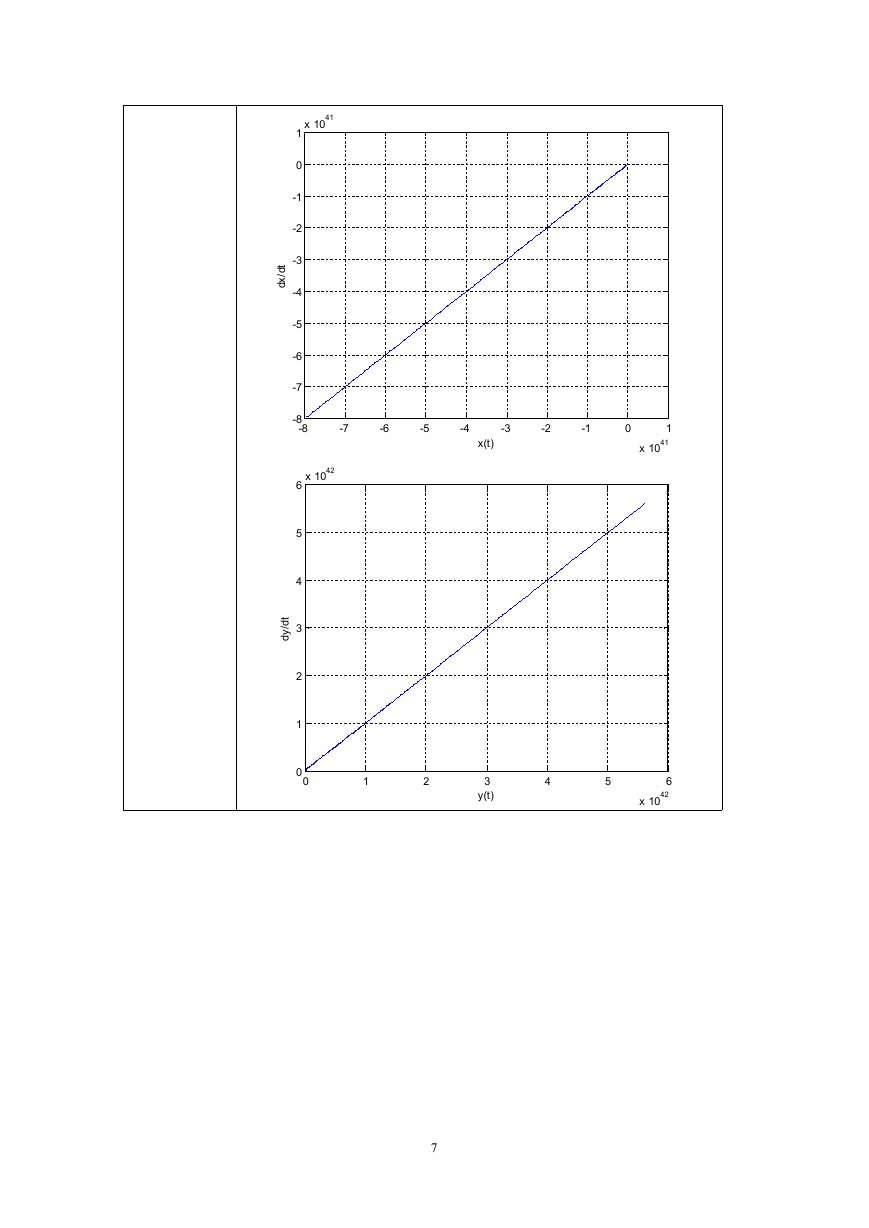
figure;plot(xx,xv);
xlabel('x(t)');ylabel('dx/dt');grid on
figure;plot(yy,yv);
xlabel('y(t)');ylabel('dy/dt');grid on
x 1041
1
0
-1
-2
-3
-4
-5
-6
-7
)
t
(
x
-8
0
1000
2000
3000
t
4000
5000
6000
5
�
x 1042
6
5
4
)
t
(
y
3
2
1
0
0
x 1042
6
5
4
t
d
/
y
d
3
2
1
0
-8
1000
2000
3000
t
4000
5000
6000
-7
-6
-5
-4
-3
-2
-1
dx/dt
0
1
x 1041
6
�
x 1041
1
0
-1
-2
-3
-4
-5
-6
-7
t
d
/
x
d
-8
-8
-7
-6
-5
-4
-3
-2
-1
x(t)
0
1
x 1041
x 1042
6
5
4
t
d
/
y
d
3
2
1
0
0
1
2
3
y(t)
4
5
6
x 1042
7
�
实验名称 二、用计算机仿真的蒙特卡洛方法求定积分(10 分)
实验目的
实验工具
测试蒙特卡洛求解定积分
MATLAB7.0
考
题
,
实
验
代
码
及
结
果
8’
参考例 9-5:
dx
利用定积分 1
0 1
x
I
2
4
,求解的估计值。
参考实验代码及结果:
% File: c9_example5
% Software given here is to accompany the textbook: W.H. Tranter,
% K.S. Shanmugan, T.S. Rappaport, and K.S. Kosbar, Principles of
% Communication Systems Simulation with Wireless Applications,
% Prentice Hall PTR, 2004.
%
% Number of experiments
M=5;
% Trials per experiment
N=500;
% Generate random numbers
u = rand(N,M);
% Define function
uu = 1./(1+u.*u);
data = zeros(N,M);
% Initialize array
% The following four lines of code determine
% M estimates as a function of j, 0


 2023年江西萍乡中考道德与法治真题及答案.doc
 2012年重庆南川中考生物真题及答案.doc
 2013年江西师范大学地理学综合及文艺理论基础考研真题.doc
 2020年四川甘孜小升初语文真题及答案I卷.doc
 2020年注册岩土工程师专业基础考试真题及答案.doc
 2023-2024学年福建省厦门市九年级上学期数学月考试题及答案.doc
 2021-2022学年辽宁省沈阳市大东区九年级上学期语文期末试题及答案.doc
 2022-2023学年北京东城区初三第一学期物理期末试卷及答案.doc
 2018上半年江西教师资格初中地理学科知识与教学能力真题及答案.doc
 2012年河北国家公务员申论考试真题及答案-省级.doc
 2020-2021学年江苏省扬州市江都区邵樊片九年级上学期数学第一次质量检测试题及答案.doc
 2022下半年黑龙江教师资格证中学综合素质真题及答案.doc