Teradata Manager
User Guide
Preface
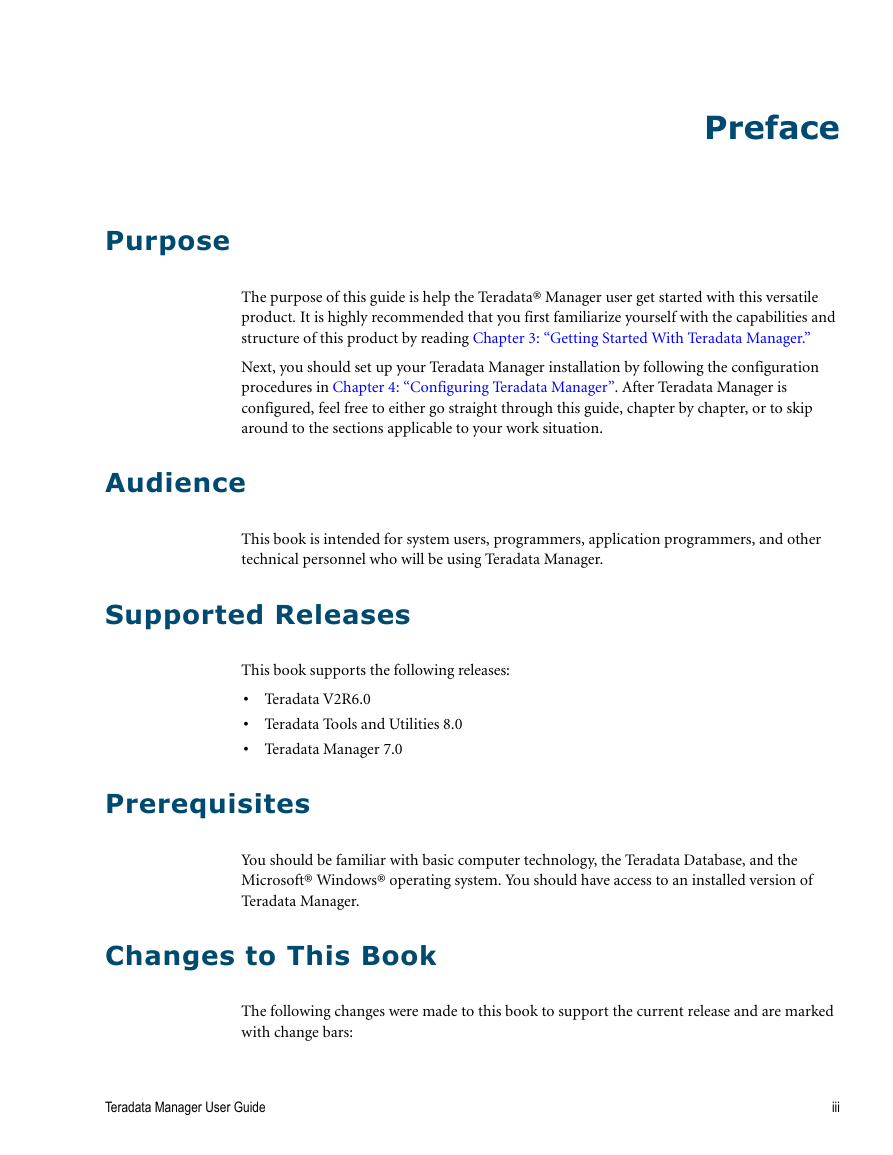
Purpose
Audience
Supported Releases
Prerequisites
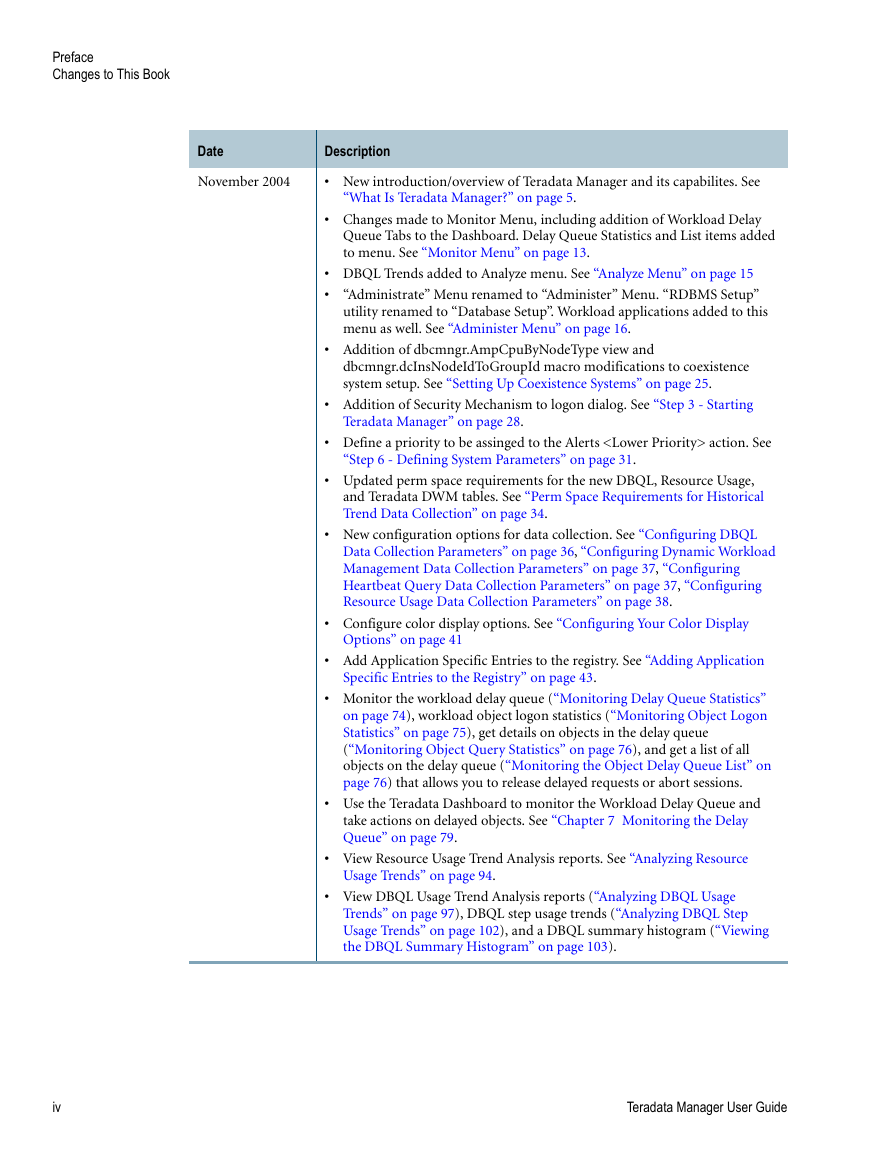
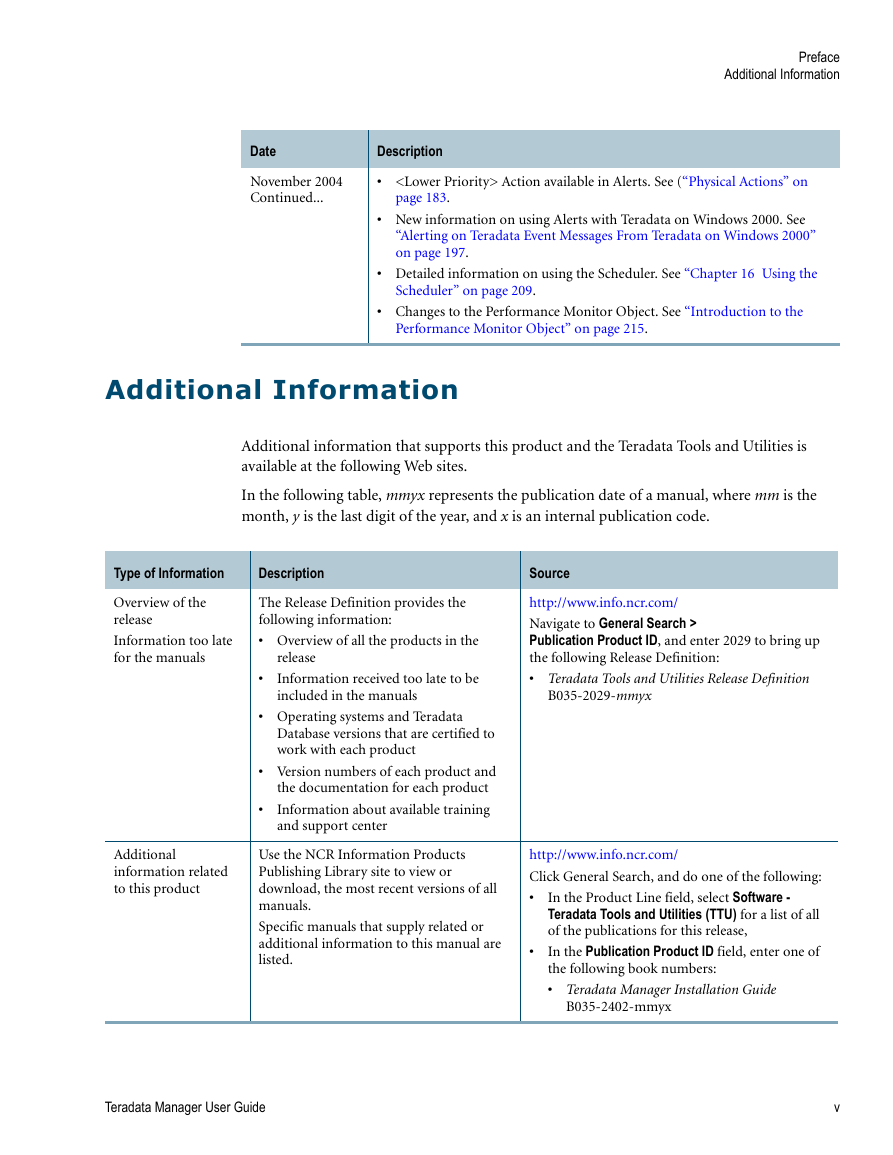
Changes to This Book
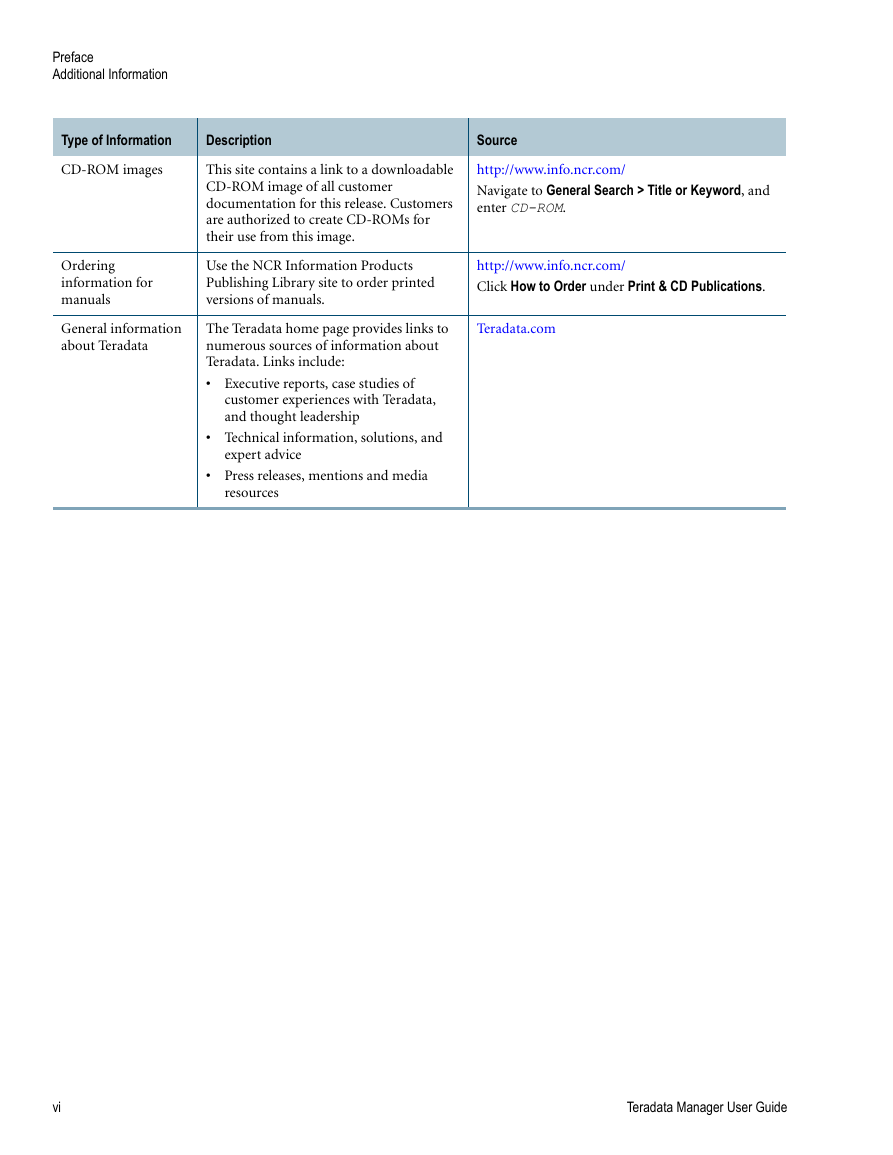
Additional Information
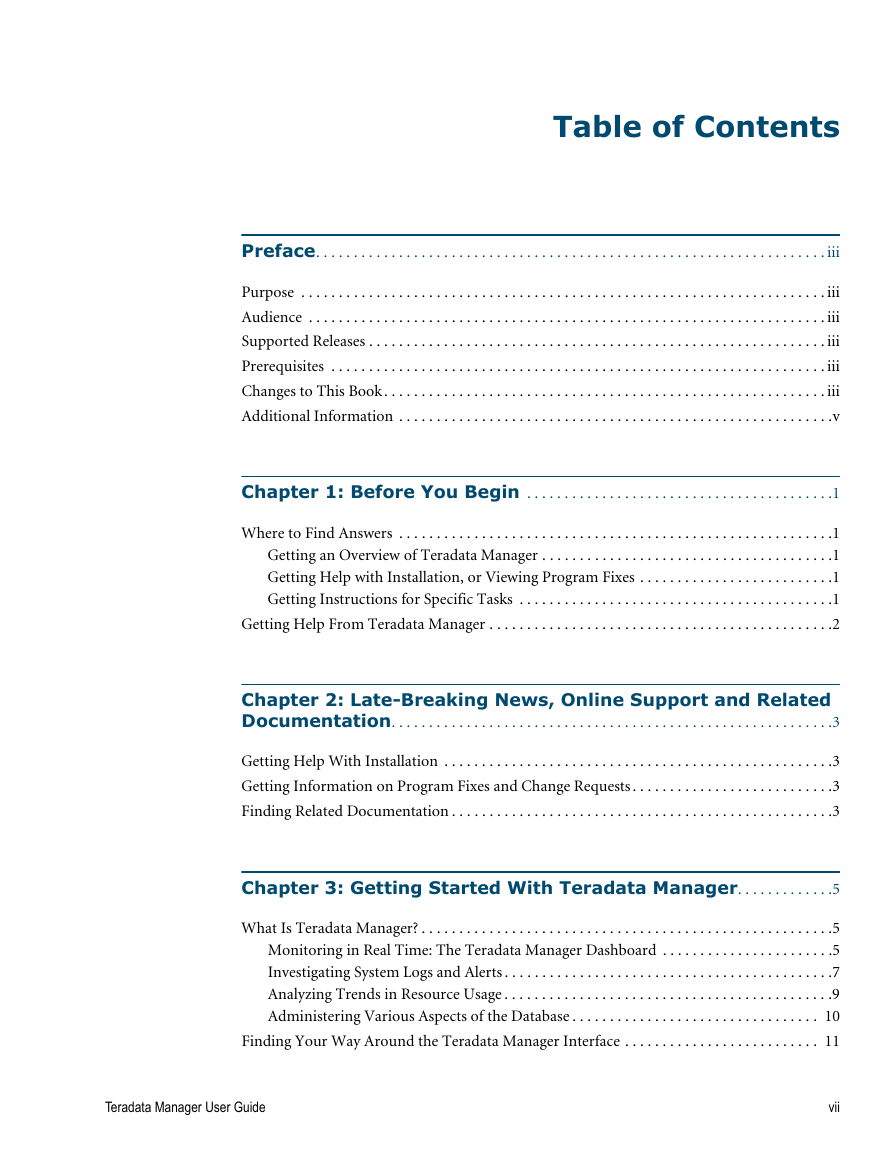
Table of Contents
Chapter 1 Before You Begin
Where to Find Answers
Getting an Overview of Teradata Manager
Getting Help with Installation, or Viewing Program Fixes
Getting Instructions for Specific Tasks
Getting Help From Teradata Manager
Chapter 2 Late-Breaking News, Online Support and Related Documentation
Getting Help With Installation
Getting Information on Program Fixes and Change Requests
Finding Related Documentation
Chapter 3 Getting Started With Teradata Manager
What Is Teradata Manager?
Monitoring in Real Time: The Teradata Manager Dashboard
Investigating System Logs and Alerts
Analyzing Trends in Resource Usage
Administering Various Aspects of the Database
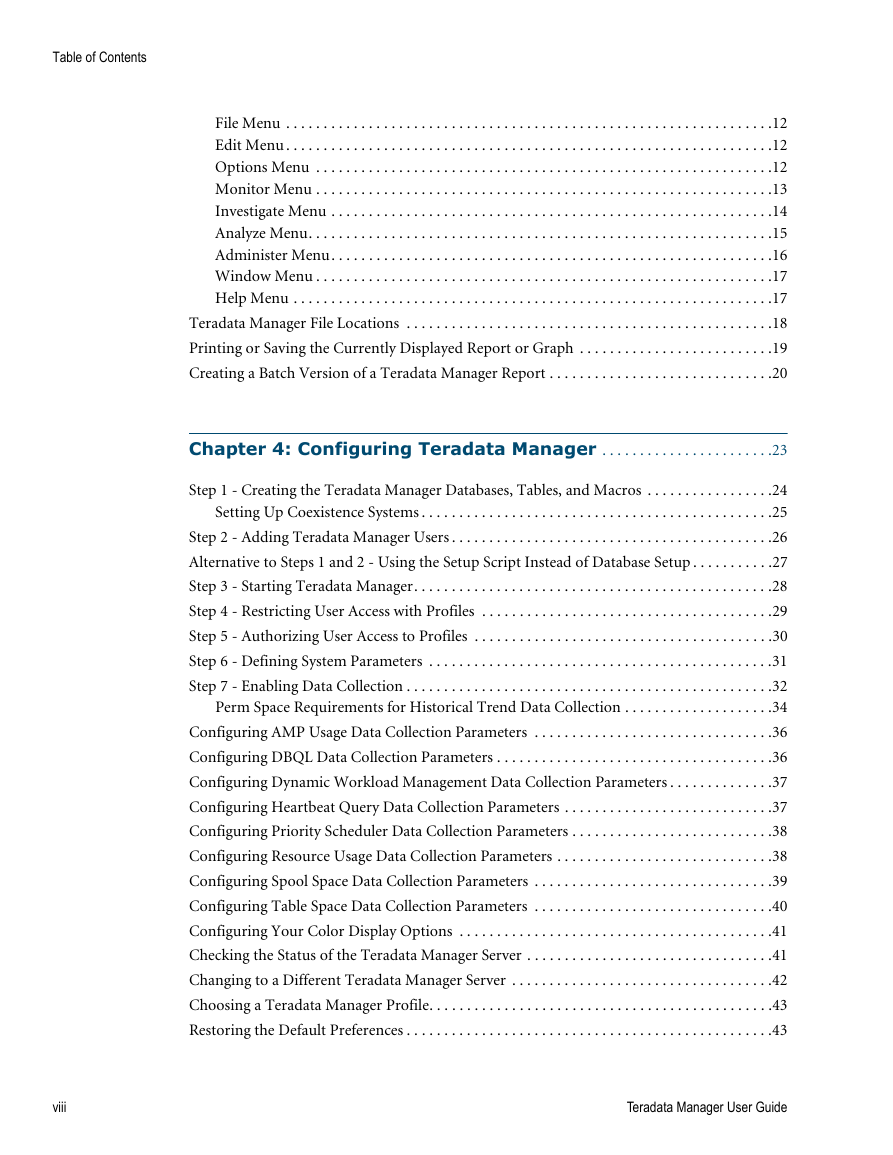
Finding Your Way Around the Teradata Manager Interface
File Menu
Edit Menu
Options Menu
Monitor Menu
Investigate Menu
Analyze Menu
Administer Menu
Window Menu
Help Menu
Teradata Manager File Locations
Printing or Saving the Currently Displayed Report or Graph
Creating a Batch Version of a Teradata Manager Report
Chapter 4 Configuring Teradata Manager
Step 1 - Creating the Teradata Manager Databases, Tables, and Macros
Setting Up Coexistence Systems
Step 2 - Adding Teradata Manager Users
Alternative to Steps 1 and 2 - Using the Setup Script Instead of Database Setup
Step 3 - Starting Teradata Manager
Step 4 - Restricting User Access with Profiles
Step 5 - Authorizing User Access to Profiles
Step 6 - Defining System Parameters
Step 7 - Enabling Data Collection
Perm Space Requirements for Historical Trend Data Collection
Configuring AMP Usage Data Collection Parameters
Configuring DBQL Data Collection Parameters
Configuring Dynamic Workload Management Data Collection Parameters
Configuring Heartbeat Query Data Collection Parameters
Configuring Priority Scheduler Data Collection Parameters
Configuring Resource Usage Data Collection Parameters
Configuring Spool Space Data Collection Parameters
Configuring Table Space Data Collection Parameters
Configuring Your Color Display Options
Checking the Status of the Teradata Manager Server
Teradata Manager Service Registration
Changing to a Different Teradata Manager Server
Choosing a Teradata Manager Profile
Restoring the Default Preferences
Adding Application Specific Entries to the Registry
Application Specific Entry Example
Adding Additional Applications to the Teradata Manager Menu Bar
Chapter 5 Configuring the SNMP Agent
The Teradata Manager Alerts SNMP MIB
MIB Object Structure
Viewing SNMP MIB Objects with CA Unicenter TNG Framework
Adding the Teradata Manager MIB to the CA Unicenter TNG Framework
Creating a Graph Using Unicenter TNG
SNMP Troubleshooting Tips
Install Teradata Manager as an Administrator
Configuration
The Trap Daemon
Set the System PATH Environment Variable on Windows 2000
Chapter 6 Monitoring Real-Time System Activity
Monitoring Overall System Activity Using the Dashboard
Viewing the Dashboard
Dashboard Display Contents
Getting History Data Details
Summary Graph Contents
Monitoring Virtual Utilization
Vproc Utilization Report Contents
Getting Virtual Utilization Details
Vproc Utilization Detail Report Contents
Monitoring Physical Utilization
Node Utilization Report Contents
Getting Physical Utilization Details
Node Utilization Detail Report Contents
Monitoring Session Status
Session Status Report Contents
Getting Session Details
Session Detail Report Contents
Modifying Session Priority
Session Priority Attributes
Aborting Sessions
Abort Session Report Contents
Viewing What the Selected Session is Blocking
Blocking Sessions Report Contents
Viewing What the Selected Session is Blocked By
Blocked By Report Contents
Monitoring Delay Queue Statistics
Workload Delay Queue Statistics Report Contents
Monitoring Object Logon Statistics
Object Logon Statistics Report Contents
Monitoring Object Query Statistics
Object Query Statistics Report Contents
Monitoring the Object Delay Queue List
Object Delay Queue List Report Contents
Using Performance Monitor (PMON)
Using Session Information
The Graph Legend
Chapter 7 Monitoring the Delay Queue
Viewing a Snapshot of the Workload Delay Queue
Getting Workload Delay Queue Details
Workload Delay Queue Detail Report Contents
Viewing Workload Delay Queue History
Workload Delay Queue History Report Contents
Viewing and Releasing Requests in the Workload Delay Queue
Workload Delay Queue Session List Contents
Chapter 8 Analyzing Workload Trends
Analyzing CPU Utilization
CPU Utilization Report Contents
Analyzing Disk I/O Utilization
Disk I/O Utilization Report Contents
Analyzing Table Growth
Table Growth Report Contents
Analyzing Spool/Temp Space Usage
Spool/Temp Space Usage Report Contents
Analyzing Heartbeat Query Response Time
Response Time Report Contents
Analyzing User Count
User Count Report Contents
Analyzing Resource Usage Trends
Resource Usage Report Contents: CPU Usage
Resource Usage Report Contents: Disk Usage
Resource Usage Report Contents: Memory Usage
Resource Usage Report Contents: Bynet Usage
Resource Usage Report Contents: System Utilization
Analyzing DBQL Usage Trends
DBQL Usage Report Contents: Condition Indicator Count
DBQL Usage Report Contents: Response Time
DBQL Usage Report Contents: Resource Usage
DBQL Usage Report Contents: Parallelism
Analyzing DBQL Step Usage Trends
DBQL Step Usage Report Contents
Viewing the DBQL Summary Histogram
DBQL Summary Histogram Contents
Chapter 9 Analyzing Historical Resource Utilization
Analyzing Node CPU Utilization
Node CPU Utilization Report Contents
Analyzing AMP CPU Utilization
AMP CPU Utilization Report Contents
Analyzing PE CPU Utilization
PE CPU Utilization Report Contents
Analyzing Node Utilization
Node Utilization Report Contents
Analyzing Disk Utilization
Disk Utilization Report Contents
Analyzing Network (Bynet) Utilization
Network Utilization Report Contents
Analyzing Memory Utilization
Memory Utilization Report Contents
Analyzing Host Utilization
Host Utilization Report Contents
Non-Grouped Reports
Non-Grouped Report Contents
The History Query Filter
Chapter 10 Investigating Disk Space Utilization
Reallocating Disk Space
Move Space Fields and Controls
Transferring Database Ownership
Viewing Database Space Usage
Space by Database Report Contents
Viewing Space Usage By Table
Table Space Report Contents
Viewing Table Space Usage by Vproc
Table Space by Vproc Report Contents
Viewing the Create Table Statement
Viewing All Objects In a Database
Help Database Report Contents
Viewing Hierarchical Space Usage
Hierarchy Report Contents
Viewing Overall Space Usage by Vproc
Space by Vproc Report Contents
Viewing Cylinder Space by Vproc
Cylinder Space by Vproc Report Contents
Chapter 11 Investigating System Behavior
Investigating the Error Log
Investigating Logon Activity
Investigating Lock Contentions
Investigating System Performance Parameters
Chapter 12 Investigating the Audit Log
Before You Can Begin Creating Audit Reports
Setting the Audit Log Filter to Narrow Your Results
Auditing Database and User Activity
Audit Database and Users Activity Report Contents
Auditing Table, View and Macro Activity
Audit Table, View, Macro Activity Report Contents
Auditing Grant and Revoke Activity
Audit Grant and Revoke Activity Report Contents
Auditing Index Activity
Audit Index Activity Report Contents
Auditing Checkpoint, Dump and Restore Activity
Audit Checkpoint, Dump and Restore Activity Report Contents
Auditing Denials
Audit Denials Report Contents
Creating an Audit Summary Report
Audit Summary Report Contents
Creating a Custom Audit Report
Chapter 13 Using Teradata Priority Scheduler Administrator
Introduction to Priority Scheduler Administrator
Priority Definition Set Framework
About Resource Partitions
About Performance Groups and Allocation Groups
Overview of Priority Scheduler Components
About Resource Partitions
Resource Partition Parameters
Limiting Resource Partition CPU Usage
Suggestions for Using Resource Partitions
About Performance Groups
Performance Groups and Allocation Groups
Performance Group and Weight Defaults for Default Resource Partition
Performance Group Name
Performance Group Value
Performance Group Values in the Default Resource Partition
About Performance Periods
Performance Period Components
Performance Period Type and Milestone Limit
Time-of-day
Resource Usage
About Allocation Groups
Allocation Group Parameters
Set Type
Allocation Group Weight
Number of Active Users Affects Query Response Time
Scheduling Policy
Using Scheduling Policies
Step 1 - Starting the Teradata Priority Scheduler Administrator
Step 2 - Defining PD Set/Resource Partitions Parameters
Define the parameters in the PD Set/Resource Partitions panel
Priority Definition Set Parameters
Resource Partition Parameters (schmon -b)
Step 3 - Defining Performance Group Parameters
Define the parameters in the Performance Groups panel
Step 4 - Defining Allocation Groups Parameters
Define the parameters in the Allocation Groups panel
Viewing a Priority Definition Set Description
Viewing the Schmon Commands Used to Create a Priority Definition Set
Saving Priority Definition Set Information
Creating a New Priority Definition Set
Viewing Performance Data
Priority Scheduler Data Collector
Report Type and Time
Priority Scheduler Groups
Data Items
Viewing Session Information
Viewing a Session Report
Scheduling a Priority Definition Set
Comparing Relative Weights of Allocation Groups or Resource Partitions
Comparing Relative CPU Use of an Allocation Group or Resource Partition
Changing the Operating System Type
Defining Advanced PD Set/Resource Partition Parameters
Configuring the Priority Scheduler Administrator Display
Priority Scheduler Administrator Command Line Parameters
Chapter 14 Using Alerts to Monitor Your System
Introduction to the Alerts Facility
Creating a New Alert Policy
Defining Actions to the Policy
Physical Actions
Logical Actions
Defining Actions - Sending a Page
Defining Actions - Sending E-mail
Message Content
E-mail Alert Example
Configuring the System to Send E-mail Alerts
Before You Begin
The Configuration Procedure
Defining Actions - Running a Program
Command Line Parameters
Defining Actions - Running a BTEQ Script
Logon Information
Defining Actions - Generating an SNMP Trap
Set Up the Windows SNMP Service
Defining Actions - Action Lists
Defining Events to the Policy
Defining Events - Database Space
Defining Events - System Level Performance
Defining Events - Node Level Performance
Node Alerts and Non-TPA Nodes
Defining Events - Vproc Level Performance
Defining Data Collection Rates for the Policy
Applying the Policy to the Database
Displaying the Performance Status of the Database
Alerting on Teradata Event Messages From Teradata on Windows 2000
Alerts Examples
Sending a Text Page
Using Alerts for Session Management
Excluding Users from Alerts Monitoring
Using the AlertRequest Table
Using the MonitorRequest Table
Chapter 15 System Administration
Administering Workloads with Priority Scheduler Administrator
Administering Using the Database Console (Remote Console)
Administering System Alarms Using Alerts (Alert Policy Editor)
Administering Using the BTEQ Window
Administering Using Database Statistics (Statistics Collection)
Chapter 16 Using the Scheduler
How Does the Scheduler Work?
Using the Interval Option
Using the Calendar Option
Frequently Asked Questions
Scheduling Tasks That Launch Applications
Chapter 17 Using the Performance Monitor Object
Introduction to the Performance Monitor Object
Before You Start
Object Modes
Object Scope
Sample Files
Application Distribution Requirements
Required Files
File Registration
The Object Model
Object Model Error Messages
Chapter 18 Teradata Manager Applications
Alert Policy Editor
Alert Viewer
How It Works
BTEQ Window
Configuration Check
Where It Runs
Error Log Analyzer
Locking Logger
Application
Enabling Locking Logger
LogOnOff Usage
Application
Database Setup
How It Works
Priority Scheduler Administrator
Remote Console
Application
Session Information
Reports
Connection Options
Changing connections
Statistics Collection
What It Does
How It Works
Teradata Performance Monitor
How It Works
General Notes
Prerequisites
Resusage Tables
Glossary
Index


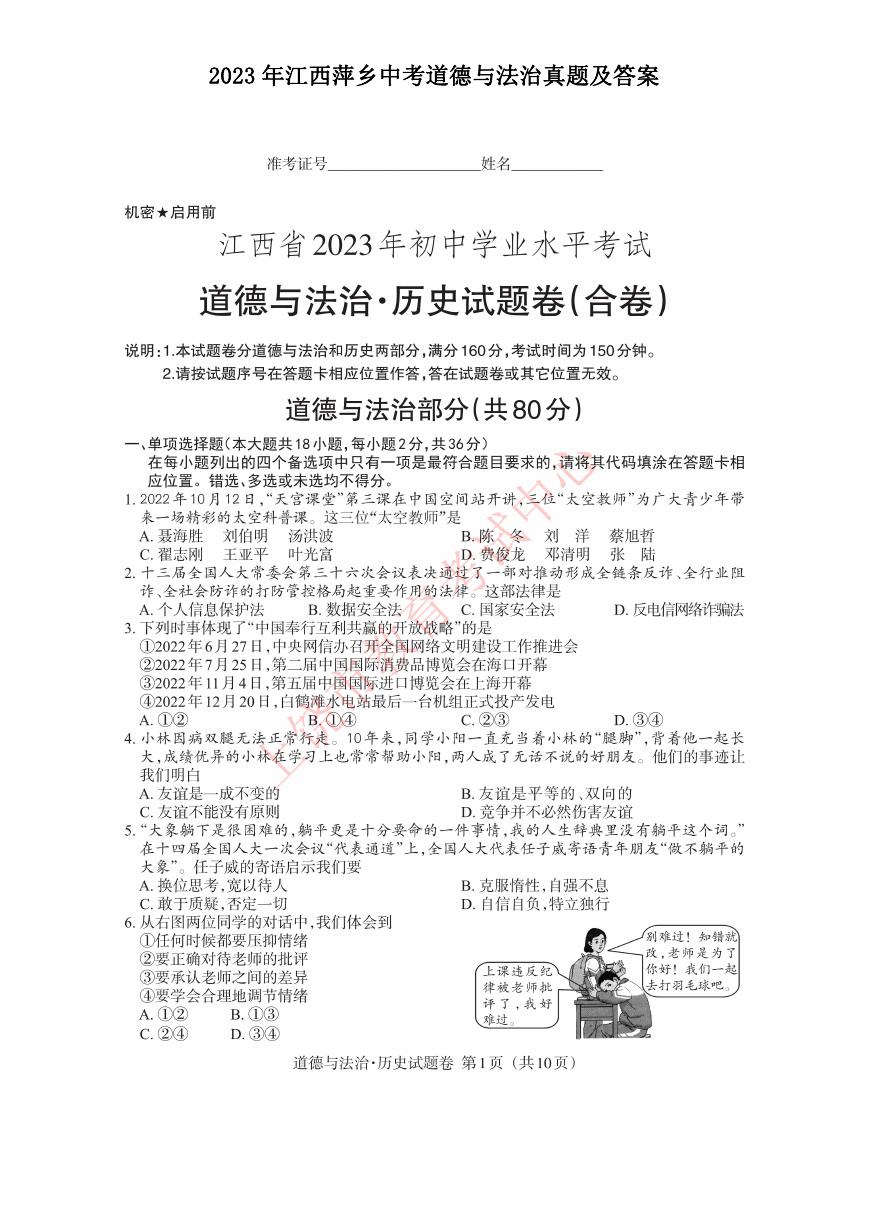 2023年江西萍乡中考道德与法治真题及答案.doc
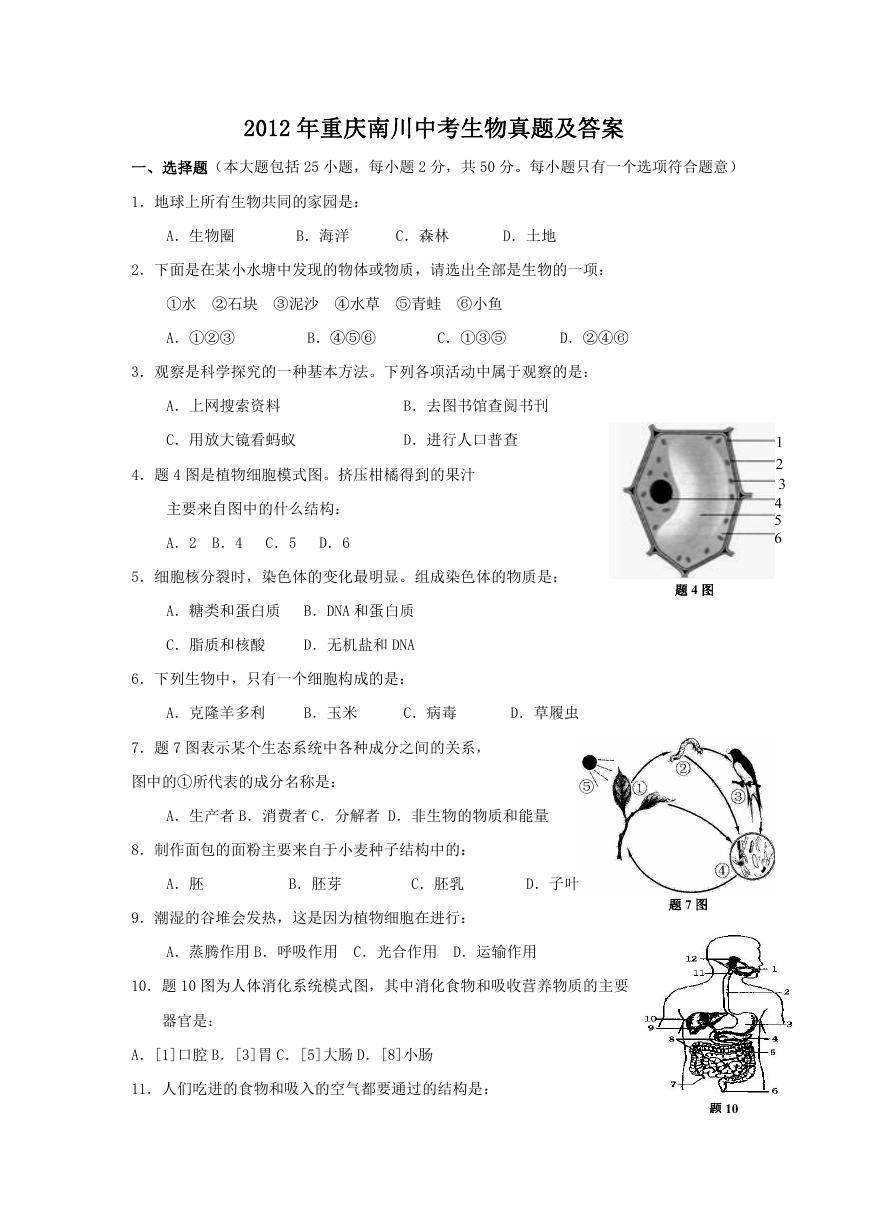 2012年重庆南川中考生物真题及答案.doc
 2013年江西师范大学地理学综合及文艺理论基础考研真题.doc
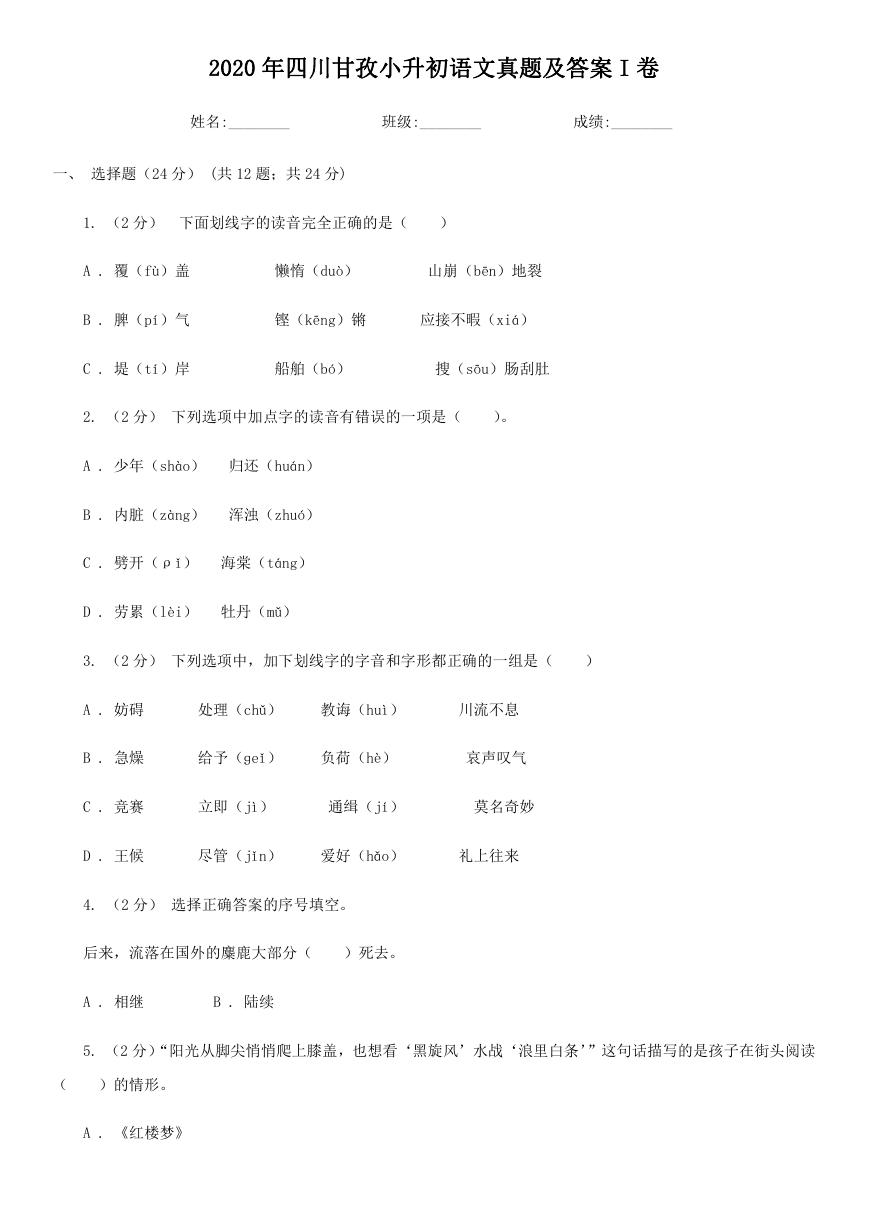 2020年四川甘孜小升初语文真题及答案I卷.doc
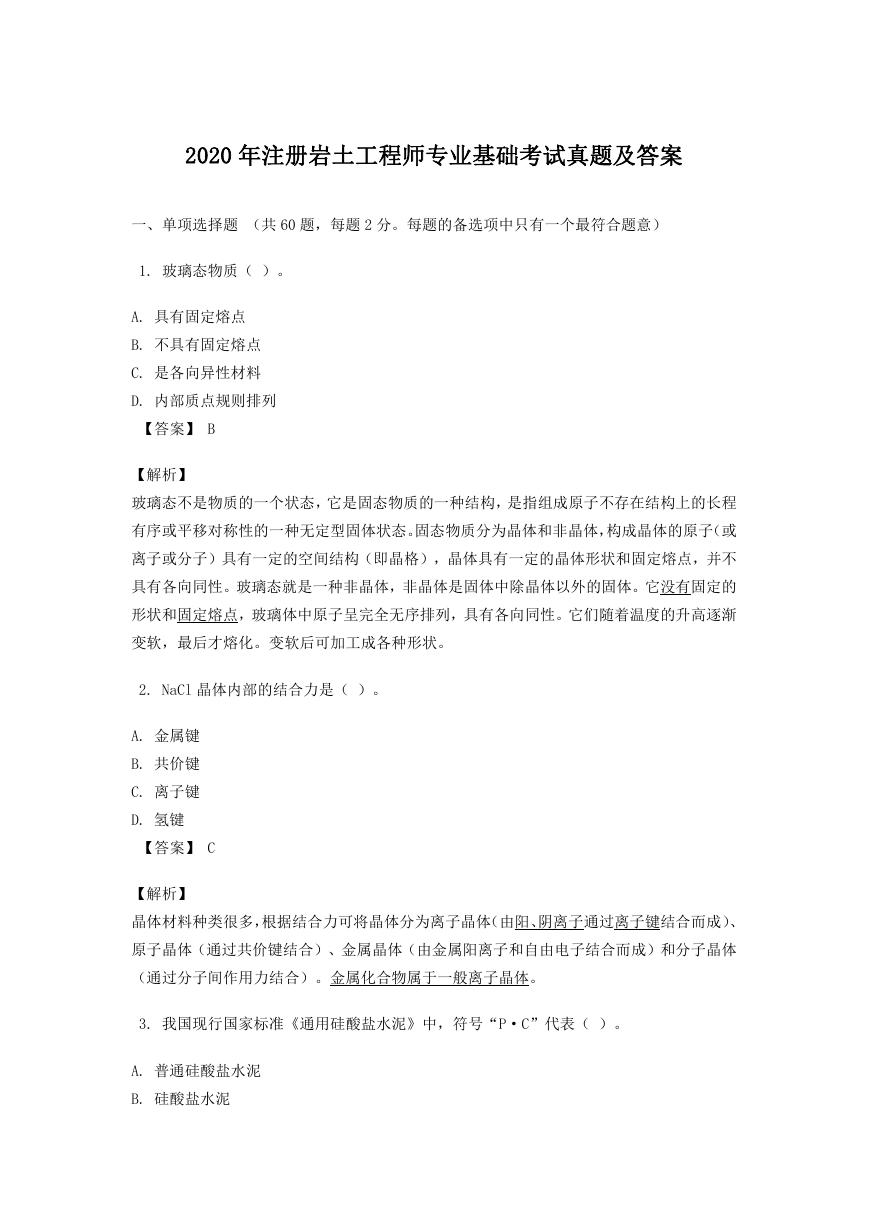 2020年注册岩土工程师专业基础考试真题及答案.doc
 2023-2024学年福建省厦门市九年级上学期数学月考试题及答案.doc
 2021-2022学年辽宁省沈阳市大东区九年级上学期语文期末试题及答案.doc
 2022-2023学年北京东城区初三第一学期物理期末试卷及答案.doc
 2018上半年江西教师资格初中地理学科知识与教学能力真题及答案.doc
 2012年河北国家公务员申论考试真题及答案-省级.doc
 2020-2021学年江苏省扬州市江都区邵樊片九年级上学期数学第一次质量检测试题及答案.doc
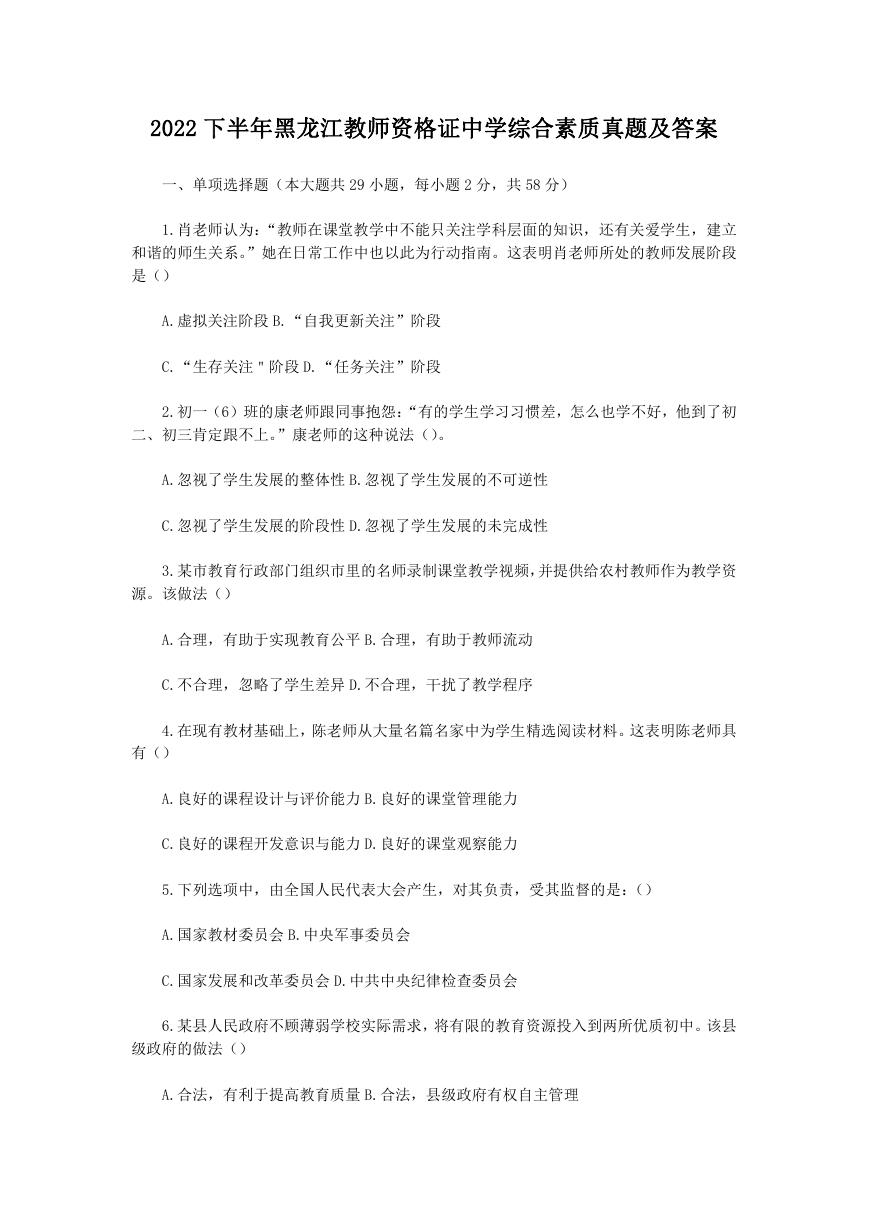 2022下半年黑龙江教师资格证中学综合素质真题及答案.doc