POMR-720001
book
ISBN : 9781891121524
January 19, 2010
21:50
1
The Radar Range Equation
C H A P T E R
2
'
James A. Scheer
$
Chapter Outline
1
Introduction . . . . . . . . . . . . . . . . . . . . . . . . . . . . . . . . . . . . . . . . . . . . . . . . . . . . . . . . . . . . . . . . . . . . . .
2.1
3
Power Density at a Distance R . . . . . . . . . . . . . . . . . . . . . . . . . . . . . . . . . . . . . . . . . . . . . . . . . . .
2.2
4
Received Power from a Target . . . . . . . . . . . . . . . . . . . . . . . . . . . . . . . . . . . . . . . . . . . . . . . . . . . .
2.3
6
Receiver Thermal Noise . . . . . . . . . . . . . . . . . . . . . . . . . . . . . . . . . . . . . . . . . . . . . . . . . . . . . . . . . .
2.4
8
2.5
Signal-to-Noise Ratio and the Radar Range Equation. . . . . . . . . . . . . . . . . . . . . . . . . . . . .
8
2.6 Multiple-Pulse Effects . . . . . . . . . . . . . . . . . . . . . . . . . . . . . . . . . . . . . . . . . . . . . . . . . . . . . . . . . . . .
Summary of Losses . . . . . . . . . . . . . . . . . . . . . . . . . . . . . . . . . . . . . . . . . . . . . . . . . . . . . . . . . . . . . .
2.7
9
Solving for Other Variables . . . . . . . . . . . . . . . . . . . . . . . . . . . . . . . . . . . . . . . . . . . . . . . . . . . . . . . 14
2.8
2.9
Decibel Form of the Radar Range Equation. . . . . . . . . . . . . . . . . . . . . . . . . . . . . . . . . . . . . . . 15
2.10 Average Power Form of the Radar Range Equation . . . . . . . . . . . . . . . . . . . . . . . . . . . . . . . 15
2.11 Pulse Compression: Intrapulse Modulation . . . . . . . . . . . . . . . . . . . . . . . . . . . . . . . . . . . . . . . 16
2.12 A Graphical Example . . . . . . . . . . . . . . . . . . . . . . . . . . . . . . . . . . . . . . . . . . . . . . . . . . . . . . . . . . . . . 17
2.13 Clutter as the Target. . . . . . . . . . . . . . . . . . . . . . . . . . . . . . . . . . . . . . . . . . . . . . . . . . . . . . . . . . . . . . 18
2.14 One-Way Link Equation . . . . . . . . . . . . . . . . . . . . . . . . . . . . . . . . . . . . . . . . . . . . . . . . . . . . . . . . . . 20
2.15 Search Form of the Radar Range Equation . . . . . . . . . . . . . . . . . . . . . . . . . . . . . . . . . . . . . . . 21
2.16 Track Form of the Radar Range Equation. . . . . . . . . . . . . . . . . . . . . . . . . . . . . . . . . . . . . . . . . 22
2.17 Some Implications of the Radar Range Equation . . . . . . . . . . . . . . . . . . . . . . . . . . . . . . . . . 25
2.18 Further Reading . . . . . . . . . . . . . . . . . . . . . . . . . . . . . . . . . . . . . . . . . . . . . . . . . . . . . . . . . . . . . . . . . . 26
2.19 References. . . . . . . . . . . . . . . . . . . . . . . . . . . . . . . . . . . . . . . . . . . . . . . . . . . . . . . . . . . . . . . . . . . . . . . 26
2.20 Problems . . . . . . . . . . . . . . . . . . . . . . . . . . . . . . . . . . . . . . . . . . . . . . . . . . . . . . . . . . . . . . . . . . . . . . . . 27
&
%
2.1
INTRODUCTION
As introduced in Chapter 1, the three fundamental functions of radar systems are to search
for targets, to find targets, and in some cases to develop an image of the target. In all of these
functions the radar performance is influenced by the strength of the signal coming into
the radar receiver from the target of interest and by the strength of the signals that interfere
with the target signal. In the special case of receiver thermal noise being the interfering
signal, the ratio is called the signal-to-noise ratio (SNR), and if the interference is from a
clutter signal, then the ratio is called signal-to-clutter ratio (SCR). The ratio of the target
signal to the total interfering signal is the signal-to-interference ratio (SIR). A signal is
1
�
POMR-720001
book
ISBN : 9781891121524
January 19, 2010
21:50
2
2
C H A P T E R 2
The Radar Range Equation
never composed of target alone. There is always some noise in addition to the target signal.
The radar performance depends on the target-plus-noise to noise ratio.
In the search mode, the radar system is programmed to reposition the antenna beam
in a given sequence to “look” at each possible position in space for a target. If the signal-
plus-noise at any spatial position exceeds the interference by sufficient margin, then a
detection is made, and a target is deemed to be at that position. In this sense, detection
is a process by which, for every possible position for a target, the signal (plus noise)
is compared with some threshold level to determine if the signal is large enough to be
deemed a target of interest. The probability that a target will be detected is dependent
on the probability density function (PDF) of the interfering signals, the SIR, the target
fluctuation characteristics, and the threshold level to which the signal is compared, which
depends on the desired probability of false alarm, PFA. The detection process is discussed
in more detail in Chapters 3 and 15, and special processing techniques designed to perform
the detection process automatically are discussed in Chapter 16.
In the tracking mode, the accuracy or precision with which a target is tracked also
depends on the SIR. The higher the SIR, the more accurate and precise the track will be.
Chapter 19 describes the tracking process and the relationship between tracking precision
and the SIR.
In the imaging mode, the SIR determines the fidelity of the image. It determines the
dynamic range of the image—the ratio between the “brightest” spots and the dimmest on
the target. The SIR also determines to what extent false scatterers are seen in the target
image.
The tool the radar system designer or analyst uses to compute the SIR is the radar
range equation (RRE). A relatively simple formula, or a family of formulas, predicts the
received power of the radar’s radio waves “reflected”1 from a target and the interfering
noise power level and, when these are combined, the SNR. In addition, it can be used to
calculate the power received from surface and volumetric clutter, which, depending on
the radar application, can be considered to be a target or an interfering signal. When the
system application calls for detection of the clutter, the clutter signal becomes the target.
When the clutter signal is deemed to be an interfering signal, then the SIR is determined
by dividing the target signal by the clutter signal. Intentional or unintentional signals
from a source of electromagnetic (EM) energy remote from the radar can also constitute
an interfering signal. A noise jammer, for example, will introduce noise into the radar
receiver through the antenna. The resulting SNR is the target signal power divided by
the sum of the noise contributions, including receiver thermal noise and jammer noise. If
the jammer is a false target jammer, then the SIR is found by dividing the target signal
received by the jammer power received. Communications signals and other sources of
EM energy can also interfere with the signal. These remotely generated sources of EM
energy are analyzed using one-way analysis of the propagating signal. The one-way link
equation can determine the received signal resulting from a jammer, a beacon transponder,
or a communications system.
This chapter includes a discussion of several forms of the radar range equation, in-
cluding those most often used in predicting radar performance. It begins with forecasting
1Chapter 6 shows that the signal illuminating a target induces currents on the target and that the target
reradiates these electromagnetic fields, some of which are directed toward the illuminating source. For
simplicity, this process is often termed reflection.
�
POMR-720001
book
ISBN : 9781891121524
January 19, 2010
21:50
3
2.2
Power Density at a Distance R
3
the power density at a distance R and extends to the two-way case for monostatic radar for
targets, surface clutter, and volumetric clutter. Then radar receiver thermal noise power
is determined, providing the SNR. Equivalent but specialized forms of the RRE are de-
veloped for a search radar and then for a tracking radar. Initially, an idealized approach
is presented, limiting the introduction of terms to the ideal radar parameters. After the
basic RRE is derived, nonideal effects are introduced. Specifically, the component, prop-
agation, and signal processing losses are introduced, providing a more realistic value for
the received target signal power.
2.2 POWER DENSITY AT A DISTANCE R
Although the radar range equation is not formally derived here from first principles, it
is informative to develop the equation in several steps. The total peak power (watts)
developed by the radar transmitter, Pt, is applied to the antenna system. If the antenna had
an isotropic or omnidirectional radiation pattern, the power density Qi (watts per square
meter) at a distance R (meters) from the radiating antenna would be the total power divided
by the surface area of a sphere of radius R,
Qi = Pt
4π R2
(2.1)
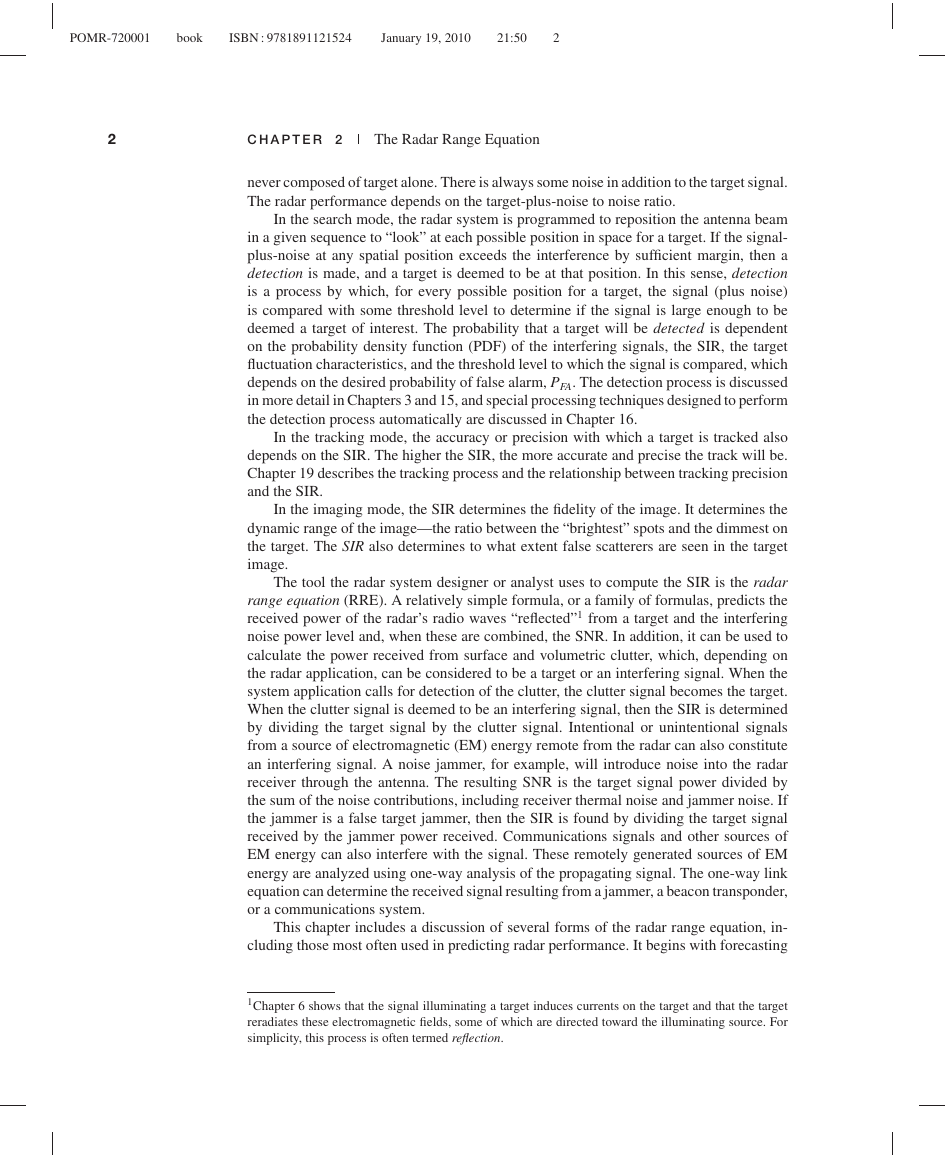
as depicted in Figure 2-1.
Essentially all radar systems use an antenna that has a directional beam pattern rather
than an isotropic beam pattern. This means that the transmitted power is concentrated into
a finite angular extent, usually having a width of several degrees in both the azimuthal and
elevation planes. In this case, the power density at the center of the antenna beam pattern is
higher than that from an isotropic antenna, because the transmit power is concentrated onto
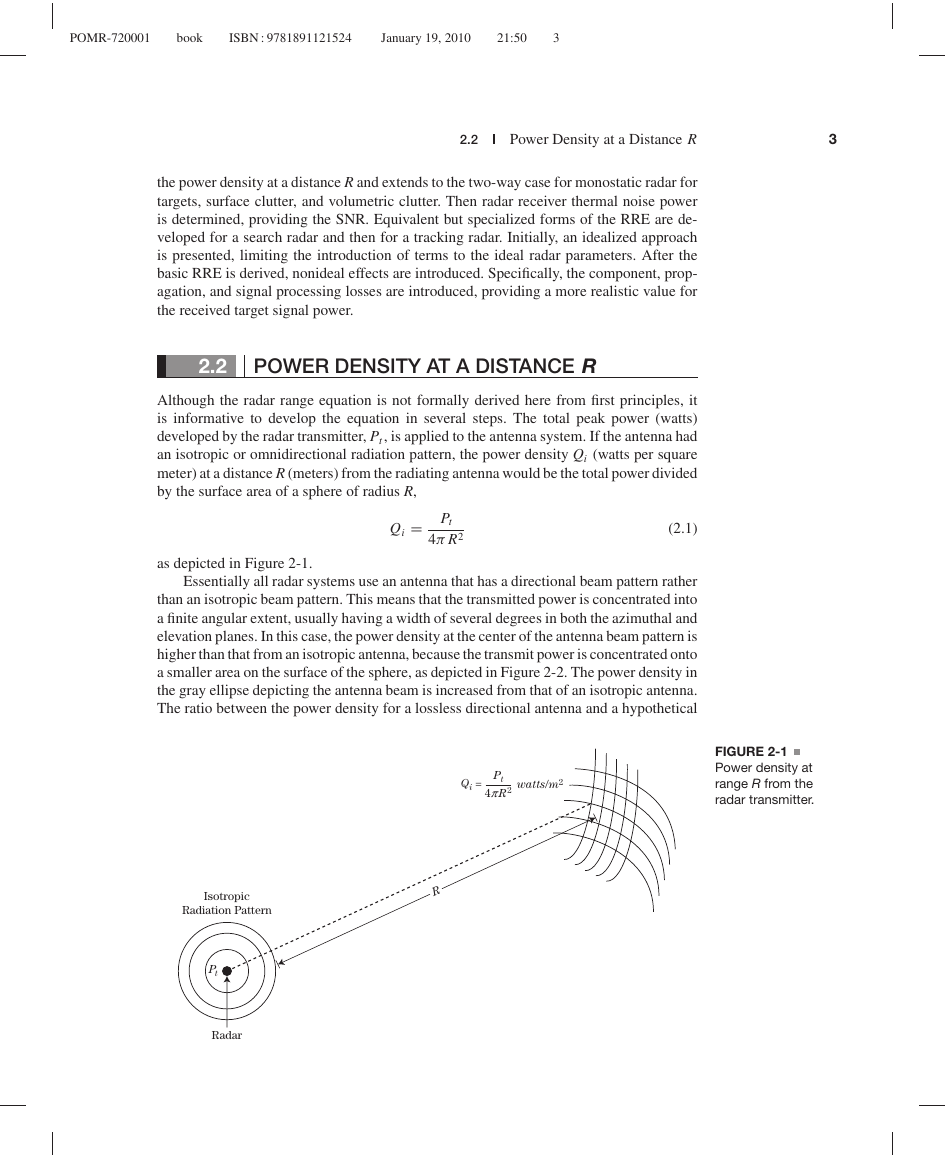
a smaller area on the surface of the sphere, as depicted in Figure 2-2. The power density in
the gray ellipse depicting the antenna beam is increased from that of an isotropic antenna.
The ratio between the power density for a lossless directional antenna and a hypothetical
Qi =
Pt watts/m2
4p R2
FIGURE 2-1
Power density at
range R from the
radar transmitter.
Isotropic
Radiation Pattern
R
Pt
Radar
�
POMR-720001
book
ISBN : 9781891121524
January 19, 2010
21:50
4
4
C H A P T E R 2
The Radar Range Equation
FIGURE 2-2
Power density at
range R given
transmit antenna
gain Gt.
Qi =
PtG
4p R 2
watts/m2
Directional Radiation Pattern
R
G
Pt
Radar
isotropic antenna is termed the directivity. The gain, G, of an antenna is the directivity
reduced by the losses the signal encounters as it travels from the input port to the point at
which it is “launched” into the atmosphere [1]. The subscript t is used to denote a transmit
antenna, so the transmit antenna gain is Gt. Given the increased power density due to use
of a directional antenna,
Qi = Pt Gt
4π R2
(2.2)
2.3 RECEIVED POWER FROM A TARGET
Next, consider a radar “target” at range R, illuminated by the signal from a radiating
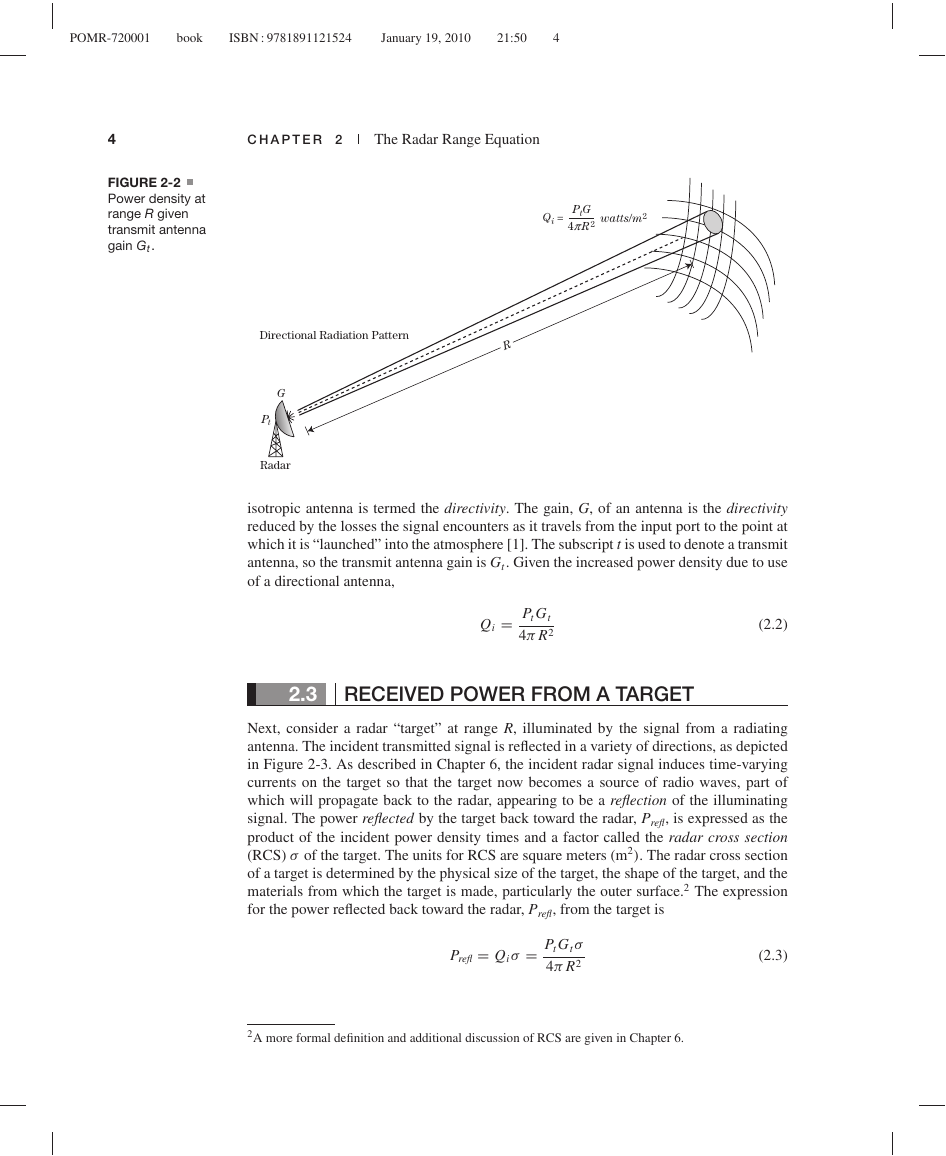
antenna. The incident transmitted signal is reflected in a variety of directions, as depicted
in Figure 2-3. As described in Chapter 6, the incident radar signal induces time-varying
currents on the target so that the target now becomes a source of radio waves, part of
which will propagate back to the radar, appearing to be a reflection of the illuminating
signal. The power reflected by the target back toward the radar, Prefl, is expressed as the
product of the incident power density times and a factor called the radar cross section
(RCS) σ of the target. The units for RCS are square meters (m2). The radar cross section
of a target is determined by the physical size of the target, the shape of the target, and the
materials from which the target is made, particularly the outer surface.2 The expression
for the power reflected back toward the radar, Prefl, from the target is
Prefl = Qi σ = Pt Gt σ
4π R2
(2.3)
2A more formal definition and additional discussion of RCS are given in Chapter 6.
�
POMR-720001
book
ISBN : 9781891121524
January 19, 2010
21:50
5
2.3
Received Power from a Target
5
s
FIGURE 2-3
Power density, Qr ,
back at the radar
receive antenna.
R
Ae
Pt
Radar
The signal reflected from the target propagates back toward the radar system over a distance
R so that the power density back at the radar receiver antenna Qr is
Qr = Prefl
4π R2
(2.4)
Combining equations (2.3) and (2.4), the power density of the radio wave received back
at the radar receive antenna is given by
Qr = Qt σ
4π R2
= Pt Gt σ
(4π )2 R4
(2.5)
Notice that the radar-target range R appears in the denominator raised to the fourth power.
As an example of its significance, if the range from the radar to the target doubles, the re-
ceived power density of the reflected signal from a target decreases by a factor of 16 (12 dB).
The radar wave reflected from the target, which has propagated through a distance
R and results in the power density given by equation (2.5), is received (gathered) by a
radar receive antenna having an effective antenna area of Ae. The power received, S, from
a target at range R at a receiving antenna of effective area of Ae is found from the power
density at the antenna times the effective area of the antenna:
S = Qr Ae = Pt Gt Aeσ
(4π )2 R4
(2.6)
It is customary to replace the effective antenna area term Ae with the value of receive
antenna gain Gr that is produced by that area. Also, as described in Chapter 9, because of
the effects of tapering and losses, the effective area of an antenna is somewhat less than
the physical area, A. As discussed in Chapter 9, as well as in many standard antenna texts,
such as [1], the relationship between an antenna gain G and its effective area Ae is given by
G = 4π ηa A
λ2
= 4π Ae
λ2
(2.7)
�
POMR-720001
book
ISBN : 9781891121524
January 19, 2010
21:50
6
6
C H A P T E R 2
The Radar Range Equation
where ηa is the antenna efficiency. Antenna efficiency is a value between 0 and 1; however,
it is seldom below 0.5 and seldom above 0.8.
Solving (2.7) for Ae and substituting into equation (2.6), the following expression for
the received power results in
S = Pt Gt Gr λ2σ
(4π )3 R4
(2.8)
where
Pt is the peak transmitted power in watts.
Gt is the gain of the transmit antenna.
Gr is the gain of the receive antenna.
λ is the carrier wavelength in meters.
σ is the mean3 RCS of the target in square meters.
R is the range from the radar to the target in meters.
This form is found in many existing standard radar texts, including [2–6].
For many monostatic radar systems, particularly those using mechanically scanned
antennas, the transmit and receive antennas gains are the same, so in those cases the two
gain terms in (2.8) are replaced by G2. However, for bistatic systems and in many modern
radar systems, particularly those that employ electronically scanned antennas, the two
gains are generally different, in which case the preferred form of the radar range equation
is that shown in (2.8), allowing for different values for transmit and receive gain.
For a bistatic radar, one for which the receive antenna is not colocated with the transmit
antenna, the range between the transmitter and target, Rt, may be different from the range
between the target and the receiver, Rr . In this case, the two different range values must
be independently specified, leading to the bistatic form of the equation
S = Pt Gt Gr λ2σbistatic
(4π )2 R2
t R2
r
(2.9)
Though in the following discussions the monostatic form of the radar equation is described,
a similar bistatic form can be developed by separating the range terms and using the bistatic
radar cross section, σ bistatic, of the target.
2.4 RECEIVER THERMAL NOISE
In the ideal case, the received target signal, which usually has a very small amplitude,
could be amplified by some arbitrarily large amount until it could be visible on a display
or within the dynamic range of an analog-to-digital converter (ADC). Unfortunately, as
discussed in Chapter 1 and in the introduction to this chapter, there is always an interfering
signal described as having a randomly varying amplitude and phase, called noise, which
is produced by several sources. As discussed in Chapter 1, random noise can be found
3The target RCS is normally a fluctuating value, so the mean value is usually used to represent the RCS.
The radar equation therefore predicts a mean, or average, value of SNR, since the received power likewise
varies.
�
POMR-720001
book
ISBN : 9781891121524
January 19, 2010
21:50
7
2.4
Receiver Thermal Noise
7
in the environment, mostly due to solar effects. Noise entering the antenna comes from
several sources. Cosmic noise, or galactic noise, originates in outer space. It is a significant
contributor to the total noise at frequencies below about 1 GHz but is a minor contributor
above 1 GHz. Solar noise is from the sun. Its proximity makes it a significant contributor;
however, its effect is reduced by the antenna sidelobe gain, unless the antenna main beam
is pointed directly toward the sun. Even the ground is a source of noise, but not as high a
level as the sun, and usually enters the receiver through antenna sidelobes.
In addition to antenna noise, thermally agitated random electron motion in the receiver
circuits generates a level of random noise with which the target signal must compete.
Though there are several sources of noise, the development of the radar range equation
in this chapter will assume that the internal noise in the receiver dominates the noise
level. This section presents the expected noise power due to the active circuits in the radar
receiver. For target detection to occur, the target signal must exceed the noise signal and,
depending on the statistical nature of the target, sometimes by a significant margin before
the target can be detected with a high probability.
Thermal noise power is essentially uniformly distributed over all radar frequencies;
that is, its power spectral density is constant, or uniform. It is sometimes called “white”
noise. Therefore, only noise signals with frequencies within the range of frequencies
capable of being detected by the radar’s receiver will have any effect on radar performance.
The range of frequencies for which the radar is susceptible to noise signals is determined by
the receiver bandwidth, B. The thermal noise power adversely affecting radar performance
will therefore be proportional to B. The noise figure, F, is a measure of the additional noise
introduced by the receiver, as described in the following section. The power, Pn, of the
thermal noise in the radar receiver is given by [4]
Pn = kTS B = kTO (F − 1)B
(2.10)
where
k is Boltzmann’s constant (1.38 × 10
−23 watt-sec/
◦
K).
◦
T0 is the standard temperature (290
K).
Ts is the system noise temperature (Ts = T0(F – 1)).
B is the instantaneous receiver bandwidth in Hz.
F is the noise figure of the receiver subsystem (unitless).
The noise figure is an alternate method to describe the receiver noise to system tem-
perature, T s. It is important to note that noise figure is often given in dB; however, it must
be converted to linear units for use in equation (2.10).
As can be seen from (2.10), the noise power is linearly proportional to receiver band-
width. However, the receiver bandwidth cannot be made arbitrarily small to reduce noise
power without adversely affecting the target signal. As will be shown in Chapters 8 and
11, for a simple unmodulated transmit signal, the bandwidth of the target’s signal in one
received pulse is approximated by the reciprocal of the pulse width, τ (i.e., B ≈ 1/τ ). If
the receiver bandwidth is made smaller than the target signal bandwidth, the target power
is reduced, and range resolution suffers. If the receiver bandwidth is made larger than the
reciprocal of the pulse length, then the signal to noise ratio will suffer. The true optimum
bandwidth depends on the specific shape of the receiver filter characteristics. In practice,
the optimum bandwidth is usually on the order of 1.2/τ , but the approximation of 1/τ is
very often used.
�
POMR-720001
book
ISBN : 9781891121524
January 19, 2010
21:50
8
8
C H A P T E R 2
The Radar Range Equation
2.5
SIGNAL-TO-NOISE RATIO AND THE RADAR
RANGE EQUATION
When the target signal power, S, is divided by the noise power, Pn, the result is called the
signal-to-noise ratio.
The ratio of the signal power to the noise power is S/Pn. For a discrete target, this is
the ratio of equation (2.8) to (2.10):
SNR =
Pt Gt Gr λ2σ
(4π )3 R4kT0(F − 1)B
(2.11)
Ultimately, the signal-to-interference ratio is what determines radar performance. The in-
terference can be from noise (receiver or jamming) or from clutter or other electromagnetic
interference from, for example, motors, generators, ignitions, or cell services. If the power
of the receiver thermal noise is N , from clutter is C, and from jamming noise is J , then
the SIR is
SIR =
S
N + C + J
(2.12)
Although one of these interference sources usually dominates, reducing the SIR to the
signal power divided by the dominant interference power, S/N, S/C, or S/J, a complete
calculation must be made in each case to see if this simplification applies.
2.6 MULTIPLE-PULSE EFFECTS
Seldom is a radar system required to detect a target on the basis of a single transmit-
ted pulse. Usually, several pulses are transmitted with the antenna beam pointed in the
direction of the (supposed) target. The received signals from these pulses are processed
to improve the ability to detect a target in the presence of noise by performing coherent
or noncoherent integration (i.e., averaging; see Chapter 15). Many modern radar systems
perform spectral analysis (i.e., moving target indication [MTI] or Doppler processing) to
improve target detection performance in the presence of clutter. This section describes
the effect of such processing. See Chapter 17 for a more complete description of pulse-
Doppler processing. Note that the Doppler processing is equivalent to coherent integration
insofar as the improvement in SNR is concerned.
Given that the antenna beam has some angular width, as the radar antenna beam scans
in angle it will be pointed at the target for more than the time it takes to transmit and
receive one pulse. Often the antenna beam is pointed in a given azimuth-elevation angular
position, while several (typically on the order of 16 or 20) pulses are transmitted and
received. In this case, the integrated SIR is the important factor in determining SNR. If
coherent integration processing is employed, (i.e., both the amplitude and the phase of the
received signals are used in the processing), the SNR resulting from coherently integrating
N pulses, SNRc(N), is N times the single-pulse SNR, SNR(1):
SNRc(N) = N · SNR(1)
(2.13)
The process of coherent integration per se is to add the received signal vectors from
a sequence of pulses. For a stationary target using a stationary radar, the vectors for a
sequence of pulses would be in line and would add head to tail, as described in [4]. If,
however, the radar or the target were moving, the phase would be rotating, and the addition
of the vectors would result in no larger signal than any one of the original vectors. No
�



 2023年江西萍乡中考道德与法治真题及答案.doc
 2012年重庆南川中考生物真题及答案.doc
 2013年江西师范大学地理学综合及文艺理论基础考研真题.doc
 2020年四川甘孜小升初语文真题及答案I卷.doc
 2020年注册岩土工程师专业基础考试真题及答案.doc
 2023-2024学年福建省厦门市九年级上学期数学月考试题及答案.doc
 2021-2022学年辽宁省沈阳市大东区九年级上学期语文期末试题及答案.doc
 2022-2023学年北京东城区初三第一学期物理期末试卷及答案.doc
 2018上半年江西教师资格初中地理学科知识与教学能力真题及答案.doc
 2012年河北国家公务员申论考试真题及答案-省级.doc
 2020-2021学年江苏省扬州市江都区邵樊片九年级上学期数学第一次质量检测试题及答案.doc
 2022下半年黑龙江教师资格证中学综合素质真题及答案.doc