图像校准
红色部分是与上述实验不一样的地方。
实验背景:matlab
实验内容:将深度图像与彩色图像校准。
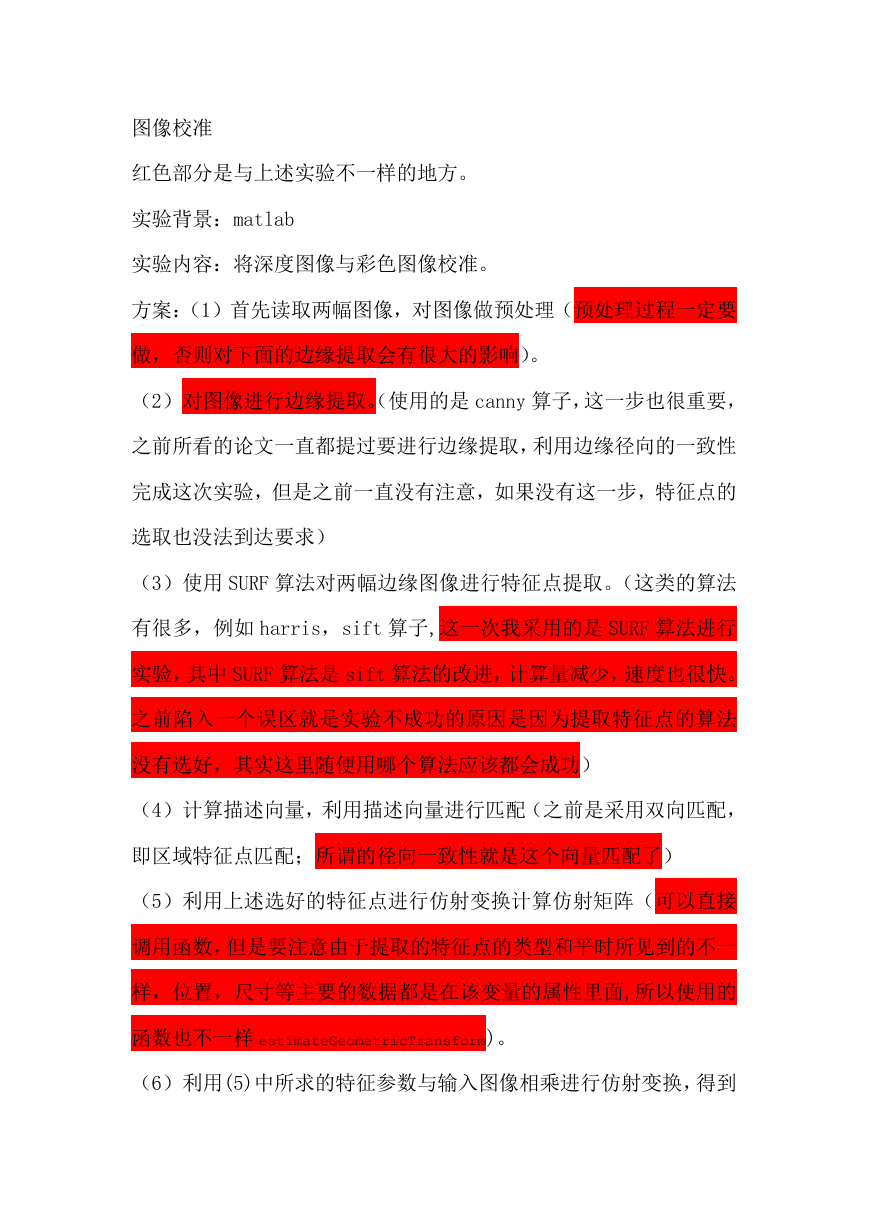
方案:(1)首先读取两幅图像,对图像做预处理(预处理过程一定要
做,否则对下面的边缘提取会有很大的影响)。
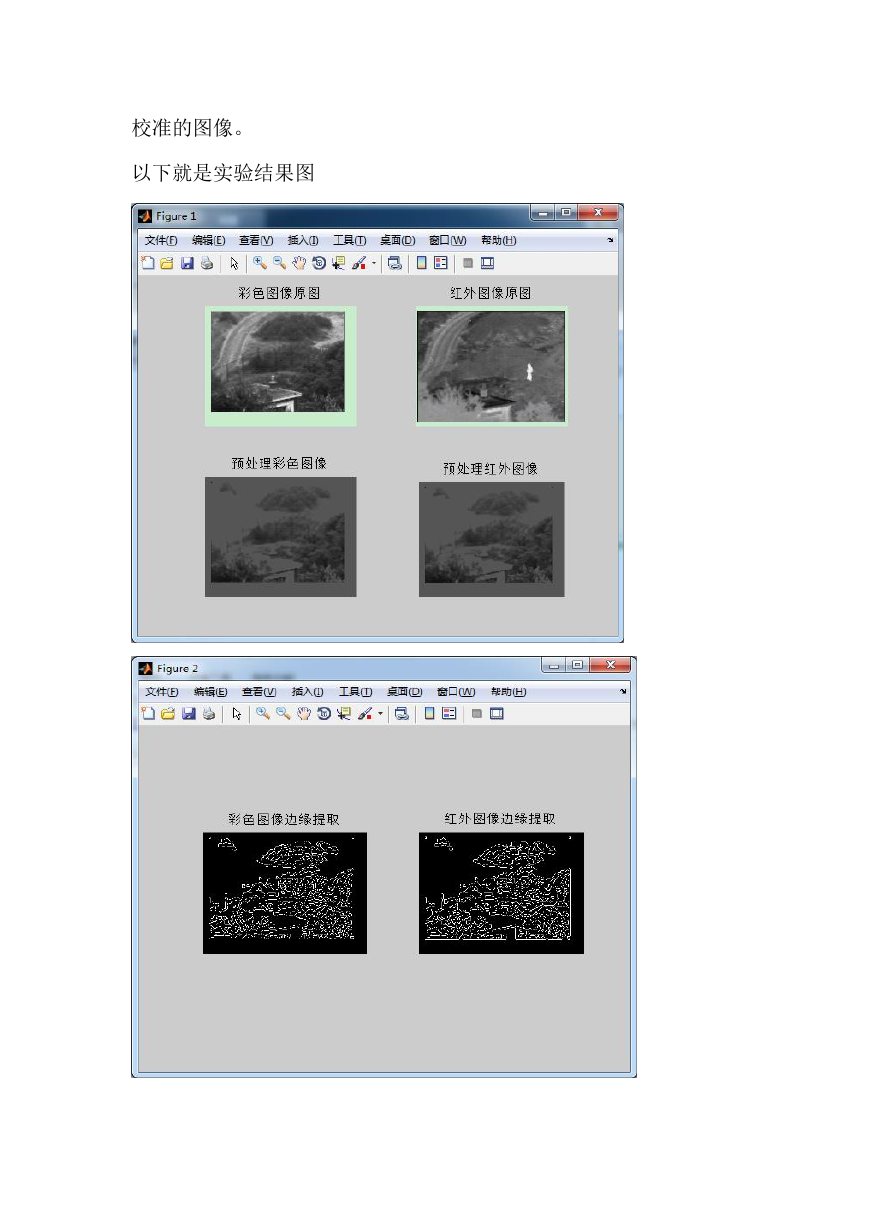
(2)对图像进行边缘提取。(使用的是 canny 算子,这一步也很重要,
之前所看的论文一直都提过要进行边缘提取,利用边缘径向的一致性
完成这次实验,但是之前一直没有注意,如果没有这一步,特征点的
选取也没法到达要求)
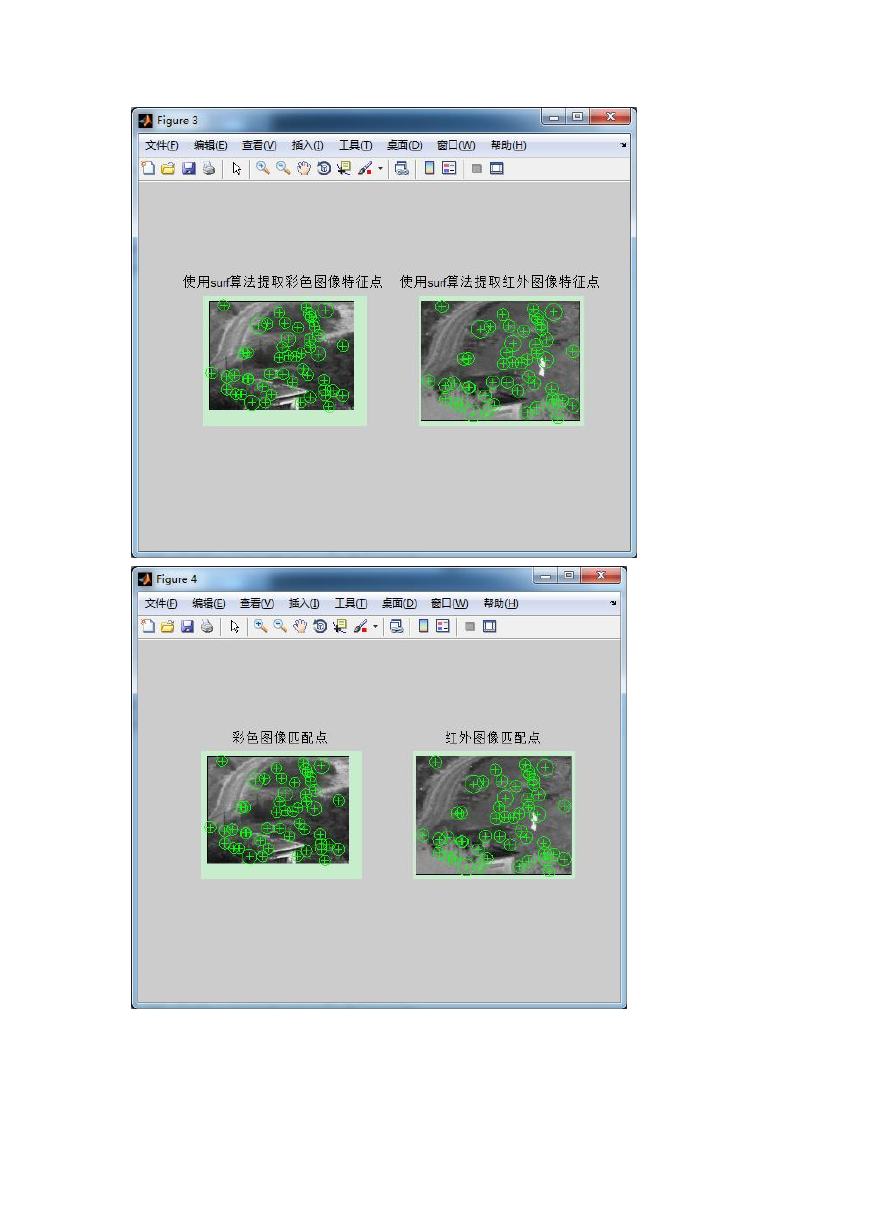
(3)使用 SURF 算法对两幅边缘图像进行特征点提取。(这类的算法
有很多,例如 harris,sift 算子,这一次我采用的是 SURF 算法进行
实验,其中 SURF 算法是 sift 算法的改进,计算量减少,速度也很快。
之前陷入一个误区就是实验不成功的原因是因为提取特征点的算法
没有选好,其实这里随便用哪个算法应该都会成功)
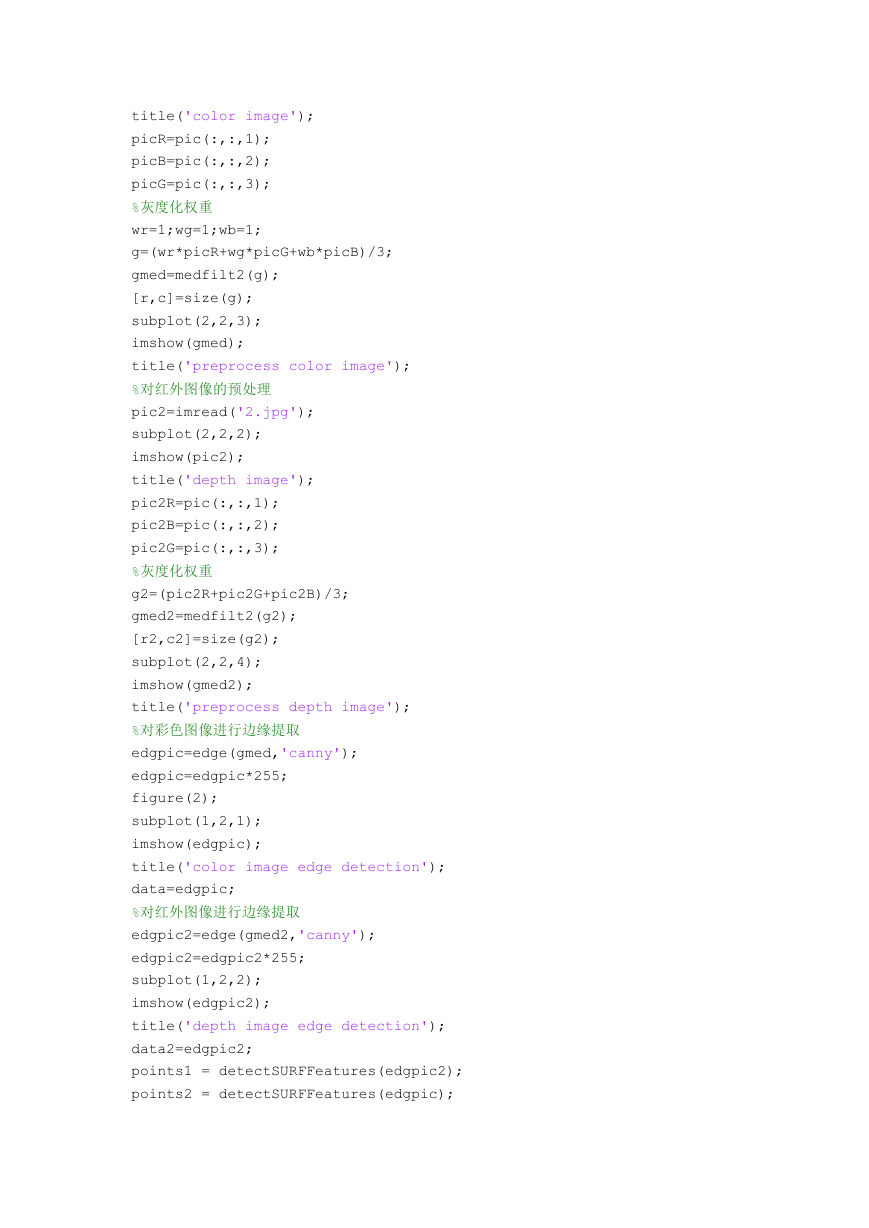
(4)计算描述向量,利用描述向量进行匹配(之前是采用双向匹配,
即区域特征点匹配;所谓的径向一致性就是这个向量匹配了)
(5)利用上述选好的特征点进行仿射变换计算仿射矩阵(可以直接
调用函数,但是要注意由于提取的特征点的类型和平时所见到的不一
样,位置,尺寸等主要的数据都是在该变量的属性里面,所以使用的
函数也不一样 estimateGeometricTransform)。
(6)利用(5)中所求的特征参数与输入图像相乘进行仿射变换,得到
�
校准的图像。
以下就是实验结果图
�
�
%对彩色图像的预处理
clear all;
close all;
clc;
pic=imread('1.jpg');
figure(1);
subplot(2,2,1);
imshow(pic);
�
title('color image');
picR=pic(:,:,1);
picB=pic(:,:,2);
picG=pic(:,:,3);
%灰度化权重
wr=1;wg=1;wb=1;
g=(wr*picR+wg*picG+wb*picB)/3;
gmed=medfilt2(g);
[r,c]=size(g);
subplot(2,2,3);
imshow(gmed);
title('preprocess color image');
%对红外图像的预处理
pic2=imread('2.jpg');
subplot(2,2,2);
imshow(pic2);
title('depth image');
pic2R=pic(:,:,1);
pic2B=pic(:,:,2);
pic2G=pic(:,:,3);
%灰度化权重
g2=(pic2R+pic2G+pic2B)/3;
gmed2=medfilt2(g2);
[r2,c2]=size(g2);
subplot(2,2,4);
imshow(gmed2);
title('preprocess depth image');
%对彩色图像进行边缘提取
edgpic=edge(gmed,'canny');
edgpic=edgpic*255;
figure(2);
subplot(1,2,1);
imshow(edgpic);
title('color image edge detection');
data=edgpic;
%对红外图像进行边缘提取
edgpic2=edge(gmed2,'canny');
edgpic2=edgpic2*255;
subplot(1,2,2);
imshow(edgpic2);
title('depth image edge detection');
data2=edgpic2;
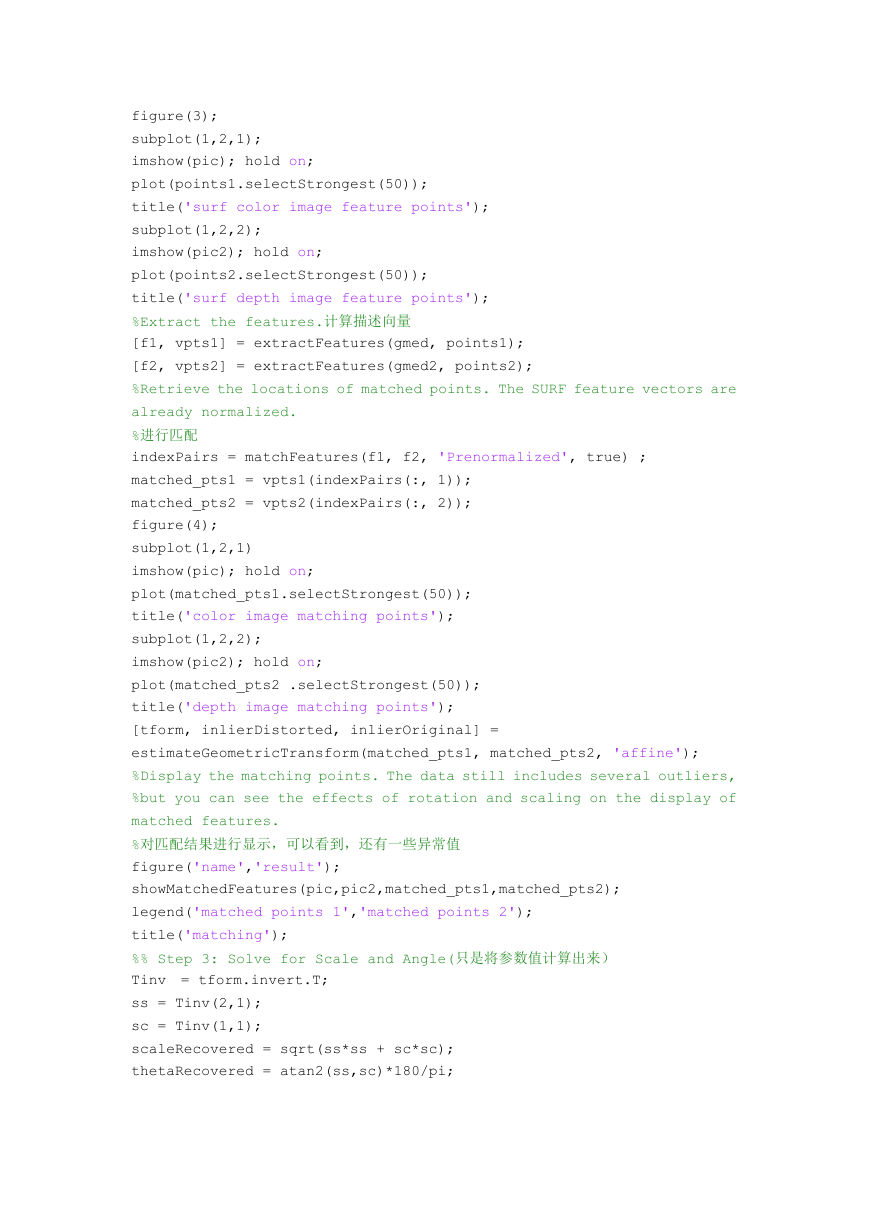
points1 = detectSURFFeatures(edgpic2);
points2 = detectSURFFeatures(edgpic);
�
figure(3);
subplot(1,2,1);
imshow(pic); hold on;
plot(points1.selectStrongest(50));
title('surf color image feature points');
subplot(1,2,2);
imshow(pic2); hold on;
plot(points2.selectStrongest(50));
title('surf depth image feature points');
%Extract the features.计算描述向量
[f1, vpts1] = extractFeatures(gmed, points1);
[f2, vpts2] = extractFeatures(gmed2, points2);
%Retrieve the locations of matched points. The SURF feature vectors are
already normalized.
%进行匹配
indexPairs = matchFeatures(f1, f2, 'Prenormalized', true) ;
matched_pts1 = vpts1(indexPairs(:, 1));
matched_pts2 = vpts2(indexPairs(:, 2));
figure(4);
subplot(1,2,1)
imshow(pic); hold on;
plot(matched_pts1.selectStrongest(50));
title('color image matching points');
subplot(1,2,2);
imshow(pic2); hold on;
plot(matched_pts2 .selectStrongest(50));
title('depth image matching points');
[tform, inlierDistorted, inlierOriginal] =
estimateGeometricTransform(matched_pts1, matched_pts2, 'affine');
%Display the matching points. The data still includes several outliers,
%but you can see the effects of rotation and scaling on the display of
matched features.
%对匹配结果进行显示,可以看到,还有一些异常值
figure('name','result');
showMatchedFeatures(pic,pic2,matched_pts1,matched_pts2);
legend('matched points 1','matched points 2');
title('matching');
%% Step 3: Solve for Scale and Angle(只是将参数值计算出来)
Tinv = tform.invert.T;
ss = Tinv(2,1);
sc = Tinv(1,1);
scaleRecovered = sqrt(ss*ss + sc*sc);
thetaRecovered = atan2(ss,sc)*180/pi;
�
%% Step 4: Recover the original image by transforming the distorted image.
outputView = imref2d(size(pic));
recovered = imwarp(pic2,tform,'OutputView',outputView);
figure(6);
imshow(recovered);
title('calibration image');
�



 2023年江西萍乡中考道德与法治真题及答案.doc
 2012年重庆南川中考生物真题及答案.doc
 2013年江西师范大学地理学综合及文艺理论基础考研真题.doc
 2020年四川甘孜小升初语文真题及答案I卷.doc
 2020年注册岩土工程师专业基础考试真题及答案.doc
 2023-2024学年福建省厦门市九年级上学期数学月考试题及答案.doc
 2021-2022学年辽宁省沈阳市大东区九年级上学期语文期末试题及答案.doc
 2022-2023学年北京东城区初三第一学期物理期末试卷及答案.doc
 2018上半年江西教师资格初中地理学科知识与教学能力真题及答案.doc
 2012年河北国家公务员申论考试真题及答案-省级.doc
 2020-2021学年江苏省扬州市江都区邵樊片九年级上学期数学第一次质量检测试题及答案.doc
 2022下半年黑龙江教师资格证中学综合素质真题及答案.doc