Short-Range FMCW Monopulse Radar for Hand-Gesture Sensing
Pavlo Molchanov, Shalini Gupta, Kihwan Kim, and Kari Pulli
NVIDIA Research, Santa Clara, California, USA
Abstract—Intelligent driver assistance systems have become
important in the automotive industry. One key element of such
systems is a smart user interface that tracks and recognizes
drivers’ hand gestures. Hand gesture sensing using traditional
computer vision techniques is challenging because of wide vari-
ations in lighting conditions, e.g. inside a car. A short-range
radar device can provide additional information, including the
location and instantaneous radial velocity of moving objects. We
describe a novel end-to-end (hardware, interface, and software)
short-range FMCW radar-based system designed to effectively
sense dynamic hand gestures. We provide an effective method
for selecting the parameters of the FMCW waveform and for
jointly calibrating the radar system with a depth sensor. Finally,
we demonstrate that our system guarantees reliable and robust
performance.
I. INTRODUCTION
Hand gestures are a natural form of human communication.
In automobiles, a gesture-based user interface can improve
drivers’ safety. It allows drivers to focus on driving while
interacting with the infotainment or controls (e.g., air con-
ditioning) in the car. A short-range radar sensor can add
extra modalities to gesture tracking/recognition systems. One
of these modalities is the instantaneous radial velocity of the
driver’s moving hand. Advantages of the radar system are (1)
robustness to lighting conditions compared to other sensors,
(2) low computational complexity due to direct detection of
moving objects, and (3) occlusion handling because of the
penetration capability of EM waves.
Prior work in hand gesture recognition primarily used depth
and optical sensors [1]. Optical sensors do not provide accurate
depth estimation, and depth sensors can be unreliable outdoors
where sunlight corrupts their measurements. Technically time-
of-flight (TOF) depth and radar sensors are similar, as they
both measure the delay of the signal traveling to and from
the object. However, radar sensors use lower frequencies,
which allows for the estimation of the phase of the wave and
consequently the Doppler shift. Using radar-like sensors for
gesture sensing has been studied recently [2], [3], [4]. In most
of these works, the hand is modeled as a single rigid object.
However, in reality, it is not and in this work we model the
hand as a non-rigid object. This allows us to perceive the
hand as a multi-scatterer object and to capture its local micro-
motions.
In this work, we describe a novel end-to-end (hardware, in-
terface, and software) short-range radar-based system designed
and prototyped to effectively measure dynamic hand gestures
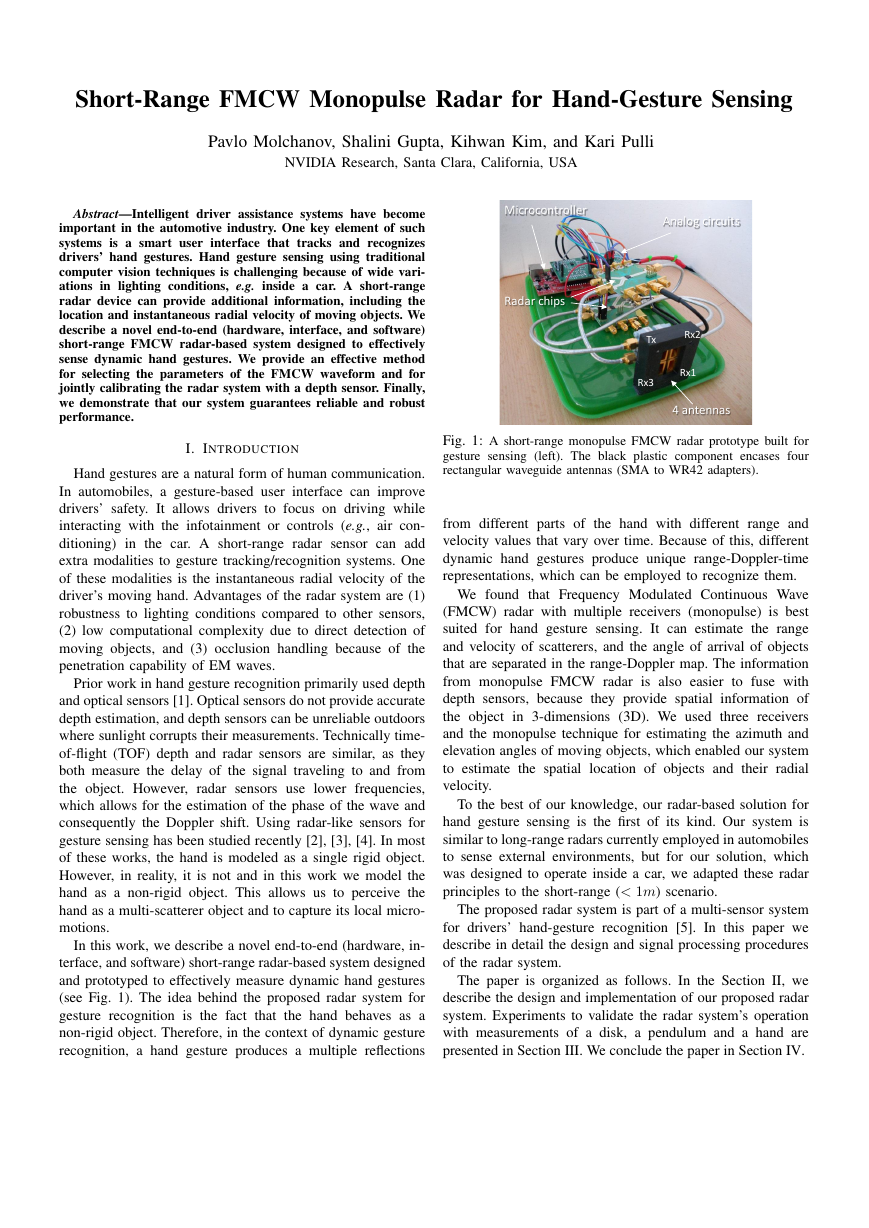
(see Fig. 1). The idea behind the proposed radar system for
gesture recognition is the fact that the hand behaves as a
non-rigid object. Therefore, in the context of dynamic gesture
recognition, a hand gesture produces a multiple reflections
Fig. 1: A short-range monopulse FMCW radar prototype built for
gesture sensing (left). The black plastic component encases four
rectangular waveguide antennas (SMA to WR42 adapters).
from different parts of the hand with different range and
velocity values that vary over time. Because of this, different
dynamic hand gestures produce unique range-Doppler-time
representations, which can be employed to recognize them.
We found that Frequency Modulated Continuous Wave
(FMCW) radar with multiple receivers (monopulse) is best
suited for hand gesture sensing. It can estimate the range
and velocity of scatterers, and the angle of arrival of objects
that are separated in the range-Doppler map. The information
from monopulse FMCW radar is also easier to fuse with
depth sensors, because they provide spatial information of
the object
in 3-dimensions (3D). We used three receivers
and the monopulse technique for estimating the azimuth and
elevation angles of moving objects, which enabled our system
to estimate the spatial location of objects and their radial
velocity.
To the best of our knowledge, our radar-based solution for
hand gesture sensing is the first of its kind. Our system is
similar to long-range radars currently employed in automobiles
to sense external environments, but for our solution, which
was designed to operate inside a car, we adapted these radar
principles to the short-range (< 1m) scenario.
The proposed radar system is part of a multi-sensor system
for drivers’ hand-gesture recognition [5]. In this paper we
describe in detail the design and signal processing procedures
of the radar system.
The paper is organized as follows. In the Section II, we
describe the design and implementation of our proposed radar
system. Experiments to validate the radar system’s operation
with measurements of a disk, a pendulum and a hand are
presented in Section III. We conclude the paper in Section IV.
4 antennas Analog circuits Microcontroller Radar chips Tx Rx1 Rx2 Rx3 �
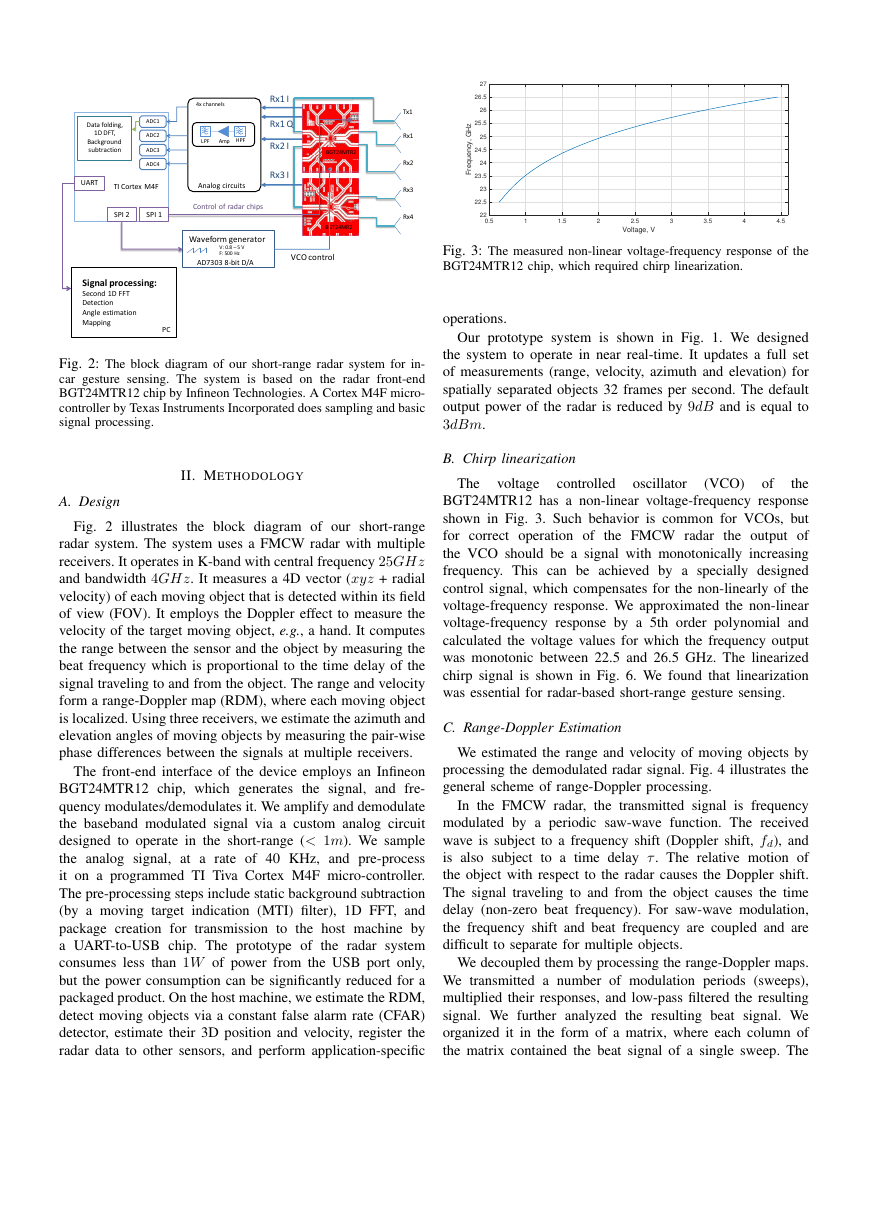
Fig. 2: The block diagram of our short-range radar system for in-
car gesture sensing. The system is based on the radar front-end
BGT24MTR12 chip by Infineon Technologies. A Cortex M4F micro-
controller by Texas Instruments Incorporated does sampling and basic
signal processing.
II. METHODOLOGY
A. Design
Fig. 2 illustrates the block diagram of our short-range
radar system. The system uses a FMCW radar with multiple
receivers. It operates in K-band with central frequency 25GHz
and bandwidth 4GHz. It measures a 4D vector (xyz + radial
velocity) of each moving object that is detected within its field
of view (FOV). It employs the Doppler effect to measure the
velocity of the target moving object, e.g., a hand. It computes
the range between the sensor and the object by measuring the
beat frequency which is proportional to the time delay of the
signal traveling to and from the object. The range and velocity
form a range-Doppler map (RDM), where each moving object
is localized. Using three receivers, we estimate the azimuth and
elevation angles of moving objects by measuring the pair-wise
phase differences between the signals at multiple receivers.
The front-end interface of the device employs an Infineon
BGT24MTR12 chip, which generates the signal, and fre-
quency modulates/demodulates it. We amplify and demodulate
the baseband modulated signal via a custom analog circuit
designed to operate in the short-range (< 1m). We sample
the analog signal, at a rate of 40 KHz, and pre-process
it on a programmed TI Tiva Cortex M4F micro-controller.
The pre-processing steps include static background subtraction
(by a moving target indication (MTI) filter), 1D FFT, and
package creation for transmission to the host machine by
a UART-to-USB chip. The prototype of the radar system
consumes less than 1W of power from the USB port only,
but the power consumption can be significantly reduced for a
packaged product. On the host machine, we estimate the RDM,
detect moving objects via a constant false alarm rate (CFAR)
detector, estimate their 3D position and velocity, register the
radar data to other sensors, and perform application-specific
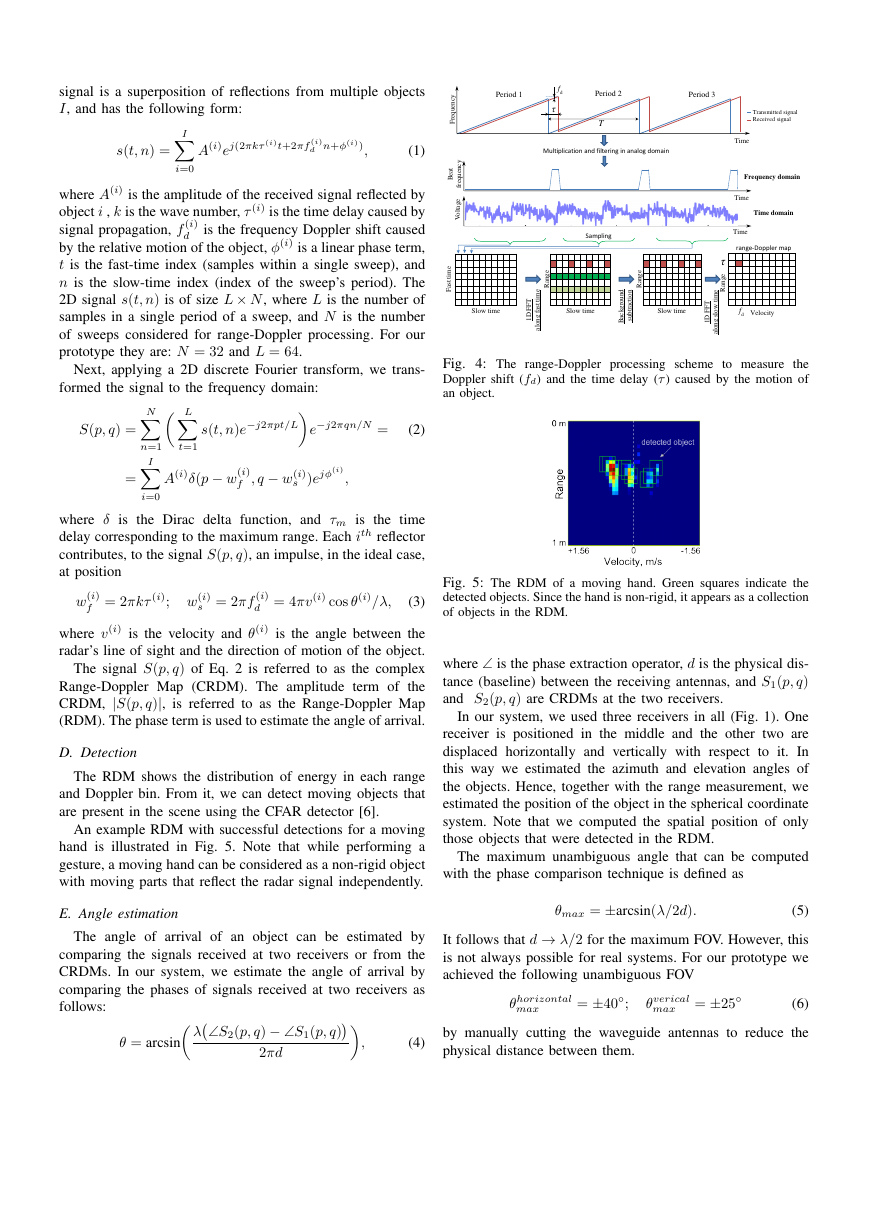
Fig. 3: The measured non-linear voltage-frequency response of the
BGT24MTR12 chip, which required chirp linearization.
operations.
Our prototype system is shown in Fig. 1. We designed
the system to operate in near real-time. It updates a full set
of measurements (range, velocity, azimuth and elevation) for
spatially separated objects 32 frames per second. The default
output power of the radar is reduced by 9dB and is equal to
3dBm.
B. Chirp linearization
(VCO)
of
The
voltage
oscillator
controlled
the
BGT24MTR12 has a non-linear voltage-frequency response
shown in Fig. 3. Such behavior is common for VCOs, but
for correct operation of the FMCW radar the output of
the VCO should be a signal with monotonically increasing
frequency. This can be achieved by a specially designed
control signal, which compensates for the non-linearly of the
voltage-frequency response. We approximated the non-linear
voltage-frequency response by a 5th order polynomial and
calculated the voltage values for which the frequency output
was monotonic between 22.5 and 26.5 GHz. The linearized
chirp signal is shown in Fig. 6. We found that linearization
was essential for radar-based short-range gesture sensing.
C. Range-Doppler Estimation
We estimated the range and velocity of moving objects by
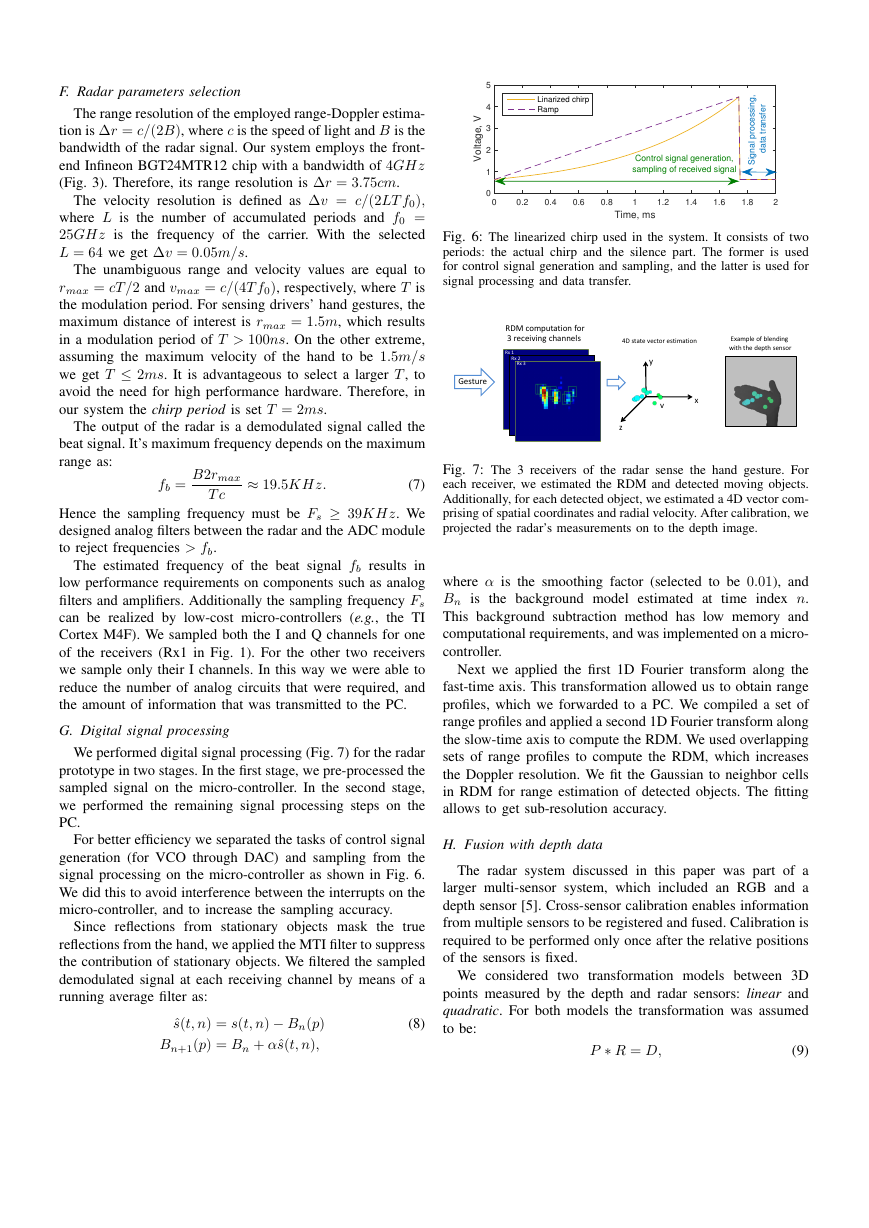
processing the demodulated radar signal. Fig. 4 illustrates the
general scheme of range-Doppler processing.
In the FMCW radar, the transmitted signal is frequency
modulated by a periodic saw-wave function. The received
wave is subject to a frequency shift (Doppler shift, fd), and
is also subject to a time delay τ. The relative motion of
the object with respect to the radar causes the Doppler shift.
The signal traveling to and from the object causes the time
delay (non-zero beat frequency). For saw-wave modulation,
the frequency shift and beat frequency are coupled and are
difficult to separate for multiple objects.
We decoupled them by processing the range-Doppler maps.
We transmitted a number of modulation periods (sweeps),
multiplied their responses, and low-pass filtered the resulting
signal. We further analyzed the resulting beat signal. We
organized it in the form of a matrix, where each column of
the matrix contained the beat signal of a single sweep. The
Rx1 Rx2 Rx3 Rx4 Tx1 4x channels TI Cortex M4F ADC1 ADC2 ADC3 ADC4 Data folding, 1D DFT, Background subtraction PC Signal processing: Second 1D FFT Detection Angle estimation Mapping Waveform generator V: 0.8 – 5 V F: 500 Hz SPI 1 SPI 2 UART AD7303 8-bit D/A Amp LPF HPF Control of radar chips BGT24MTR2 Rx1 I Rx1 Q Rx2 I Rx3 I Analog circuits BGT24MR2 VCO control Voltage, V0.511.522.533.544.5Frequency, GHz2222.52323.52424.52525.52626.527�
I
signal is a superposition of reflections from multiple objects
I, and has the following form:
s(t, n) =
A(i)ej(2πkτ (i)t+2πf (i)
d n+φ(i)),
(1)
i=0
where A(i) is the amplitude of the received signal reflected by
object i , k is the wave number, τ (i) is the time delay caused by
signal propagation, f (i)
is the frequency Doppler shift caused
d
by the relative motion of the object, φ(i) is a linear phase term,
t is the fast-time index (samples within a single sweep), and
n is the slow-time index (index of the sweep’s period). The
2D signal s(t, n) is of size L × N, where L is the number of
samples in a single period of a sweep, and N is the number
of sweeps considered for range-Doppler processing. For our
prototype they are: N = 32 and L = 64.
Next, applying a 2D discrete Fourier transform, we trans-
formed the signal to the frequency domain:
L
N
I
n=1
S(p, q) =
=
s(t, n)e−j2πpt/L
e−j2πqn/N = (2)
t=1
A(i)δ(p − w(i)
f , q − w(i)
s )ejφ(i)
,
i=0
where δ is the Dirac delta function, and τm is the time
delay corresponding to the maximum range. Each ith reflector
contributes, to the signal S(p, q), an impulse, in the ideal case,
at position
w(i)
f = 2πkτ (i); w(i)
s = 2πf (i)
d = 4πv(i) cos θ(i)/λ,
(3)
where v(i) is the velocity and θ(i) is the angle between the
radar’s line of sight and the direction of motion of the object.
The signal S(p, q) of Eq. 2 is referred to as the complex
Range-Doppler Map (CRDM). The amplitude term of the
CRDM, |S(p, q)|, is referred to as the Range-Doppler Map
(RDM). The phase term is used to estimate the angle of arrival.
D. Detection
The RDM shows the distribution of energy in each range
and Doppler bin. From it, we can detect moving objects that
are present in the scene using the CFAR detector [6].
An example RDM with successful detections for a moving
hand is illustrated in Fig. 5. Note that while performing a
gesture, a moving hand can be considered as a non-rigid object
with moving parts that reflect the radar signal independently.
E. Angle estimation
The angle of arrival of an object can be estimated by
comparing the signals received at two receivers or from the
CRDMs. In our system, we estimate the angle of arrival by
comparing the phases of signals received at two receivers as
follows:
λ∠S2(p, q) − ∠S1(p, q)
θ = arcsin
2πd
Fig. 4: The range-Doppler processing scheme to measure the
Doppler shift (fd) and the time delay (τ) caused by the motion of
an object.
Fig. 5: The RDM of a moving hand. Green squares indicate the
detected objects. Since the hand is non-rigid, it appears as a collection
of objects in the RDM.
where ∠ is the phase extraction operator, d is the physical dis-
tance (baseline) between the receiving antennas, and S1(p, q)
and S2(p, q) are CRDMs at the two receivers.
In our system, we used three receivers in all (Fig. 1). One
receiver is positioned in the middle and the other two are
displaced horizontally and vertically with respect to it. In
this way we estimated the azimuth and elevation angles of
the objects. Hence, together with the range measurement, we
estimated the position of the object in the spherical coordinate
system. Note that we computed the spatial position of only
those objects that were detected in the RDM.
The maximum unambiguous angle that can be computed
with the phase comparison technique is defined as
θmax = ±arcsin(λ/2d).
(5)
It follows that d → λ/2 for the maximum FOV. However, this
is not always possible for real systems. For our prototype we
achieved the following unambiguous FOV
θhorizontal
max
= ±40◦;
max = ±25◦
θverical
(6)
,
(4)
by manually cutting the waveguide antennas to reduce the
physical distance between them.
Slow time Fast time Velocity Range 1D FFT along fast time τ f d Frequency T Transmitted signal Received signal Period 1 Period 2 Period 3 τ Time Background subtraction Range Slow time Range Slow time 1D FFT along slow time range-Doppler map Multiplication and filtering in analog domain Beat frequency Time Frequency domain Time domain Time Voltage Sampling f d �
F. Radar parameters selection
The range resolution of the employed range-Doppler estima-
tion is ∆r = c/(2B), where c is the speed of light and B is the
bandwidth of the radar signal. Our system employs the front-
end Infineon BGT24MTR12 chip with a bandwidth of 4GHz
(Fig. 3). Therefore, its range resolution is ∆r = 3.75cm.
The velocity resolution is defined as ∆v = c/(2LT f0),
where L is the number of accumulated periods and f0 =
25GHz is the frequency of the carrier. With the selected
L = 64 we get ∆v = 0.05m/s.
The unambiguous range and velocity values are equal to
rmax = cT /2 and vmax = c/(4T f0), respectively, where T is
the modulation period. For sensing drivers’ hand gestures, the
maximum distance of interest is rmax = 1.5m, which results
in a modulation period of T > 100ns. On the other extreme,
assuming the maximum velocity of the hand to be 1.5m/s
we get T ≤ 2ms. It is advantageous to select a larger T , to
avoid the need for high performance hardware. Therefore, in
our system the chirp period is set T = 2ms.
The output of the radar is a demodulated signal called the
beat signal. It’s maximum frequency depends on the maximum
range as:
B2rmax
≈ 19.5KHz.
T c
fb =
(7)
Hence the sampling frequency must be Fs ≥ 39KHz. We
designed analog filters between the radar and the ADC module
to reject frequencies > fb.
The estimated frequency of the beat signal fb results in
low performance requirements on components such as analog
filters and amplifiers. Additionally the sampling frequency Fs
can be realized by low-cost micro-controllers (e.g., the TI
Cortex M4F). We sampled both the I and Q channels for one
of the receivers (Rx1 in Fig. 1). For the other two receivers
we sample only their I channels. In this way we were able to
reduce the number of analog circuits that were required, and
the amount of information that was transmitted to the PC.
G. Digital signal processing
We performed digital signal processing (Fig. 7) for the radar
prototype in two stages. In the first stage, we pre-processed the
sampled signal on the micro-controller. In the second stage,
we performed the remaining signal processing steps on the
PC.
For better efficiency we separated the tasks of control signal
generation (for VCO through DAC) and sampling from the
signal processing on the micro-controller as shown in Fig. 6.
We did this to avoid interference between the interrupts on the
micro-controller, and to increase the sampling accuracy.
Since reflections from stationary objects mask the true
reflections from the hand, we applied the MTI filter to suppress
the contribution of stationary objects. We filtered the sampled
demodulated signal at each receiving channel by means of a
running average filter as:
ˆs(t, n) = s(t, n) − Bn(p)
Bn+1(p) = Bn + αˆs(t, n),
(8)
Fig. 6: The linearized chirp used in the system. It consists of two
periods: the actual chirp and the silence part. The former is used
for control signal generation and sampling, and the latter is used for
signal processing and data transfer.
Fig. 7: The 3 receivers of the radar sense the hand gesture. For
each receiver, we estimated the RDM and detected moving objects.
Additionally, for each detected object, we estimated a 4D vector com-
prising of spatial coordinates and radial velocity. After calibration, we
projected the radar’s measurements on to the depth image.
where α is the smoothing factor (selected to be 0.01), and
Bn is the background model estimated at
time index n.
This background subtraction method has low memory and
computational requirements, and was implemented on a micro-
controller.
Next we applied the first 1D Fourier transform along the
fast-time axis. This transformation allowed us to obtain range
profiles, which we forwarded to a PC. We compiled a set of
range profiles and applied a second 1D Fourier transform along
the slow-time axis to compute the RDM. We used overlapping
sets of range profiles to compute the RDM, which increases
the Doppler resolution. We fit the Gaussian to neighbor cells
in RDM for range estimation of detected objects. The fitting
allows to get sub-resolution accuracy.
H. Fusion with depth data
The radar system discussed in this paper was part of a
larger multi-sensor system, which included an RGB and a
depth sensor [5]. Cross-sensor calibration enables information
from multiple sensors to be registered and fused. Calibration is
required to be performed only once after the relative positions
of the sensors is fixed.
We considered two transformation models between 3D
points measured by the depth and radar sensors: linear and
quadratic. For both models the transformation was assumed
to be:
P ∗ R = D,
(9)
Time, ms00.20.40.60.811.21.41.61.82Voltage, V012345Signal processing, data transferLinarized chirpRampControl signal generation,sampling of received signalGesture RDM computation for 3 receiving channels 4D state vector estimation x y z v Example of blending with the depth sensor Rx 1 Rx 2 Rx 3 �
Fig. 8: Measurements of the beat frequency for different distances
to a stationary metallic disk of diameter 0.18m.
where D = [Xd Yd Zd]T is a 3D point measured by the
depth sensor and P is a transformation (projection) matrix.
For the linear model, R = [Xr Yr Zr 1]T where the first three
dimensions represent the 3D point measured by the radar and
P is a matrix of coefficients of size 3 × 4. For the quadratic
r 1]T and P is of size 3× 7.
model, R = [Xr Yr Zr X 2
We transformed the measurements of the depth sensor (D)
r Z 2
r Y 2
to world coordinates as:
ˆXd = (Xd − cx) ∗ Zd/fx;
where fx, fy are the focal lengths of the depth camera, and
cx, cy are the co-ordinates of its principal point.
ˆYd = (Yd − cy) ∗ Zd/fy,
(10)
To estimate the matrix P , we concurrently observed the
3D coordinates of the center of a moving spherical ball of
radius 1.5cm with both sensors and estimated the best-fit
transformation between them using the linear least squares
procedure.
In our system, we placed the depth camera above the radar
sensor. We assume the x axis to be along the horizontal
direction, the y axis - vertical, and the z axis - optical axis
of the depth camera. We use a TOF depth camera (DS325,
Softkinetic) with spatial resolution of 320 × 240 pixels, depth
resolution of ≤ 1mm and FOV of 74◦ × 58◦.
III. EXPERIMENTAL RESULTS
In order to evaluate the reliability our system, we performed
the first experiment with a stationary metallic disk of diameter
0.18m. Then, the background’s estimate (Eq. 8) was fixed
for all experiments with the stationary disk. The observed
relationship between the beat frequency and the distance to the
disk is shown in Fig. 8. The strongly linear nature of this rela-
tionship is evidence for the high reliability of our system. The
standard deviation of the distance measurements was 0.6cm.
The on-board micro-controller performed all measurements by
averaging over a period of 2s. This experiments indicates that
our prototype provides reliable measurements of the distance.
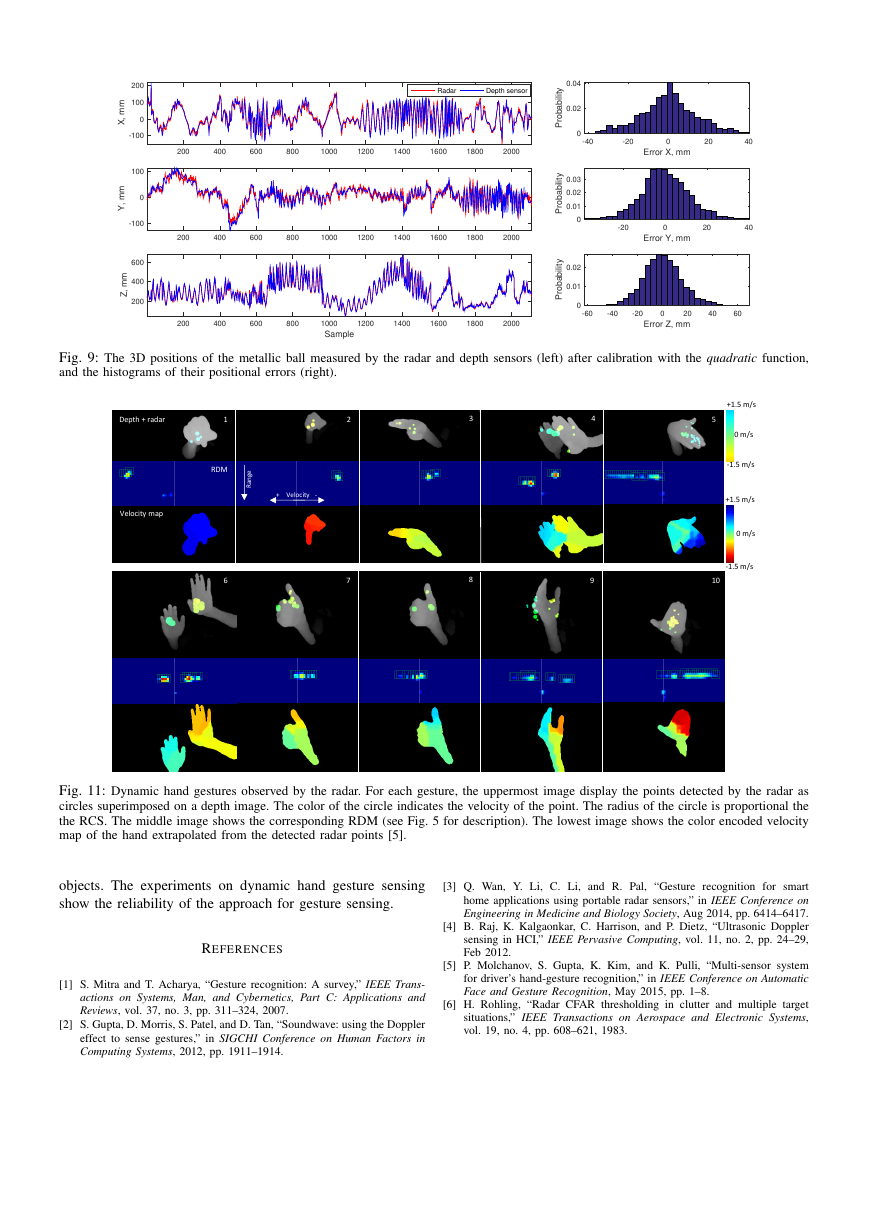
Fig. 9 shows the x, y and z coordinates of the calibration
ball (1.5cm radius) measured by the depth and radar sensors
after cross-sensor calibration with the quadratic function. The
position of the ball measured by the depth camera can be
assumed to be accurate. Overall, the radar is able to follow
the ball’s position, and provides a reasonable estimate of its
spatial location. The histograms of the positional errors are
Fig. 10: The trajectories of the hand tracked by our radar system
for four dynamic motions: drawing numbers 1, 2, 8 and 0. The first
position of the hand is depicted with the smallest dark circle and each
subsequent position is represented by a progressively larger circle
with higher intensity.
also presented in Fig. 9. They closely resemble zero-mean
Gaussian distributions. The standard deviations of errors along
the x, y and z axes were 14.2mm, 11.7mm and 16.2mm,
respectively. The quadratic transformation model resulted in
0.4mm, 0.9mm and 6.5mm lower standard deviations along
the x, y and z axes compared to the linear model.
Figure 11 shows examples of 10 hand gestures observed by
our radar system: 1,2 - fist moving forwards/backwards; 3 -
pointing to the side; 4,6 two moving hands; 5 - hand opening;
7,8 thumb motion forwards/backwards; 9 - hand twisting; 10
- calling. Observe that hand gestures are comprised of several
micro-motions, which are detected by the radar. The radar
estimates the spatial coordinates correctly and even separates
the two hands moving with different velocities. It also correctly
detects the motion of the thumb.
The radar senses the hand as a non-rigid object and hence
reports multiple points for it. The location of these points is not
constant and they can be located anywhere within the hand.
Therefore, the radar system cannot be relied upon to track the
position of the hand very precisely, especially for short ranges,
where the hand occupies a significant portion of the FOV (Fig.
11). To track the hand, we instead employed the median of
the all the points located on the hand detected by the radar.
The results of this tracking methodology are demonstrated in
Fig. 10. Notice that the developed radar system can track the
hand successfully.
IV. CONCLUSIONS
We presented a short-range FMCW mono-pulse radar sys-
tem for hand gesture sensing. The radar system estimates the
range-Doppler map of dynamic gestures together with the 3D
position of the detected hand at 32 FPS. The built prototype
radar system successfully measures range and bi-directional
radial velocity. The radar estimates the spatial coordinates
with a coverage of ±450 and ±300 in the horizontal and
vertical directions, respectively. We developed a procedure to
jointly calibrate the radar system with a depth sensor. Results
of tracking a metallic ball target demonstrate that the radar
system is capable of correctly measuring the 3D location of
Distance, m00.10.20.30.40.50.60.70.8Frequency, Hz×1040.60.811.21.41.61.8MeasuredLinear fit0128�
Fig. 9: The 3D positions of the metallic ball measured by the radar and depth sensors (left) after calibration with the quadratic function,
and the histograms of their positional errors (right).
Fig. 11: Dynamic hand gestures observed by the radar. For each gesture, the uppermost image display the points detected by the radar as
circles superimposed on a depth image. The color of the circle indicates the velocity of the point. The radius of the circle is proportional the
the RCS. The middle image shows the corresponding RDM (see Fig. 5 for description). The lowest image shows the color encoded velocity
map of the hand extrapolated from the detected radar points [5].
objects. The experiments on dynamic hand gesture sensing
show the reliability of the approach for gesture sensing.
REFERENCES
[1] S. Mitra and T. Acharya, “Gesture recognition: A survey,” IEEE Trans-
actions on Systems, Man, and Cybernetics, Part C: Applications and
Reviews, vol. 37, no. 3, pp. 311–324, 2007.
[2] S. Gupta, D. Morris, S. Patel, and D. Tan, “Soundwave: using the Doppler
effect to sense gestures,” in SIGCHI Conference on Human Factors in
Computing Systems, 2012, pp. 1911–1914.
[3] Q. Wan, Y. Li, C. Li, and R. Pal, “Gesture recognition for smart
home applications using portable radar sensors,” in IEEE Conference on
Engineering in Medicine and Biology Society, Aug 2014, pp. 6414–6417.
[4] B. Raj, K. Kalgaonkar, C. Harrison, and P. Dietz, “Ultrasonic Doppler
sensing in HCI,” IEEE Pervasive Computing, vol. 11, no. 2, pp. 24–29,
Feb 2012.
[5] P. Molchanov, S. Gupta, K. Kim, and K. Pulli, “Multi-sensor system
for driver’s hand-gesture recognition,” in IEEE Conference on Automatic
Face and Gesture Recognition, May 2015, pp. 1–8.
[6] H. Rohling, “Radar CFAR thresholding in clutter and multiple target
situations,” IEEE Transactions on Aerospace and Electronic Systems,
vol. 19, no. 4, pp. 608–621, 1983.
200400600800100012001400160018002000X, mm-1000100200RadarDepth sensorError X, mm-40-2002040Probability00.020.04200400600800100012001400160018002000Y, mm-1000100Error Y, mm-2002040Probability00.010.020.03Sample200400600800100012001400160018002000Z, mm200400600Error Z, mm-60-40-200204060Probability00.010.02+1.5 m/s -1.5 m/s +1.5 m/s -1.5 m/s 0 m/s 0 m/s Depth + radar RDM Velocity map Range 1 2 3 4 5 6 7 8 9 10 + Velocity - �



 2023年江西萍乡中考道德与法治真题及答案.doc
 2012年重庆南川中考生物真题及答案.doc
 2013年江西师范大学地理学综合及文艺理论基础考研真题.doc
 2020年四川甘孜小升初语文真题及答案I卷.doc
 2020年注册岩土工程师专业基础考试真题及答案.doc
 2023-2024学年福建省厦门市九年级上学期数学月考试题及答案.doc
 2021-2022学年辽宁省沈阳市大东区九年级上学期语文期末试题及答案.doc
 2022-2023学年北京东城区初三第一学期物理期末试卷及答案.doc
 2018上半年江西教师资格初中地理学科知识与教学能力真题及答案.doc
 2012年河北国家公务员申论考试真题及答案-省级.doc
 2020-2021学年江苏省扬州市江都区邵樊片九年级上学期数学第一次质量检测试题及答案.doc
 2022下半年黑龙江教师资格证中学综合素质真题及答案.doc