�
Using R
for Introductory
metrics
。
。
Ee
n
Florian
Heiss
�
Using R for Introductory
FlorianHeiss 2016. All rights
Econome位ics
。
reserved
Companion
website:
http: I /www. URfIE. net
Address
UniversitatsstraBe
1, Geb. 24.31.01.24
40225 Diisseldorf,
Germany
ISBN: 978 1523285136
ISBN 10: 1523285133
�
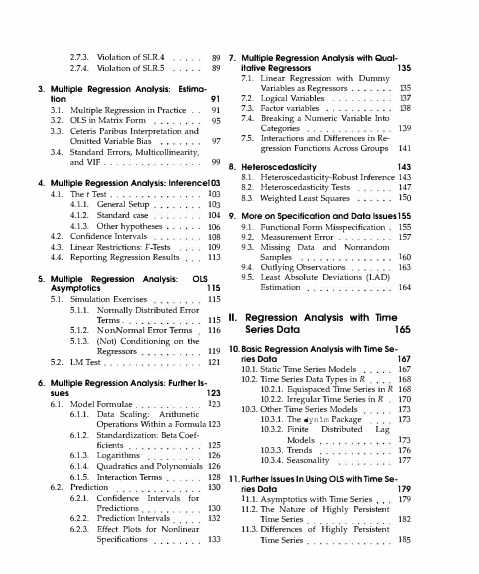
37
Distributions
1.5.2.
Continuous
Histogram
1.5.3. Empirical
tribution
and Density
Cumulative
Dis
细
Function
(ECDF)
川训
4
4
6
Distributions
1.5.4. Fundamental
Statistics
Distributions
1.6. Probability
1.6 1. Discrete
1.6.2. Continuous
1.6.3. Cumulative
Distributions
Distribution
Function
(CDF)
44
1.6.4. Random Draws from Prob
ability
Distributions
45
1.7. Con且denceIntervals
and Statisti
cal Inference
1.71. Con且denceIntervals
1.7.2. t Tests
1.7 3. p Values
1.7.4. Automatic
calculations
Execution
1.8 1. Conditional
1.8.2. Loops
1.8.3. Functions
1.8.4 Outlook
1.9. Monte Carlo Simulation
of
1.91. Finite
Sample Properties
Estimators
58
A噎
A哑
EJ
EJ
EJ
ZJ
EJ
EJ
EJ
EJ
P3
7
7
0
1
2
6
6
6
7
7
8
1
1.8. Advanced
R
ntents
c。
Preface
1. lntr
。
1.1. Getting
n
。
ducti
Started
3
3
3
1.1.1. So仕ware
4
1.1.2. R Scripts
7
1.1.3. Packages
1.1.4. File names and the Work
OO
QJ
and Warnings
QJ
AU
1.1.5. Errors
1.1.6. 0出erResources
ing Directory
1.2. Objects
in R
1.2.1. Basic Calculations
and Ob
jects
1.2.2. Vectors
1.2.3. Special
1.2.4. Naming and Indexing
1.2.5. Matrices
1.2.6.
10
12
Types of Vectors 14
15
16
19
1.3. Data Frames and Data Files 20
20
21
22
1.3.1. Data Frames
1.3.2. Subsets
of Data
1.3.3. R Data Files
1.3.4. Basic Information
Lists
on a
Data Set
22
Vectors
1.3.5. lmport and Export of Text
1.3.6.
Files
lmport and Export of Other
Data Formats
1.9.2. Asymptotic
Properties of
Estimators
61
1.9.3. Simulation of Con且dence
Intervals
and t Tests
64
23 I. Reg『essionAnalysis
with C『·oss-
Sectional
Data
67
69
69
24
25 2
1.3.7. Data Sets in出eExamples
26 2.1. Simple OLS Regression
26 2.2. Coe他cients,
eSimple Reg阻挡i
”、
del
1.4. Graphics
n M
。
。
1.4.1. Basic Graphs
1.4.2. Customizing
Graphs with
Options
Several
1.4.3. Overlaying
1.4.4. Legends
1.4.5. Expo国ngto a File
Graphs
1.4.6.
Statistics
Advanced
1.5. Descriptive
1.5.1. Discrete
quencies
Tables
纽
约
Plots
m
m
m
Pre
u
Distributions:
and Contingency
34
Residuals
of Fit
2.3. Goodness
2.4. Nonlinearities
2.5. Regression
Fitted Values,
and
凡
响川
”
仕uoughthe Origin
and
on a Constant
Values, 飞1ariances,
and
Errors
m但
UH
2.7. Monte Carlo Simulations
UH
wm
2.6. Expected
Standard
Regression
One sample
2.7.1.
2.7.2. Many Samples
80
�
2.7.3.
2.7.4.
Violation
Violation
of SLR.4
of SLR.5
89 7. Multiple
89 itative
Regress。『s
Regression
Analysis
with Qual-
135
7.1. Linear Regression
wi出Dummy
as Regressors
Variables
tN
明J
n
3. Multiple
Regression
Analysis:
Estima-
91
in Practice 91
95
7.2. Logical
7.3. Factor
7.4. Breaking
Variables
variables
4. Multiple
4.1. The t Test
,
and
and VIF
Categories
Regression
3.4. Standard
lnterpretation
mm
a Numeric Variable
lnto
97 7.5. lnteractions
3.1. Multiple
”。
3.2. OLS in Matrix Form
Paribus
3.3. Ceteris
Bias
Variable
Omitted
Errors,
Multicollinearity
139
and Differences
Across Groups 141
99 8. Heteroscedasticity 143
143
03
Tests 147
103
Least Squares 150
4.1.1. General Setup 103
4.1.2. Standard case . 104 9. M
4.1.3. 0出erhypotheses 106 9.1. Functional
8.1. Heteroscedasti口ty-Robust
8.2. Heteroscedasti口ty
8.3. Weighted
Form h咀sspeci且cation
E国ssionFunctions
lnferencel
4.2. Confidence
4.3. Linear Restrictions:
4.4. Reporting
Regression
lntervals 108 9.2. Measurement
Error
nSpecttication
and Data Issues
155
155
157
F -Tests 109 9.3. Missing Data and Nonrandom
160
163
Results 113 Samples
Observations
lnference
Analysis:
Reg『ession
in Re-
re
。
。
9.4. Outlying
9.5. Least Absolute
Deviations
(LAD)
Estimation
164
5. Multiple
Reg阻挡i
n Analysis:
OLS
。
Asymptotlcs
5.1. Simulation
115
Exercises 115
Distributed
Error
5.1.1. Normally
Terms .
115 II. Re�『ession Analysis with
Time
5.1.2. Non-Normal Error Terms 116 Series Data
5.1.3. (Not) Conditioning
on由e
Regressors 119 10. Basic Regre剧。nAnalysis
with Time Se-
165
5.2. LM Test
121 rles Oatα
10.3. Other τ"irne Series
10.1. Static古me
10.2. Time Series
10.2.1.
10.2.2.
Time Series
Series
Data Types in R
Equispa四dTime Series
lrregular
167
Models 167
168
in R 168
in R 170
Models 173
The dynlm Package 173
Finite Distributed
Models
Trends
Seasonality
173
176
177
Lag
10.3.1.
10.3.2.
10.3.3.
10.3.4.
6. Multlple
Regre剧。nAnalysls:
Fu叶herls-
sues
6.1. Model Formulae
Operations
6.1.1. Data Scaling:
123
123
An出emetic
Within a Formula
123
6.1.2. Standardization:
125
6.1.3. Logarithms 126
6.1.4. Quadratics
126
6.1.5. lnteraction
自cients
Beta C四ι
6.2. Prediction
6.2.1. Con且dencelntervals
for
and Polynomials
Terms 128 11. Fu付he『IssuesIn Using OLS with Time Se-
130 rles Oatα
11.1. Asymptotics
179
with Time Series 179
Predictions 130 11.2. The Nature of Highly Persistent
6.2.2. Prediction
6.2.3. Effect
lntervals 132 Time Series
Plots for Nonlinear 11.3. Differences
of Highly Persistent
Speci自cations 133 Time Series
182
185
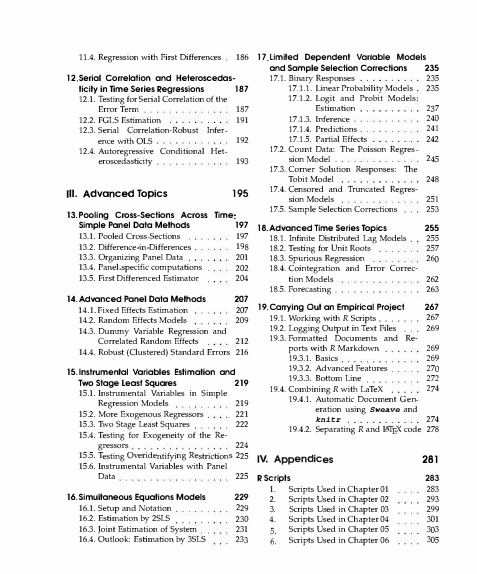
�
11.4. Regression
with First Differences
186 17 Limited
Dependent
Venable M
dels
。
Probability Models
17.1.1.
17.1.2.
。ndSan、pleSelecti。n c。,recti。ns 235
17.1. Binary Responses
235
235
肉。A哇
Linear
Logit and Probit Models
Estimation
17 1.3. Inference
17.1.4.
17.1.5.
Predictions
Partial
7
0
1
A哇
242
Effects
句,&
句,&
句,&
17.2. Count Data: τ"he Poisson
Regres
12 Serlal c。rrelatl。n and Heter,。seedas-
In Time Series Reg阻挡l
ns
tlclty
12.1. T,四tingfor Serial
。
187
Correlation
187
191
of仕回
12.2. FGLS Estimation
12.3. Serial Correlation
Robust Infer
Error Term
ence wi出OLS
12.4. Autoregressive
Conditional
Het
eroscedastic均
192
193
Ill. Advanced Topics
195
17.3. Corner Solution
Responses:
The
sionModel
Tobit Model
245
248
17.4. Censored and Truncated
Regres-
sion Models
251
Corrections 253
17.5. Sample Selection
197 18. Advanced Time Serles T
13.P。ollngCross-Secti。nsAcross Time
。
ds
Slmple Panel Data Meth
255
13.1. Pooled Cross Sections 197 18.1. lnfinite Distributed
Lag Models 255
13.2. Difference
257
13.3. Organizing
Regression 260
13.4. Panel spec1且ccomputations 202 18.4. Cointegration
13.5. First Differenced
in Differences 198 18.2. Testing for Unit Roots
Panel Data
201 18.3. Spurious
Estimator 204
and Error Correc-
tion Models
pies
。
14.Advanced
Panel Data Meth。ds
Effects Estimation
14.1. Fixed
14.2. Random Effects Models
14.3. Dummy Variable
Regression
and
Correlated
Random E旺ects
14.4. Robust (Clustered)
Standard
Errors 216
15.lnst阳mental
Varlables
Estlmati。nand
Tw
StageLeast Squares
15.1. Instrumental
Variables
in Simple
219
。
Regression
Models
15.2. More Exogenous Regressors
15.3. Two Stage Least Squares
15.4. 1日estingfor Exogeneity
of the Re-
262
263
18.5. For配asting
207
207 19.Carrylng
209 19.1. Working
19.2. Logging
212 19.3. Formatted
Out an Empirical
Pr,。,Ject267
m出 RScripts 267
Output in Text Files 269
Documents and Re-
,。
,。7
Features
ports Wl出RMarkdown
19 .3.1. Basics
19.3.2.
19 .3.3. Bottom Line
Advanced
句,-
吨,&
句,&
句,&
鸣,&
句,&
oy
oy
nU
7
7
A哇
19.4. Combining
R with LaTeX
219
221
222
19.4.1.
Document Gen
using Sweave and
Automatic
eration
knitr
Separating
19.4.2.
274
Rand 也可'.}'. code 278
gressors
15.5. Testing
15.6. Instrumental
Overidentifyi
Variables
224
ng Restriction
s 225 IV. Appendices
225 R Scripts
with Panel
Data
16.Slmultane。usEquatl。nsM。dels
16.1. Setup and Notation
16.2. Estimation
16.3. Joint Estimation
16.4. Outlook:
Estimation
of System
by 3SLS
by 2SLS
1. Scripts
Used in Chapter
229 2. Scripts
Used in Chapter
229 3. Scripts Used
in Chapter
23口 4. Scripts
Used in Chapter
231
Scripts
Used in Chapter
Scrip恒Usedin Chapter
233
01
02
03
04
05
06
281
00
3
2
3
2
00
3
2
QJ
9
2
QJ
1
3
AU
3
3
AU
5
3
AU
�
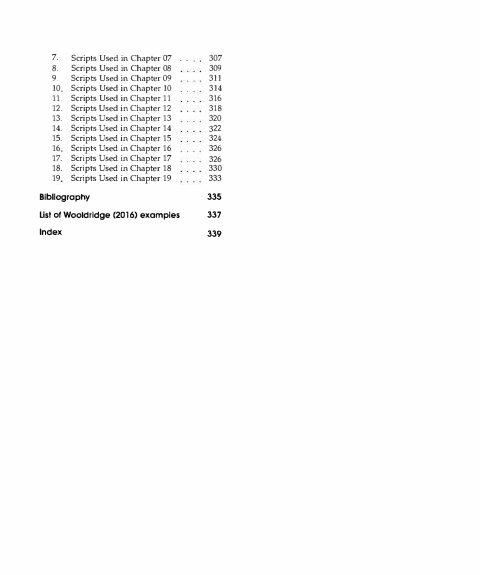
7. Scripts
Used in Chapter
8. Scripts
Used in Chapter
9. Scripts
Used in
Chapter
10 Scrip国U目din Chapter
11. Scripts
Used in Chapter
12. Scripts
Used in Chapter
13. Scripts
Used in Chapter
14. Scripts
Used in Chapter
15. Scripts
Used in Chapter
16 Scripts
Used in Chapter
17. Scripts
Used in Chapter
18. Scripts
Used in Chapter
19 Scripts
Used in Chapter
O 7 • • 30 7
08
09
10
11
12
13
14
15
16
17
18
19
309
311
314
316
318
320
322
324
326
326
330
333
Bibll
graphy
。
335
List of w
ldridge(2016) examples 337
。。
Index
339
�



 2023年江西萍乡中考道德与法治真题及答案.doc
 2012年重庆南川中考生物真题及答案.doc
 2013年江西师范大学地理学综合及文艺理论基础考研真题.doc
 2020年四川甘孜小升初语文真题及答案I卷.doc
 2020年注册岩土工程师专业基础考试真题及答案.doc
 2023-2024学年福建省厦门市九年级上学期数学月考试题及答案.doc
 2021-2022学年辽宁省沈阳市大东区九年级上学期语文期末试题及答案.doc
 2022-2023学年北京东城区初三第一学期物理期末试卷及答案.doc
 2018上半年江西教师资格初中地理学科知识与教学能力真题及答案.doc
 2012年河北国家公务员申论考试真题及答案-省级.doc
 2020-2021学年江苏省扬州市江都区邵樊片九年级上学期数学第一次质量检测试题及答案.doc
 2022下半年黑龙江教师资格证中学综合素质真题及答案.doc