Problem Chosen
E
2020
MCM/ICM
Summary Sheet
Team Control Number
2005512
A Novel Evaluation Model of Plastic Waste
Based on Ecological Cost Function
Summary
With the increasing pollution of plastic waste to the environment, the treatment of plastic waste and
related environmental protection issues have attracted the attention of the whole society. In this paper,
we take the change of ecological cost before and after the treatment of plastic waste as a research object,
comprehensively considering plastic recycling, plastic incineration and landfill, the ability of different
regions to handle plastic waste, the impact of plastic waste on the ocean, and various government
policies on plastic waste to build the model.
According to a great deal of references, we divide the environmental damage during the treatment
of plastic waste into two parts, CO2 and toxic substances. By using the equivalent combustion of carbon
and emission limit standards, we determine that the environmental cost required to process plastic waste
is 187.67 yuan/t. By using the Analytic Hierarchy Process (AHP), we evaluate the four features of
marine pollution, leachate pollution, air pollution, and soil pollution to obtain the weight vector of
each feature, and then calculate the environmental benefits brought by recycling plastic waste as 103.4
yuan/t. After considering the diversity of waste collection methods, we establish the ecological cost
function before and after the treatment of plastic waste. We discuss the extreme value of ecological cost
change under three conditions where the function independent variable (the amount of waste plastic)
changes, and the independent variable corresponding to the three conditions is the maximum level of
plastic waste required.
In order to solve the extent of plastic waste can be reduced to reach an environmentally safe level, we
innovatively introduce an index to evaluate the regional plastic waste treatment capacity and integrate
it into the previous model. According to the country’s economic level and environmental awareness,
countries in the world are classified on the basis of country’s ability to handle plastic waste. We also
analyze the impact of different policies on plastic industry in different regions, and find that these
policies can be attributed to the changes of the four variables in the model (recycling amount, waste
plastic amount, different plastic material proportion and plastic processing capacity). Additionally, we
give the ecological cost change function before and after the plastic waste treatment during discussing
two cases, and the point where the function value is zero is defined as the environmentally safe level.
We consult the data to find the proportion of different kinds of plastic used in each market sector and
constitute a proportion matrix. And we comprehensively consider the recyclability of different kinds of
plastic, the possible reduction in the amount of plastic used in each market sector, and the widespread
use of new degradable plastics, then change the elements in the matrix to get the minimum level of
realization that can be achieved by each market sector. By adding up each market sector’s minimum
level, we can get the target for the minimal achievable level of global plastic waste. Taking 2015 as an
example, using our model we calculate that its minimum level is 103.9 Mt, which is 65.6% less than
the original plastic waste (302 Mt).
For the time and space distribution inhomogeneity of plastic waste, we combine three indicators
(Plastic waste per person, Total plastic waste by country, Share of plastic waste that is inadequately
disposed) to evaluate 168 countries in the world. We compare the variance of the 168 countries and the
variance of the 50 countries in the middle rank. The result is Var1 = 0.12 > Var2 = 0.03, indicating that
the improper treatment of plastic waste in some countries has caused inequity issue. And we give some
feasible solutions to solve this inequity.
Finally, in memo, we plot the curve of the amount of plastic waste over 100 years and the percentage
reduction in the world under ideal conditions. In addition, we show obstacles and accelerators that may
be encountered during the period.
�
Contents
1
Introduction
. . . . . . . . . . . . . . . . . . . . . . . . . . . . .
1.1 Background .
1.2 Restatement of the Problem . . . . . . . . . . . . . . . . . . . . . . . . . . . .
. .
.
.
.
.
2 Analysis of the Problem
3 Assumptions
4 The Model Results
.
.
.
.
.
4.1 Model Preparation . .
. .
4.2 Symbol List .
.
4.3 Model Building . .
.
.
. . . . . . . . . . . . . . . . . . . . . . . . . . . . .
. . . . . . . . . . . . . . . . . . . . . . . . . . . . .
. . . . . . . . . . . . . . . . . . . . . . . . . . . .
.
4.3.1
. . . . . . . . . . . . . . . . . . . . . . .
4.3.2 How to reach environmentally safe level . . . . . . . . . . . . . . . . .
4.3.3 The minimal achievable level of global plastic waste and its impact
. .
Solutions of the equity issues that arise from the global crisis . . . . . .
4.3.4
Finding the maximum level
5 Strengths and Weaknesses
.
.
. .
5.1 Strengths
5.2 Weaknesses .
. .
.
.
.
.
.
.
.
.
. . . . . . . . . . . . . . . . . . . . . . . . . . . . .
. . . . . . . . . . . . . . . . . . . . . . . . . . . . .
Memorandum
References
Appendix A: Data of Plastic waste per person, Total plastic waste by country and
Share of plastic waste that is inadequately disposed of 168 countries.
Appendix B: Data of Plastic waste per person, Total plastic waste by country and Share
of plastic waste that is inadequately disposed of 50 countries in the middle.
Appendix C: MATLAB Code
2
2
2
3
3
4
4
4
5
5
10
14
16
17
17
18
19
21
22
23
23
�
Team # 2005512
1 Introduction
1.1 Background
Page 2 of 24
The World Economic Forum stated in 2016 that there will be more plastic waste in the
oceans than fish by 2050[1]. Plastics have become essential in our daily lives owing to their low
price, versatility, and ease of production. However, many of them are nonbiodegradable and
are causing disastrous environmental problems on land and also in the oceans and waterways.
At present, the plastic output has reached 400 million tons per year, and it is estimated that by
2050, there will be 12 billion tons of plastic waste worldwide. Studies[2, 3] have shown that
microplastic fibers have been found even in deep sea organisms[4]. It has caused widespread
concern about plastic pollution in the whole society. In 2018, the research team of the Vienna
Medical University detected microplastics from human feces for the first time, confirming that
plastic pollution has entered the human food chain[5], and it is urgent to solve the problem of
plastic pollution!
China implemented a plastic restriction order against white pollution as early as 2008. In
2019, Hainan Province issued a "plastic ban order". The province banned the production, sale
and use of disposable non-degradable plastic bags and plastic tableware. A study by the Uni-
versity of Herriot-Watt in the United Kingdom points out that the "prohibition of plastics" will
cause greater harm to the environment[6]. Substituting metal and glass for plastic will double
greenhouse gas emission. Obviously, the simple "forbidden" is definitely not a visionary solu-
tion. In order to solve the problem of plastic waste, it is extremely necessary to slow down the
process of plastic production and improve the way plastic waste is handled.
1.2 Restatement of the Problem
• In order not to cause further environmental damage, we develop a model which can esti-
mate the maximum level of disposable plastic products that can be safely mitigated.
• Considering factors impacting the levels of plastic waste, we discuss to what extent plastic
waste can be reduced to reach an environmentally safe level.
• Set a target for the minimal achievable level of global waste of single-use or disposable
plastic products and discuss the impacts for achieving such levels by using our model and
discussion.
• Modify our model based on different region and share our solutions to ICM.
• Write a two-page memo to the ICM (Describing a realistic global target minimum achiev-
able level of global single-use or disposable plastic product waste. Timetable for reaching
this level. Conditions that may accelerate or hinder realization)
�
Team # 2005512
Page 3 of 24
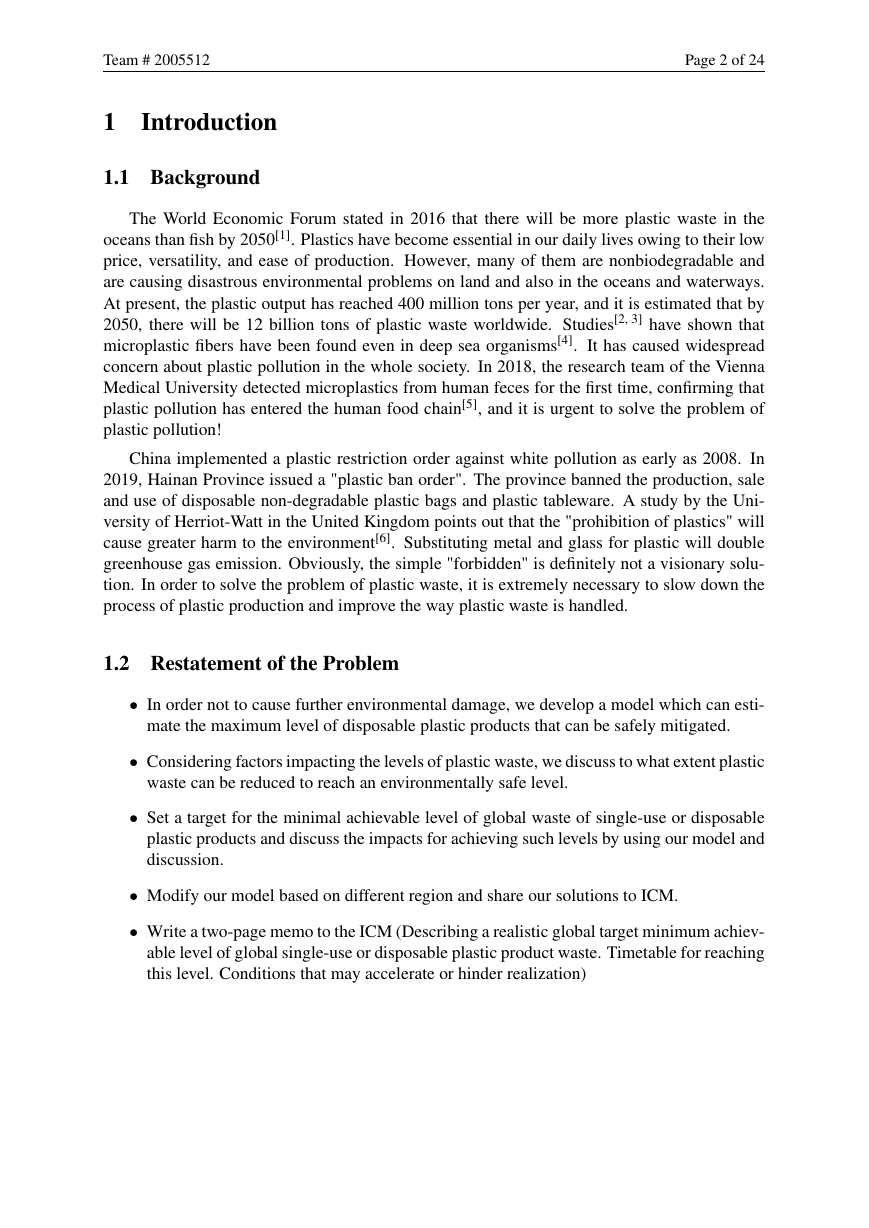
Figure 1: Various ways to handle plastic
2 Analysis of the Problem
• The maximum number of single-use or disposable plastic product waste is a result of a
comprehensive game after considering the ecological costs of disposal and the benefits of
recycling plastic waste. Without the further environmental damage, the following factors
have been considered for the maximum number: Incineration cost, Recovery cost, Ocean
pollution, Leachate pollution, Air pollution, Soil pollution.
• Based on the interpretation of various policies and the assessment of the processing ca-
pacity between different countries, and taking into account the recyclability of different
kind of plastic, the minimum proportion of plastics in different market sectors can be
achieved, so as to obtain the minimal amount of waste plastic.
• The setting of the single-use or disposable plastic product rejection rate refers to the
environmental standards of various countries. We explores the impact on the ouput
• The equity issue is solved by evaluating and comparing 168 countries all over the world.
3 Assumptions
• No additional damage to the environment during recycling of plastic waste.
• The ability to handle plastic waste is positively related to the Comprehensive National
Power.
• National policies on plastic are sustainable.
�
Team # 2005512
Page 4 of 24
4 The Model Results
4.1 Model Preparation
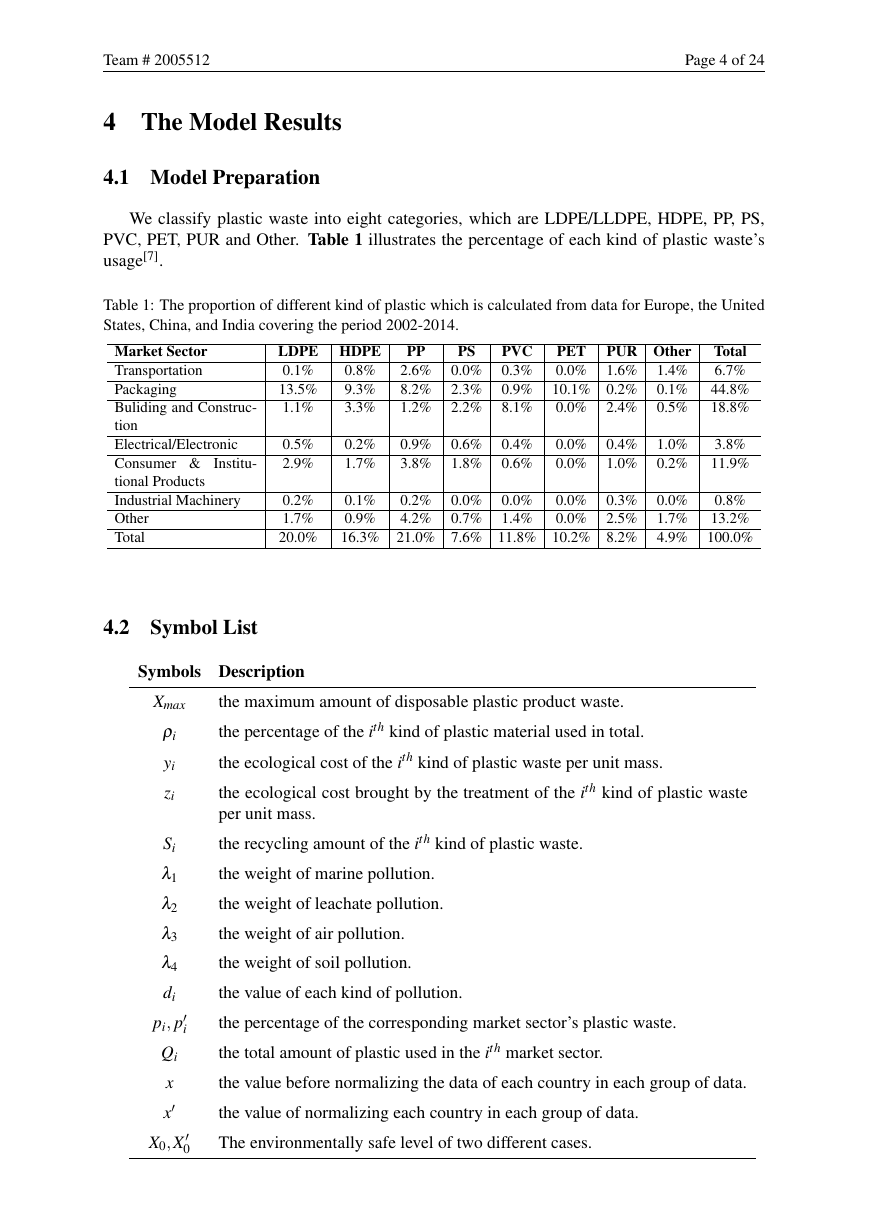
We classify plastic waste into eight categories, which are LDPE/LLDPE, HDPE, PP, PS,
PVC, PET, PUR and Other. Table 1 illustrates the percentage of each kind of plastic waste’s
usage[7].
Table 1: The proportion of different kind of plastic which is calculated from data for Europe, the United
States, China, and India covering the period 2002-2014.
Market Sector
Transportation
Packaging
Buliding and Construc-
tion
Electrical/Electronic
Consumer & Institu-
tional Products
Industrial Machinery
Other
Total
PP
PS
LDPE HDPE
0.1%
13.5%
1.1%
Total
PUR Other
0.8% 2.6% 0.0% 0.3% 0.0% 1.6% 1.4%
6.7%
9.3% 8.2% 2.3% 0.9% 10.1% 0.2% 0.1% 44.8%
3.3% 1.2% 2.2% 8.1% 0.0% 2.4% 0.5% 18.8%
PVC
PET
0.5%
2.9%
0.2% 0.9% 0.6% 0.4% 0.0% 0.4% 1.0%
3.8%
1.7% 3.8% 1.8% 0.6% 0.0% 1.0% 0.2% 11.9%
0.1% 0.2% 0.0% 0.0% 0.0% 0.3% 0.0%
0.8%
0.2%
1.7%
0.9% 4.2% 0.7% 1.4% 0.0% 2.5% 1.7% 13.2%
20.0% 16.3% 21.0% 7.6% 11.8% 10.2% 8.2% 4.9% 100.0%
4.2 Symbol List
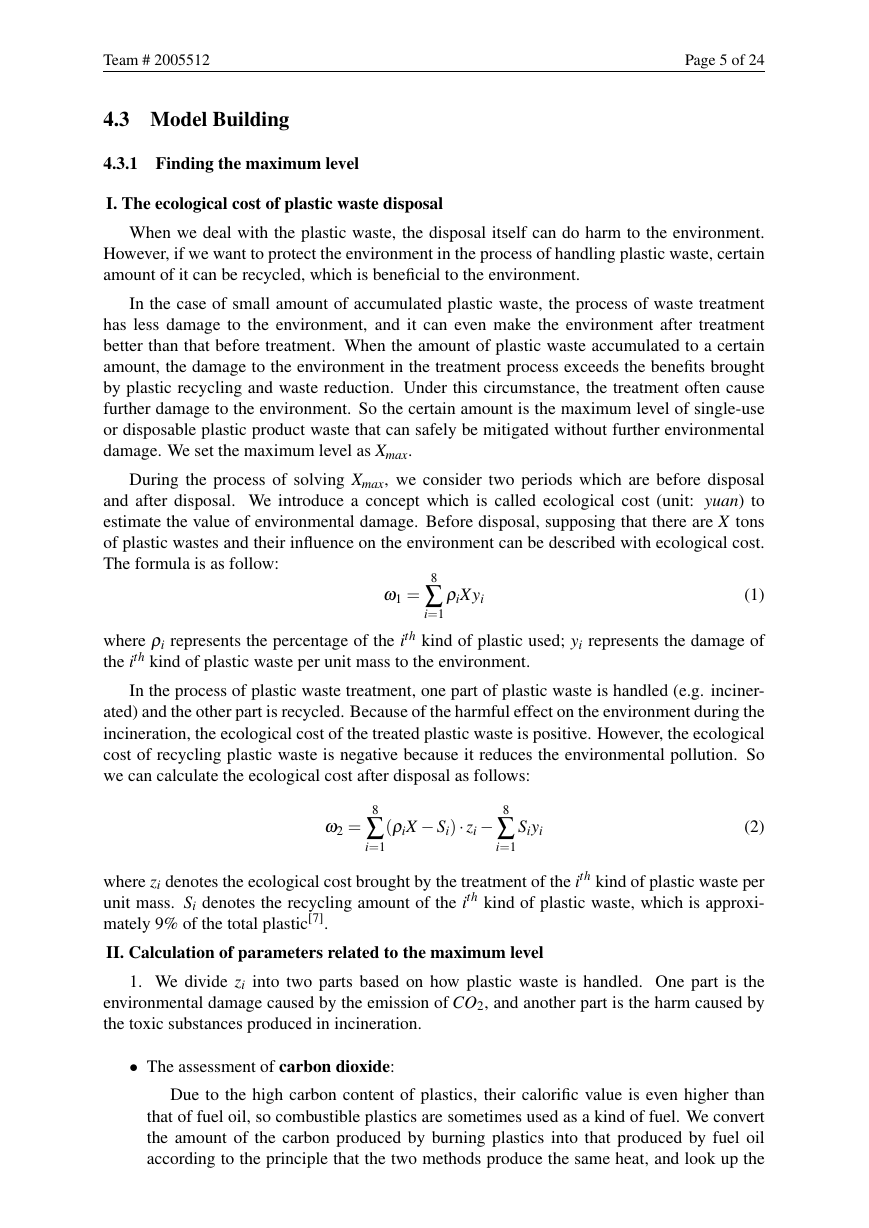
Symbols Description
Xmax
ρi
yi
zi
Si
λ1
λ2
λ3
λ4
di
pi, p′
Qi
x
x′
X0,X′
i
0
the maximum amount of disposable plastic product waste.
the percentage of the ith kind of plastic material used in total.
the ecological cost of the ith kind of plastic waste per unit mass.
the ecological cost brought by the treatment of the ith kind of plastic waste
per unit mass.
the recycling amount of the ith kind of plastic waste.
the weight of marine pollution.
the weight of leachate pollution.
the weight of air pollution.
the weight of soil pollution.
the value of each kind of pollution.
the percentage of the corresponding market sector’s plastic waste.
the total amount of plastic used in the ith market sector.
the value before normalizing the data of each country in each group of data.
the value of normalizing each country in each group of data.
The environmentally safe level of two different cases.
�
Team # 2005512
Page 5 of 24
4.3 Model Building
4.3.1 Finding the maximum level
I. The ecological cost of plastic waste disposal
When we deal with the plastic waste, the disposal itself can do harm to the environment.
However, if we want to protect the environment in the process of handling plastic waste, certain
amount of it can be recycled, which is beneficial to the environment.
In the case of small amount of accumulated plastic waste, the process of waste treatment
has less damage to the environment, and it can even make the environment after treatment
better than that before treatment. When the amount of plastic waste accumulated to a certain
amount, the damage to the environment in the treatment process exceeds the benefits brought
by plastic recycling and waste reduction. Under this circumstance, the treatment often cause
further damage to the environment. So the certain amount is the maximum level of single-use
or disposable plastic product waste that can safely be mitigated without further environmental
damage. We set the maximum level as Xmax.
During the process of solving Xmax, we consider two periods which are before disposal
and after disposal. We introduce a concept which is called ecological cost (unit: yuan) to
estimate the value of environmental damage. Before disposal, supposing that there are X tons
of plastic wastes and their influence on the environment can be described with ecological cost.
The formula is as follow:
ω1 =
ρiXyi
(1)
8∑
i=1
where ρi represents the percentage of the ith kind of plastic used; yi represents the damage of
the ith kind of plastic waste per unit mass to the environment.
In the process of plastic waste treatment, one part of plastic waste is handled (e.g. inciner-
ated) and the other part is recycled. Because of the harmful effect on the environment during the
incineration, the ecological cost of the treated plastic waste is positive. However, the ecological
cost of recycling plastic waste is negative because it reduces the environmental pollution. So
we can calculate the ecological cost after disposal as follows:
(ρiX − Si)· zi − 8∑
ω2 =
Siyi
(2)
8∑
i=1
i=1
where zi denotes the ecological cost brought by the treatment of the ith kind of plastic waste per
unit mass. Si denotes the recycling amount of the ith kind of plastic waste, which is approxi-
mately 9% of the total plastic[7].
II. Calculation of parameters related to the maximum level
1. We divide zi into two parts based on how plastic waste is handled. One part is the
environmental damage caused by the emission of CO2, and another part is the harm caused by
the toxic substances produced in incineration.
• The assessment of carbon dioxide:
Due to the high carbon content of plastics, their calorific value is even higher than
that of fuel oil, so combustible plastics are sometimes used as a kind of fuel. We convert
the amount of the carbon produced by burning plastics into that produced by fuel oil
according to the principle that the two methods produce the same heat, and look up the
�
Team # 2005512
Page 6 of 24
data to find that the average of absorbing one ton of carbon is 260.9 yuan. So:
37234.81
× 0.85× 260.9 = 187.67
zi1 =
(3)
the calorific value of plastics is 16000∗ 1055.6/1000∗ 2.2046 = 37234.81 KJ/Kg while
that of oil is 44000 KJ/Kg[8]. Despite carbon, there are other elements in oil, but carbon
is the most element which accounts for 85% on average.
44000
• The assessment of toxic substances:
It is reported that the main toxic substance produced in the burning process of plastic is
dioxin. It is 1,000 times more toxic than potassium cyanide, so it is entitled the "mosttoxic
substance on earth"[9]. Once it enters into human’s body, it is stored in the fat and difficult
to be degraded or excreted. It has a half-life of up to 30 years in the body, and it may
take 100 years to be completely degraded or excreted[10]. Generally, no matter whether
the substance that can produce dioxin is burned or not, the treatment of possible dioxin
will be added from the first process, so the amount of dioxin discharged in the end is
very small, and the harm to environment and biology can be ignored, so we think it is 0.
Overall,
zi = zi1 = 187.67
(4)
2. yi denotes the environmental damage caused by the landfill of plastic wastes. We use four
features (marine pollution, leachate pollution, air pollution and soil pollution) to assess yi with
AHP method.
Analytic Hierarchy Process (AHP) is apractical decision method with multiple plans or ob-
jectives which was put forward by American operations research expert t.l. Saaty in the 1970s.
It is a decision analysis method combining qualitative analysis with quantitative analysis. It
is often applied to unstructured complex decision-making problems with multiple objectives,
criteria, elements and levels, especially strategic decision-making problems. We made a con-
trastive matrix and used MATLAB to calculate the numerical value of CI and CR, and finally got
the vector of each feature’s weight.
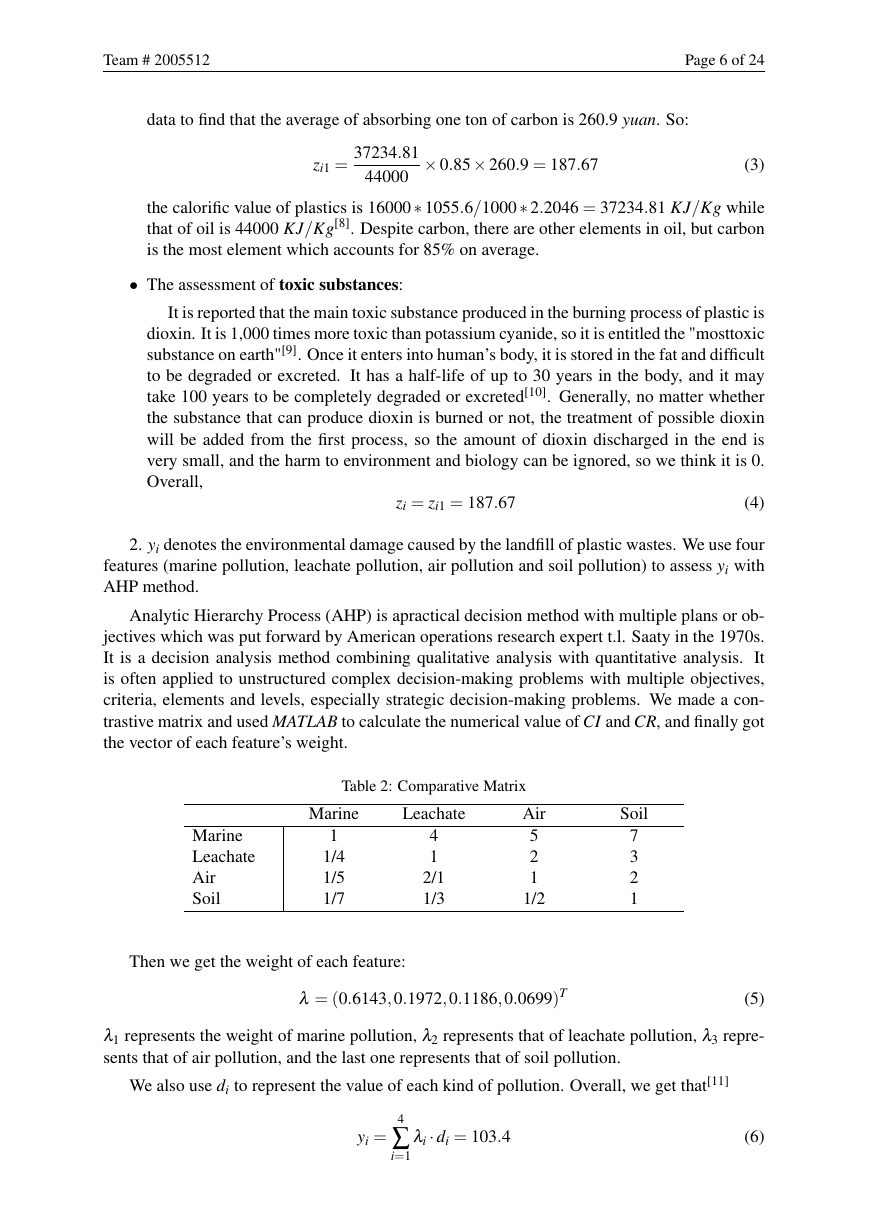
Table 2: Comparative Matrix
Marine
Leachate
Marine
Leachate
Air
Soil
1
1/4
1/5
1/7
4
1
2/1
1/3
Air
5
2
1
1/2
Soil
7
3
2
1
Then we get the weight of each feature:
(5)
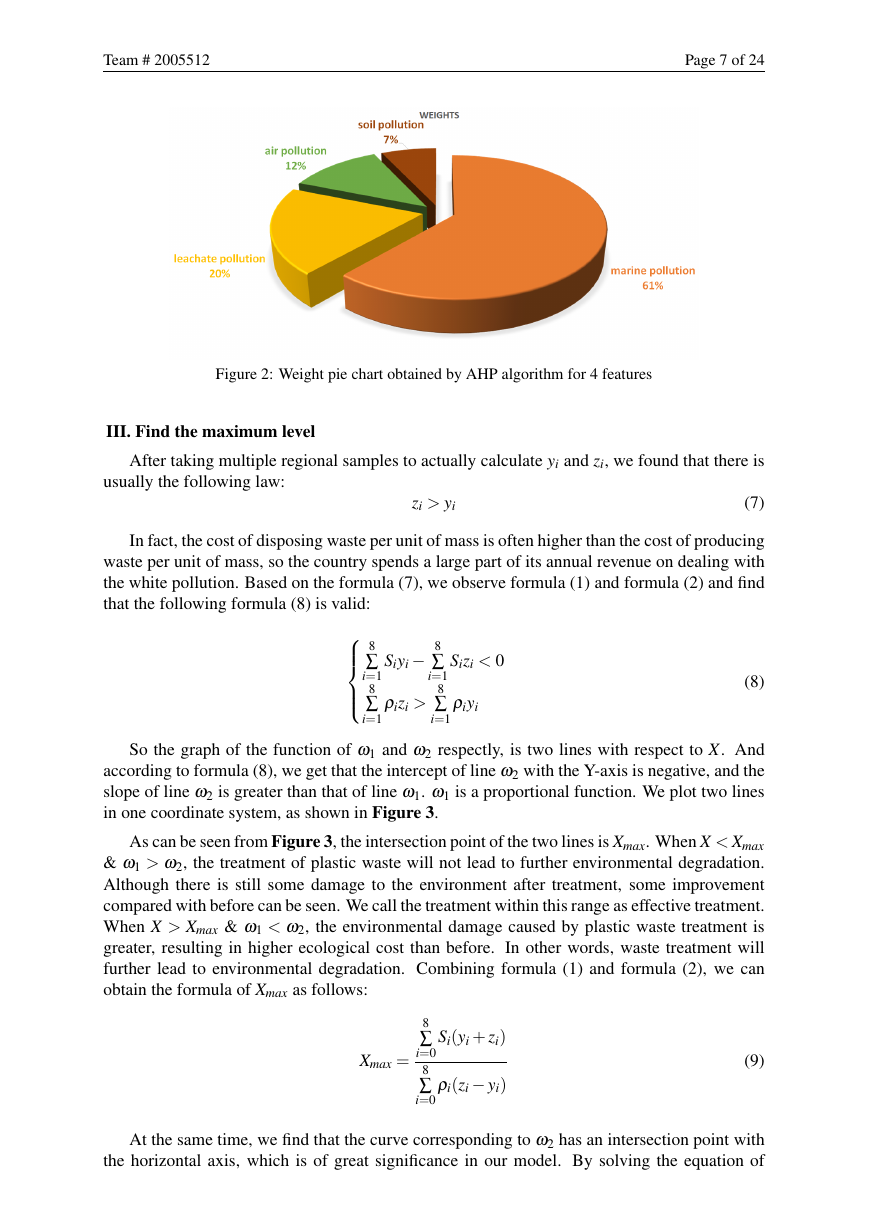
λ1 represents the weight of marine pollution, λ2 represents that of leachate pollution, λ3 repre-
sents that of air pollution, and the last one represents that of soil pollution.
λ = (0.6143,0.1972,0.1186,0.0699)T
We also use di to represent the value of each kind of pollution. Overall, we get that[11]
yi =
4∑
i=1
λi · di = 103.4
(6)
�
Team # 2005512
Page 7 of 24
Figure 2: Weight pie chart obtained by AHP algorithm for 4 features
III. Find the maximum level
After taking multiple regional samples to actually calculate yi and zi, we found that there is
usually the following law:
zi > yi
(7)
In fact, the cost of disposing waste per unit of mass is often higher than the cost of producing
waste per unit of mass, so the country spends a large part of its annual revenue on dealing with
the white pollution. Based on the formula (7), we observe formula (1) and formula (2) and find
that the following formula (8) is valid: 8∑
Siyi − 8∑
i=1
8∑
ρizi >
i=1
i=1
8∑
i=1
Sizi < 0
ρiyi
(8)
So the graph of the function of ω1 and ω2 respectly, is two lines with respect to X. And
according to formula (8), we get that the intercept of line ω2 with the Y-axis is negative, and the
slope of line ω2 is greater than that of line ω1. ω1 is a proportional function. We plot two lines
in one coordinate system, as shown in Figure 3.
As can be seen from Figure 3, the intersection point of the two lines is Xmax. When X < Xmax
& ω1 > ω2, the treatment of plastic waste will not lead to further environmental degradation.
Although there is still some damage to the environment after treatment, some improvement
compared with before can be seen. We call the treatment within this range as effective treatment.
When X > Xmax & ω1 < ω2, the environmental damage caused by plastic waste treatment is
greater, resulting in higher ecological cost than before. In other words, waste treatment will
further lead to environmental degradation. Combining formula (1) and formula (2), we can
obtain the formula of Xmax as follows:
Xmax =
8∑
i=0
8∑
i=0
Si(yi + zi)
ρi(zi − yi)
(9)
At the same time, we find that the curve corresponding to ω2 has an intersection point with
the horizontal axis, which is of great significance in our model. By solving the equation of
�


 2023年江西萍乡中考道德与法治真题及答案.doc
 2012年重庆南川中考生物真题及答案.doc
 2013年江西师范大学地理学综合及文艺理论基础考研真题.doc
 2020年四川甘孜小升初语文真题及答案I卷.doc
 2020年注册岩土工程师专业基础考试真题及答案.doc
 2023-2024学年福建省厦门市九年级上学期数学月考试题及答案.doc
 2021-2022学年辽宁省沈阳市大东区九年级上学期语文期末试题及答案.doc
 2022-2023学年北京东城区初三第一学期物理期末试卷及答案.doc
 2018上半年江西教师资格初中地理学科知识与教学能力真题及答案.doc
 2012年河北国家公务员申论考试真题及答案-省级.doc
 2020-2021学年江苏省扬州市江都区邵樊片九年级上学期数学第一次质量检测试题及答案.doc
 2022下半年黑龙江教师资格证中学综合素质真题及答案.doc