Journal of Statistical Computation and Simulation
F
o
 
 
[SPECIAL ISSUE AsiaSim] A Sliding Window based Multi-
stage Clustering and Probabilistic Forecasting Approach for 
r 
P
Large Multivariate Time Series Data 
e
e
r 
Journal: 
Journal of Statistical Computation and 
Simulation 
Manuscript ID  GSCS-2016-0670 


Manuscript Type:  Original Paper 
R
Areas of Interest:  SPECIAL ISSUE (AISIASIM), TIME SERIES 
e
2010 Mathematics Subject 
Classification: 
v
i
62H30 
e


w
 
O
n
l
y
URL: http:/mc.manuscriptcentral.com/gscs
Page 1 of 14
Journal of Statistical Computation and Simulation
1
2
3
4
5
6
7
8
9
10
11
12
13
14
15
16
17
18
19
20
21
22
23
24
25
26
27
28
29
30
31
32
33
34
35
36
37
38
39
40
41
42
43
44
45
46
47
48
49
50
51
52
53
54
55
56
57
58
59
60
 
A Sliding Window based Multi-stage Clustering and Probabilistic 
Forecasting Approach for Large Multivariate Time Series Data 


F
Abstract:  Time  series  data  analysis,  such  as  temporal  pattern  recognition  and  trend  forecasting,  plays  an 
o
r 
increasingly  significant  part  in  temporal  data  statistics  and  analytics.  Yet  challenges  still  exist  in  efficiency  of 
pattern  extracting  and  trend  prediction  for  large  multivariate  time  series.  The  paper  proposes  a  multi-stage 
clustering  approach  towards  multivariate  time  series  by  using  dynamic  sliding  time  windows.  The  segmented 
multivariate time series are clustered separately in each time window to product first stage clustering centers, and 
P
which are used to generate second stage clustering results involving all time windows. The method can simplify 
large  scale  multivariate  time  series  mining  problems  through  multi-stage  clustering  on  multiple  sliding  time 
windows thus achieve improved efficiency. Based on the clustering outcomes, a correlation rules mining method 
is  given  to  discover  frequent  patterns  in  the  time  series  and  generate  self-correlation  rules.  Then,  the  paper 
presents  a  probabilistic  forecasting  model  that  leverages  the  extracted  rules  to  make  short  term  predictions. 
e
e
r 
Finally, the experiments are presented to show the efficiency and effectiveness of the proposed approach. 
R
 
Keywords:  time  series,  statistics,  multi-stage  clustering,  dynamic  sliding  time  window,  time  series  forecasting 
e
model 
1.  Introduction 
v
i
e
O
w
 
A time series is defined as a sequence of data points in successive time order. Most commonly, 
time series are represented by plots in curves or lines chart. Time series statistics and analysis 
target at  extracting  meaningful  statistics characteristics  to  identify  the  underlying patterns  as 
well  as  predict  future  events,  which  are  widely  used  in  signal  processing,  mathematical 
finance,  earthquake  prediction,  smart  control,  and  transport  trajectory  forecasting.  With  the 
rising  of  Big  Data  era,  time  series  mining  and  forecasting  are  playing  an  increasingly 
significant role in data statistics and analytics [1].   
      Time series statistics and analysis mainly concern two goals. One is discovering the nature 
of  the phenomenon  represented by  the  temporal data, and  the  other  is  making predictions  of 
future  values  by  building  forecasting  models.  Time  series  patterns  identification  plays  an 
essential part in achieving these goals. Most methods of time series mining involve similarity 
measurement, time series clustering and association rule analysis. Time series patterns mining 
methods  usually  vary  with  different  problems  that  involve  specific  temporal  data  with 
characteristics.  Romani  [2]  proposed  a  time  series  mining  method  for  identify  association 
rules  between  meteorological  data  and  remote  sensing  information  data.  The  method  can 
extract the characteristic patterns of all kinds of data and generate association rules by training. 
Li  [3]  introduced  an  algorithm  for  mining  feature  patterns,  which  can  identify  the 
n
l
y
URL: http:/mc.manuscriptcentral.com/gscs
1
2
3
4
5
6
7
8
9
10
11
12
13
14
15
16
17
18
19
20
21
22
23
24
25
26
27
28
29
30
31
32
33
34
35
36
37
38
39
40
41
42
43
44
45
46
47
48
49
50
51
52
53
54
55
56
57
58
59
60
Journal of Statistical Computation and Simulation
Page 2 of 14
 
F
co-evolutional  sequences  containing  missing  values  or  not  by  exploiting  smoothness  and 
correlation.  Yao  [4]  developed  a  mode  dependent  stock  mining  method  that  can  be  used  for 
patterns discovery of stock data and trends predicting. In the method, a time search model was 
used to find frequent patterns in stock data by converting the continuous time series data into 
discrete space. And the model can make short-term trend forecasting of stock prices by using 
the  patterns.  Novak  [5]  applied  soft  computing  methods  to  time  series  data  mining,  such  as 
fuzzy  logic  and  fuzzy  transformation,  and  used  these  methods  to  extract  a  variety  of 
information, and finally integrated them together by natural language. Regarding the research 
on  time  series  clustering,  Xi  [6]  presented  a  clustering  method  based  on  singular  value 
decomposition  (SVD),  which  can  be  used  to  settle  the  problem  of  special  structure  in  time 
series  clustering.  This  method  leverages  SVD  to  obtain  memory  features  of  time  series  and 
cluster  these  features  by  canopy  and  K-means.  Tamura [7]  proposed  a  two-stage  clustering 
method.  In  the  first  stage,  the  one-pass  k-median++  method  is  used  to  gain  the  initial 
clustering centers, but not iterating. And clustering is carried out in the second stage. Xu [8] 
made  a  reduction  of  the  dimensions  of  feature  space  for  ICU  data,  and  segmented  the  time 
series by  time  segmentation  technology.  This  method  was  applied to prediction  of mortality. 
Wang  [9]  intercepted  the  large  scale  time  series  into  sub  ones,  and  each  sub  sequence  was 
represented  as  a  group  of  coarse  granularity  fuzzy  information.  As  a  result,  the  original 
problem  cab  be  converted  from  numeric  level  to  granular  level  and  achieve  more  effective 
clustering. 
r 
e
e
o
P
r 
R
e
  Regarding the time series forecasting models and methods, Ching-Hsue Cheng [10] built a 
time  series  model  based  on  indicators  selection  through  applying  multivariate  adaptive 
regression  splines  and  stepwise  regression.  Further,  a  forecasting  model  was  established  by 
SVR and optimized by GA. Ching-Hsue Cheng [11] also proposed a rough set rule induction 
method, which was used to predict the stock price. Winita Sulandari [12] presented a hybrid 
time  series  model  based  on  moving  average  and  weighted  fuzzy.  The  model  was  used  to 
enhance the accuracy of the trend forecasting of time series. Bindu Garg [13] also established 
a predicting  model based  on fuzzy  time  series. The model focused  on  the  influence  of  trend 
and seasonal components, and was used to forecast the trend in fuzzy environment. Zhibo Zhu 
[14]  introduced  a  stock  trend  analysis  method  based  on  feature  simplification.  The  method 
firstly  utilized  the  local  least  square  method  to  arrange  the  feature,  and  then  made  the 
selection of features. And this method can be used to trend predicting of both micro stock data 
and macro stock market. 
v
i
e
 
w
O
  Most above methods lay emphasis on extracting time sequence features and transforming 
continuous  time  series  data  to  a  combination  of  extracted  features.  This  often  leads  to  data 
loss in calculation process, resulting in lower effectiveness in describing the nature as well as 
lower  efficiency  in  forecasting,  especially  for  large  multivariate  time  series.  In  addition, 
although  clustering  is  widely  used,  the pattern  computing  efficiency  still  faces  challenges  in 
dealing  with  large  multivariate  time  series.  The  paper  proposes  a  sliding  window  based 
multi-stage  clustering  approach  towards  multivariate  time  series  by  using  dynamic  sliding 
time  windows  (DSTW).  The  segmented  multivariate  time  series  are  clustered  separately  in 
each  time  window  to  product  first  stage  clustering  centers,  and  which  are  used  to  generate 
second  stage  clustering  results  involving  all  time  windows.  The  method  can  simplify  large 
scale  multivariate  time  series  mining  problems  by  multi-stage  clustering  on  multiple  sliding 
n
l
y
URL: http:/mc.manuscriptcentral.com/gscs
Page 3 of 14
Journal of Statistical Computation and Simulation
1
2
3
4
5
6
7
8
9
10
11
12
13
14
15
16
17
18
19
20
21
22
23
24
25
26
27
28
29
30
31
32
33
34
35
36
37
38
39
40
41
42
43
44
45
46
47
48
49
50
51
52
53
54
55
56
57
58
59
60
 
time  windows,  thus  achieve  improved  efficiency.  Based  on  the  clustering  outcomes,  a 
correlation  rules  mining method  is  given  to  discover  frequent patterns  in the time  series and 
generate  association  rules.  Then,  the  paper  presents  a  probabilistic  forecasting  model  that 
leverages  the  extracted  rules  to  make  short  term  predictions.  Finally,  the  experiments  are 
presented to show the efficiency and effectiveness of the proposed approach. 
The rest of the paper is organized as follows. Section 2 presents the multi-stage clustering 
method using DSTW. Section 3 discusses the forecasting model based on rules by clustering. 
Section 4 gives experiments that verify the proposed approach. Section 5 concludes the work.   
2.  Multi-Stage Clustering Method Using DSTW For Multivariate Time Series 
F
In this section, we present the multi-stage clustering method based on DSTW for multivariate 
time series data.   
o
r 
2.1.  Fuzzy Centers Selection Method For Multivariate Time Series 
P
e
  We improve the clustering algorithm based on K-means [15] to adapt it to multivariate time 
series. 
 
e
The steps of    K-means algorithm are described as follows. 
    (1) Select k elements from the data source as initial centers. 
r 
R
{
}
e
,
1
2
µ µ µ µ µ                                                           (1) 
,...,
3
=
,
k
    (2) Calculate the distance between each element and centers, then divide the elements to 
v
i
corresponding clusters according to the minimum distance. 
−
e
  [16]                                            (2) 
=
: arg min
x µ
j
c
( )
i
( )
i
2
j
    (3) Recalculate the mean value of each cluster. 
w
µ
j
=
:
i
m
( )
i
∑
∑
{
c
1
=
1
{
m
c
1
=
1
i
=
( )
i
( )
i
}
j x
}
=
j
 
  [17]                                            (3) 
O
n
l
y
    (4) Calculate the standard measuring function, and the algorithm would be terminated once 
certain conditions were met such as converging to one point, otherwise the process should 
return to step (2). 
  As the clustering objects focus on multivariate time series typically represented by a set of 
curves rather than points, we improve the algorithm by incorporating features of the multiple 
temporal curves to adapt it to multivariate time series mining. The improvements mainly 
include two aspects as follows. 
  (1) Initial centers selection 
  Initial centers selection has a crucial impact the results of algorithm. Random selection of 
initial centers is a common way, but which usually leads to unsatisfied results of clustering. In 
addition, improper selection of initial centers typically results in superfluous iterations costing 
too much computing time. An optimization strategy is running multiple times and choosing a 
group of different random centers at each run, then selecting the clusters with minimum 
URL: http:/mc.manuscriptcentral.com/gscs
1
2
3
4
5
6
7
8
9
10
11
12
13
14
15
16
17
18
19
20
21
22
23
24
25
26
27
28
29
30
31
32
33
34
35
36
37
38
39
40
41
42
43
44
45
46
47
48
49
50
51
52
53
54
55
56
57
58
59
60
Journal of Statistical Computation and Simulation
Page 4 of 14
 
quadratic sum of variance. This strategy is simple and the results depend on the number of 
clusters as well as data set. Another strategy is to select the successive initial center that 
farthest from the previous initial centers already selected. This method can guarantee that the 
selected initial centers are randomly scattered, but outliers may be chosen. 
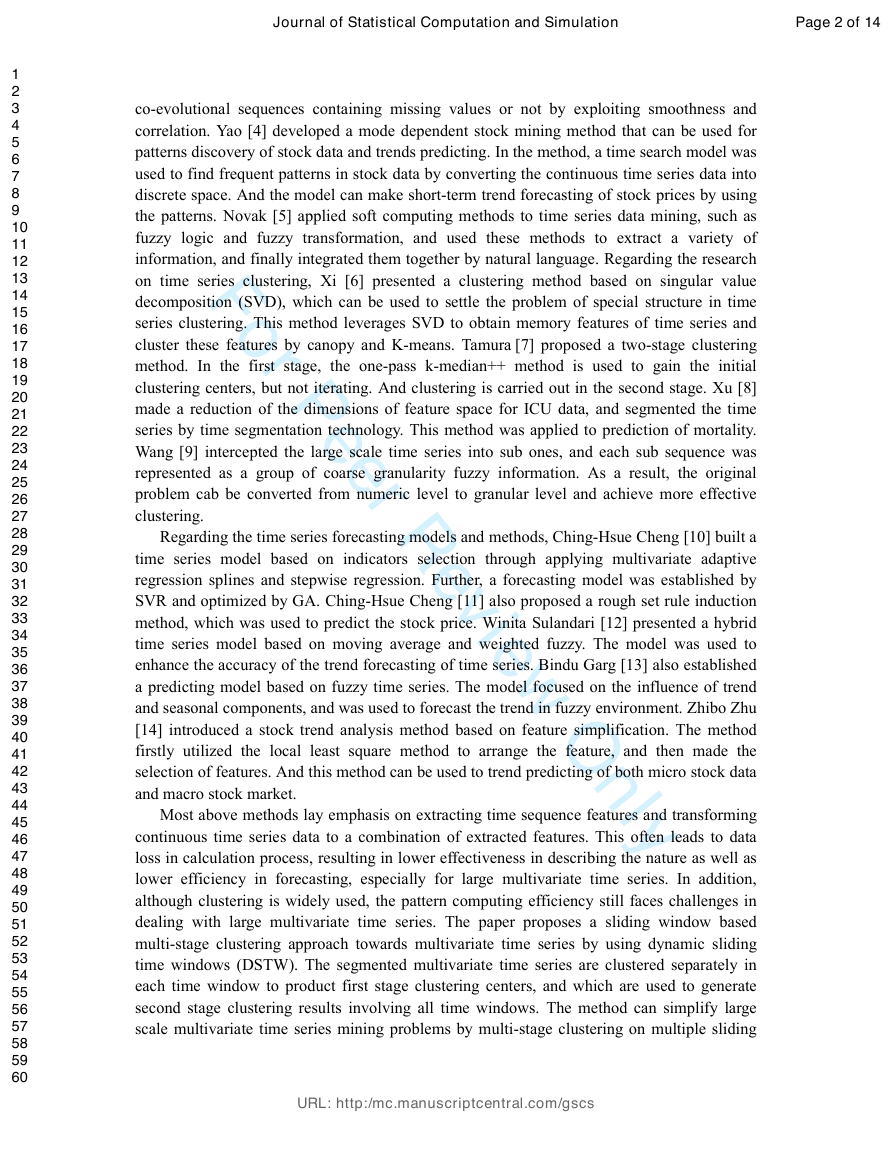
We integrate two optimization strategies above and make further improvement. Figure 
1shows the improved process of initial centers selection. The first center is selected randomly 
from source data set and added to a special collection used for storing centers. Then in the 
process of successive centers selection, once an element is selected randomly, the distance 
between the element and each existing centers will be calculated. The element could be 
confirmed as an initial center and added to the collection if the distance met predefined 
threshold. Otherwise, the successive center selection should be continued until the collection 
was filled up. The above process would be running multiple times, and the cluster with 
minimum quadratic sum of variance should be selected. 
F
o
r 
P
e
e
r 
R
e
v
i
e
w
 
O
n
l
y
Figure 1.    Initial centers selection method 


  (2) Reselection of centers 
  Since common mathematical methods such as average calculation are not suitable for time 
URL: http:/mc.manuscriptcentral.com/gscs
Page 5 of 14
Journal of Statistical Computation and Simulation
1
2
3
4
5
6
7
8
9
10
11
12
13
14
15
16
17
18
19
20
21
22
23
24
25
26
27
28
29
30
31
32
33
34
35
36
37
38
39
40
41
42
43
44
45
46
47
48
49
50
51
52
53
54
55
56
57
58
59
60
 
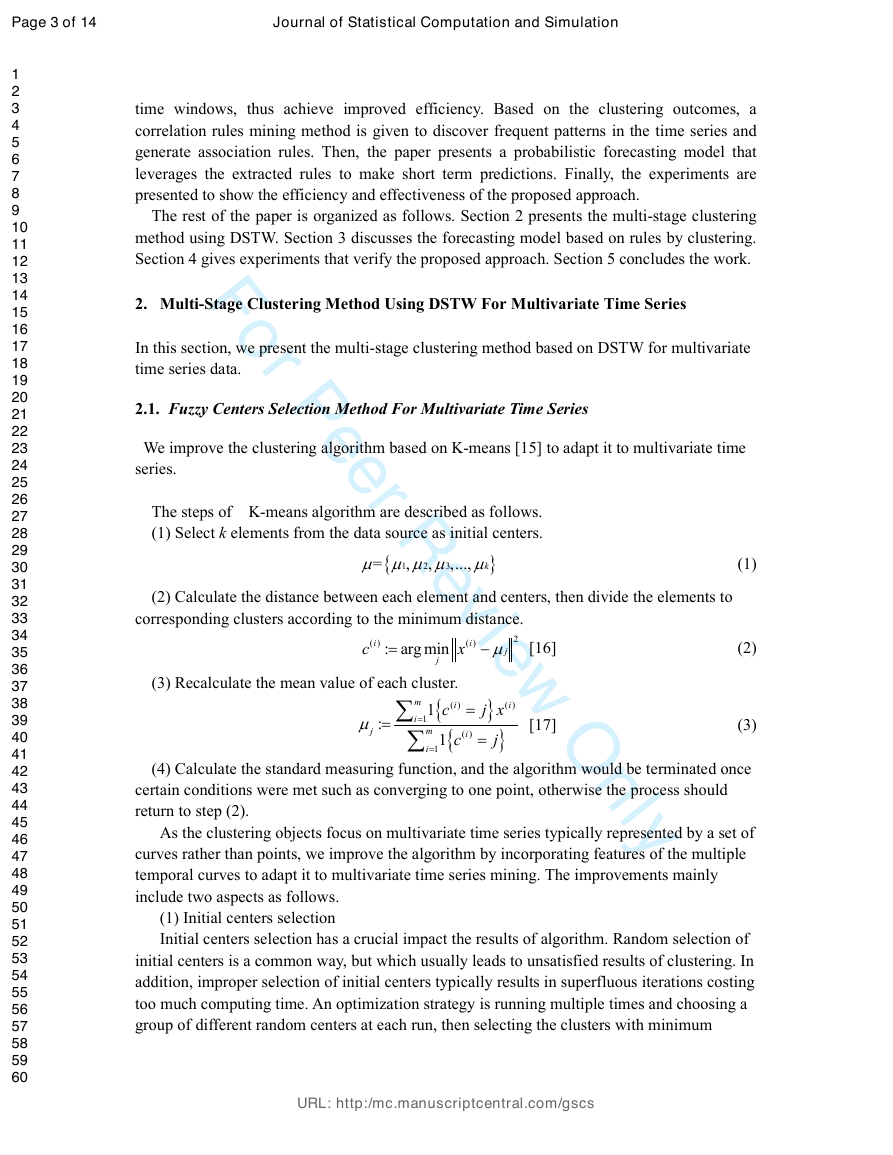
series data elements clustering, we present centers reselection method for time series. As 
shown in Figure 2 is the method which assumes that the initial centers should be selected 
appropriately with small computing error in clustering process, and the elements in the cluster 
could be relatively close to current center. The method traverses twice the clusters that need 
reselection of centers, computing the distance between each element and other ones. Once 
over 50% of the distances are within the scope of preset threshold, the element is chosen as 
new center. If no elements could meet the threshold conditions, the initial center of this cluster 
should be regarded as improper choice, and a new element would be selected randomly as a 
new center.   
F
o
r 
P
e
e
r 
R
e
 
Figure 2.    Selection method of new center 
v
i
e
 
2.2.  First-stage Clustering Within Time Windows 
w
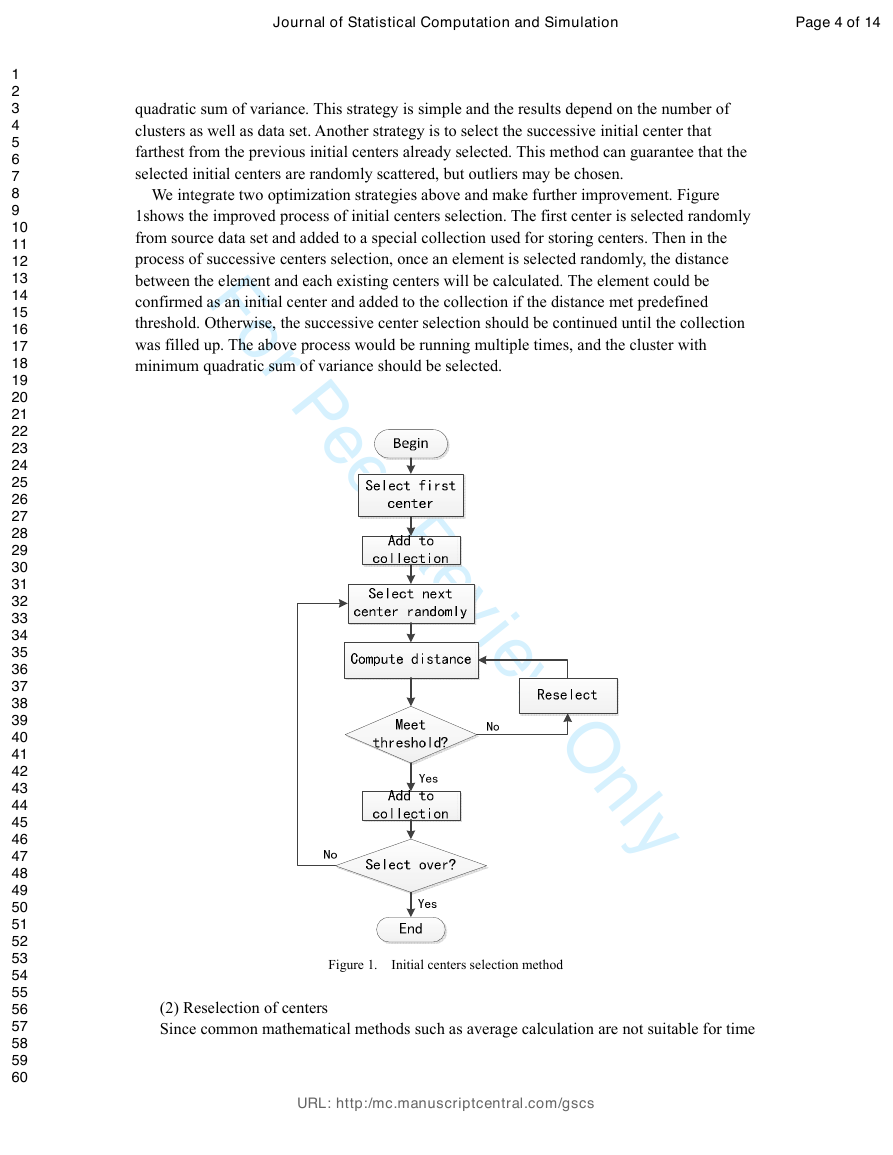
    Multivariate time series should be divided into segments before perform clustering in 
 
time windows. Based on sliding time windows [18,19], dynamic sliding time windows enable 
dynamic variety of time windows by configuring the parameters during the segmentation 
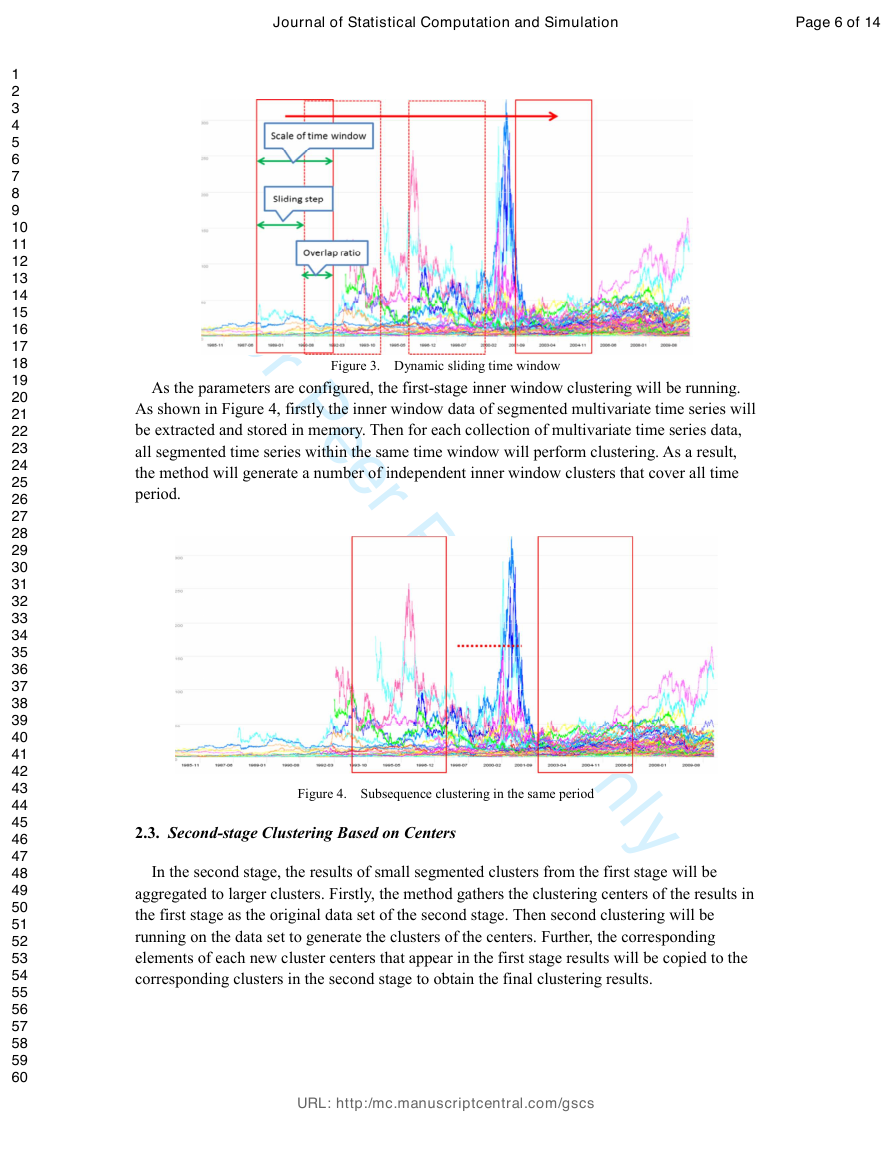
process. Figure 3 shows the principle of DSTW. The key variables involve the size as well as 
sliding step-length of time windows for data partitioning.   
O
n
l
y
The size configuration of time windows has an essential impact on computational 
efficiency. Because we use the dynamic time warping (DTW) distance [20, 21] to compute 
the distances between multivariate time series, it is not necessary to make segments with 
equal length. Actually the overall trend of a segment is more important. Instead, the size of 
time windows can be set to a range [22]. One important thing to note is that too big distance 
between segments should be avoided because it could not make sense. In our method, the 
fluctuation range is set to 1~1.3 times of the initial window size. In addition, the sliding step 
also has critical influence on clustering results. Too small steps could lead to redundant 
repetitive computation because of overlapping of cross-window time series data sets.   
 
URL: http:/mc.manuscriptcentral.com/gscs
1
2
3
4
5
6
7
8
9
10
11
12
13
14
15
16
17
18
19
20
21
22
23
24
25
26
27
28
29
30
31
32
33
34
35
36
37
38
39
40
41
42
43
44
45
46
47
48
49
50
51
52
53
54
55
56
57
58
59
60
Journal of Statistical Computation and Simulation
Page 6 of 14
 
F
o
r 
Figure 3.    Dynamic sliding time window 
 
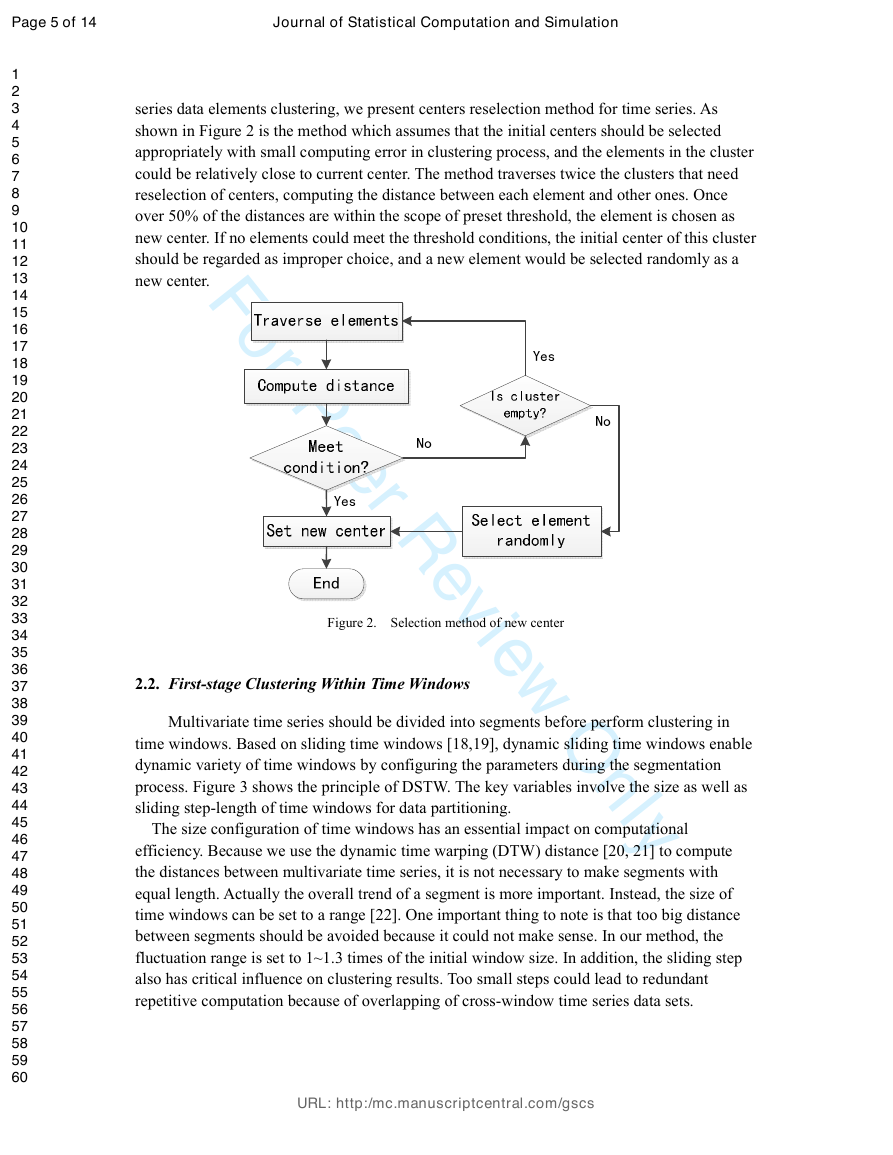
As the parameters are configured, the first-stage inner window clustering will be running. 
P
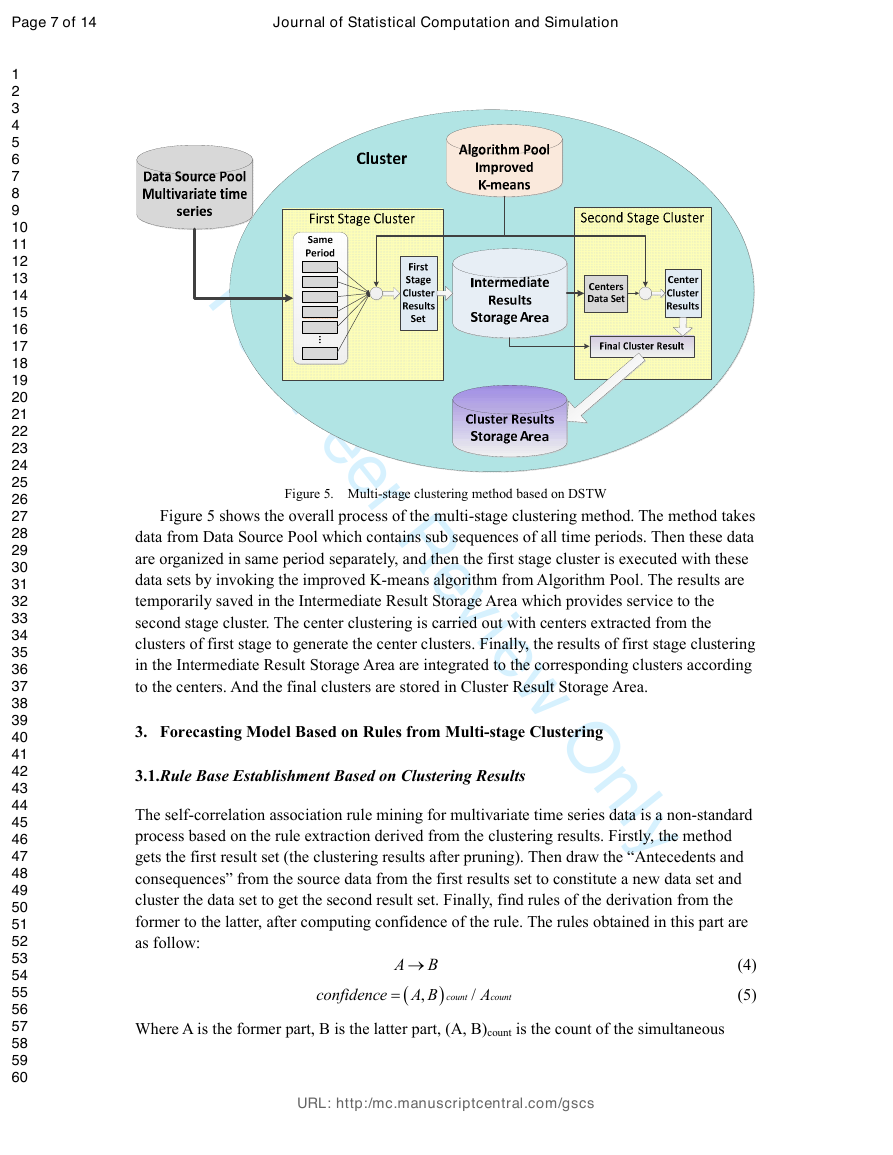
As shown in Figure 4, firstly the inner window data of segmented multivariate time series will 
be extracted and stored in memory. Then for each collection of multivariate time series data, 
all segmented time series within the same time window will perform clustering. As a result, 
the method will generate a number of independent inner window clusters that cover all time 
period. 
e
e
r 
 
R
e
v
i
e
w
 
O
Figure 4.    Subsequence clustering in the same period 
2.3.  Second-stage Clustering Based on Centers 
 
n
l
y
In the second stage, the results of small segmented clusters from the first stage will be 
aggregated to larger clusters. Firstly, the method gathers the clustering centers of the results in 
the first stage as the original data set of the second stage. Then second clustering will be 
running on the data set to generate the clusters of the centers. Further, the corresponding 
elements of each new cluster centers that appear in the first stage results will be copied to the 
corresponding clusters in the second stage to obtain the final clustering results.   
 
URL: http:/mc.manuscriptcentral.com/gscs
Page 7 of 14
Journal of Statistical Computation and Simulation
1
2
3
4
5
6
7
8
9
10
11
12
13
14
15
16
17
18
19
20
21
22
23
24
25
26
27
28
29
30
31
32
33
34
35
36
37
38
39
40
41
42
43
44
45
46
47
48
49
50
51
52
53
54
55
56
57
58
59
60
 
F
o
r 
P
e
 
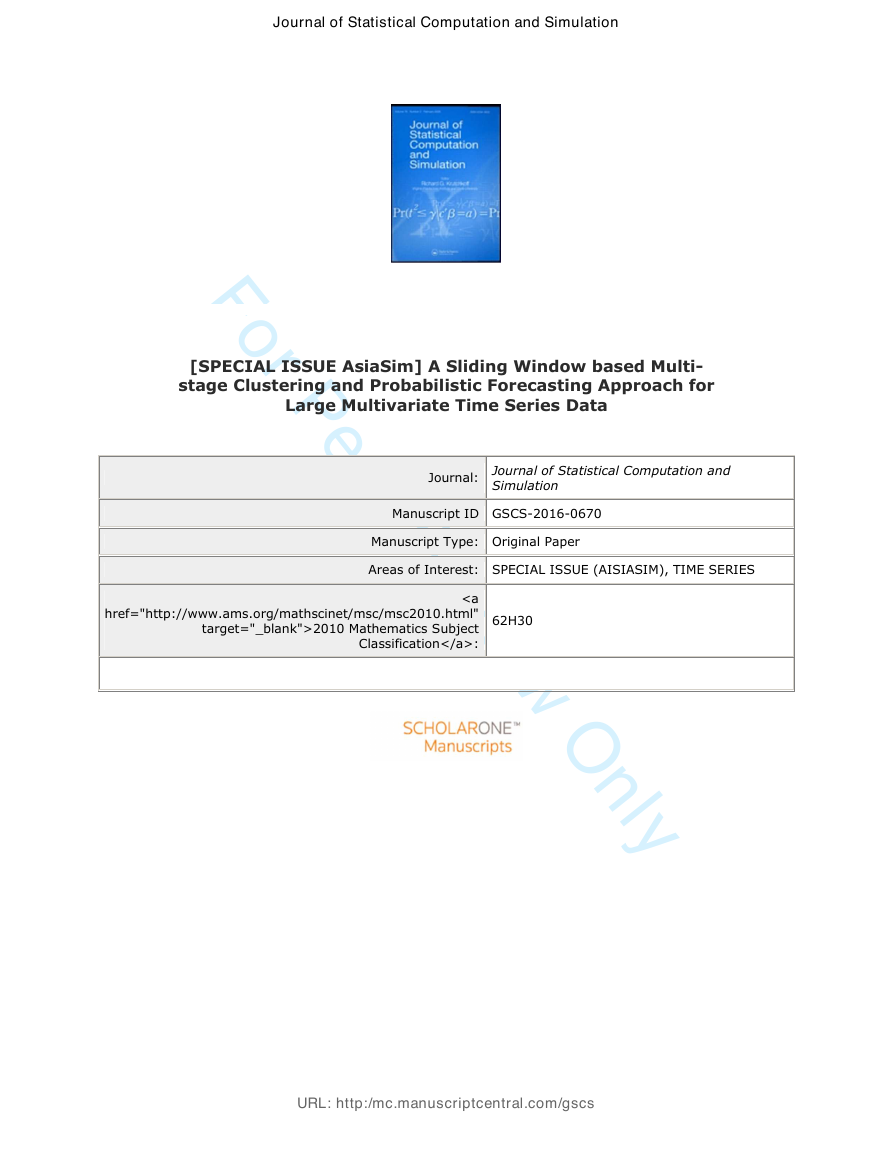
Figure 5.    Multi-stage clustering method based on DSTW 
e
r 
R
  Figure 5 shows the overall process of the multi-stage clustering method. The method takes 
data from Data Source Pool which contains sub sequences of all time periods. Then these data 
are organized in same period separately, and then the first stage cluster is executed with these 
data sets by invoking the improved K-means algorithm from Algorithm Pool. The results are 
temporarily saved in the Intermediate Result Storage Area which provides service to the 
second stage cluster. The center clustering is carried out with centers extracted from the 
clusters of first stage to generate the center clusters. Finally, the results of first stage clustering 
in the Intermediate Result Storage Area are integrated to the corresponding clusters according 
to the centers. And the final clusters are stored in Cluster Result Storage Area. 
v
i
e
e
w
3.  Forecasting Model Based on Rules from Multi-stage Clustering 
 
O
3.1.Rule Base Establishment Based on Clustering Results 
n
l
y
The self-correlation association rule mining for multivariate time series data is a non-standard 
process based on the rule extraction derived from the clustering results. Firstly, the method 
gets the first result set (the clustering results after pruning). Then draw the “Antecedents and 
consequences” from the source data from the first results set to constitute a new data set and 
cluster the data set to get the second result set. Finally, find rules of the derivation from the 
former to the latter, after computing confidence of the rule. The rules obtained in this part are 
as follow: 
A
B→                                                                         (4) 
         
confidence
=
(
A B
,
)
count
/
A
count
                                                      (5) 
Where A is the former part, B is the latter part, (A, B)count is the count of the simultaneous 
URL: http:/mc.manuscriptcentral.com/gscs