在 Python 股票交易策略画图中标记买卖点
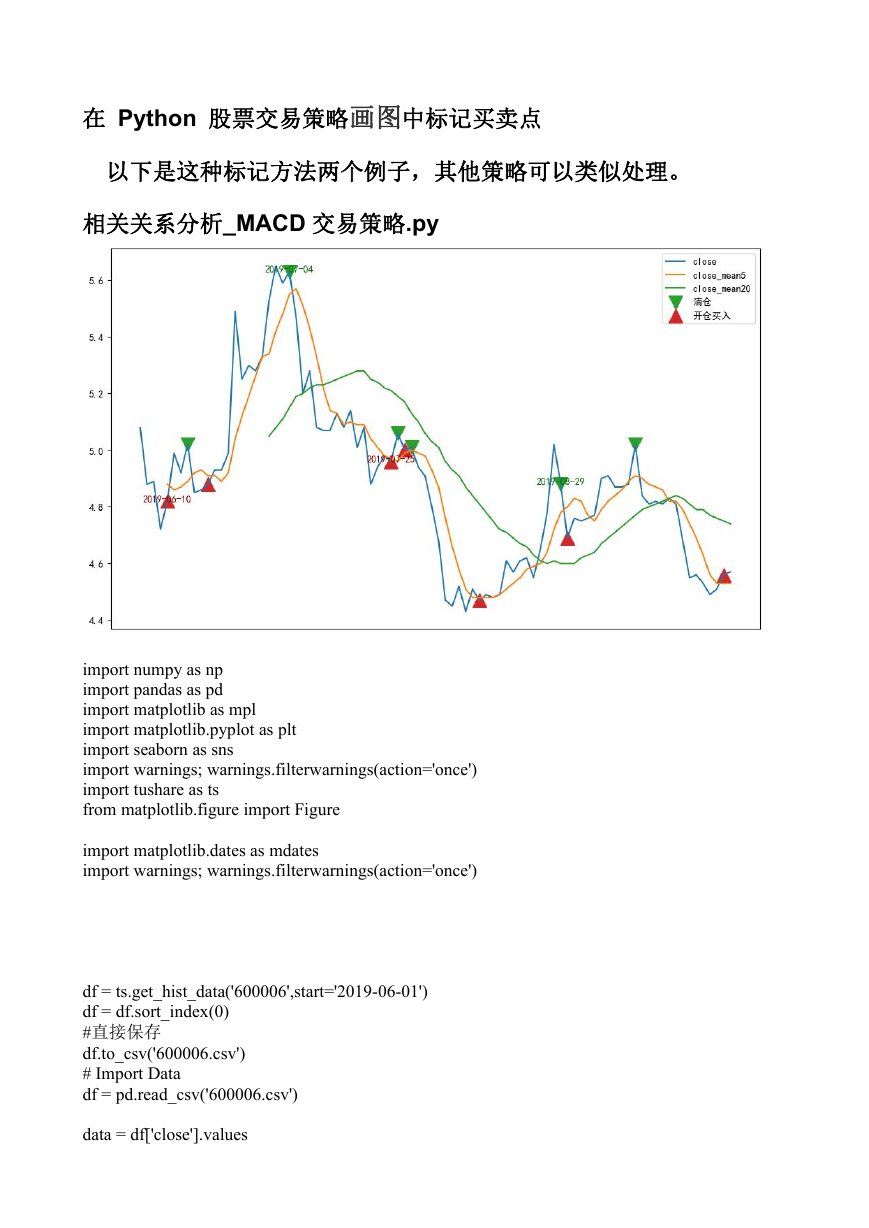
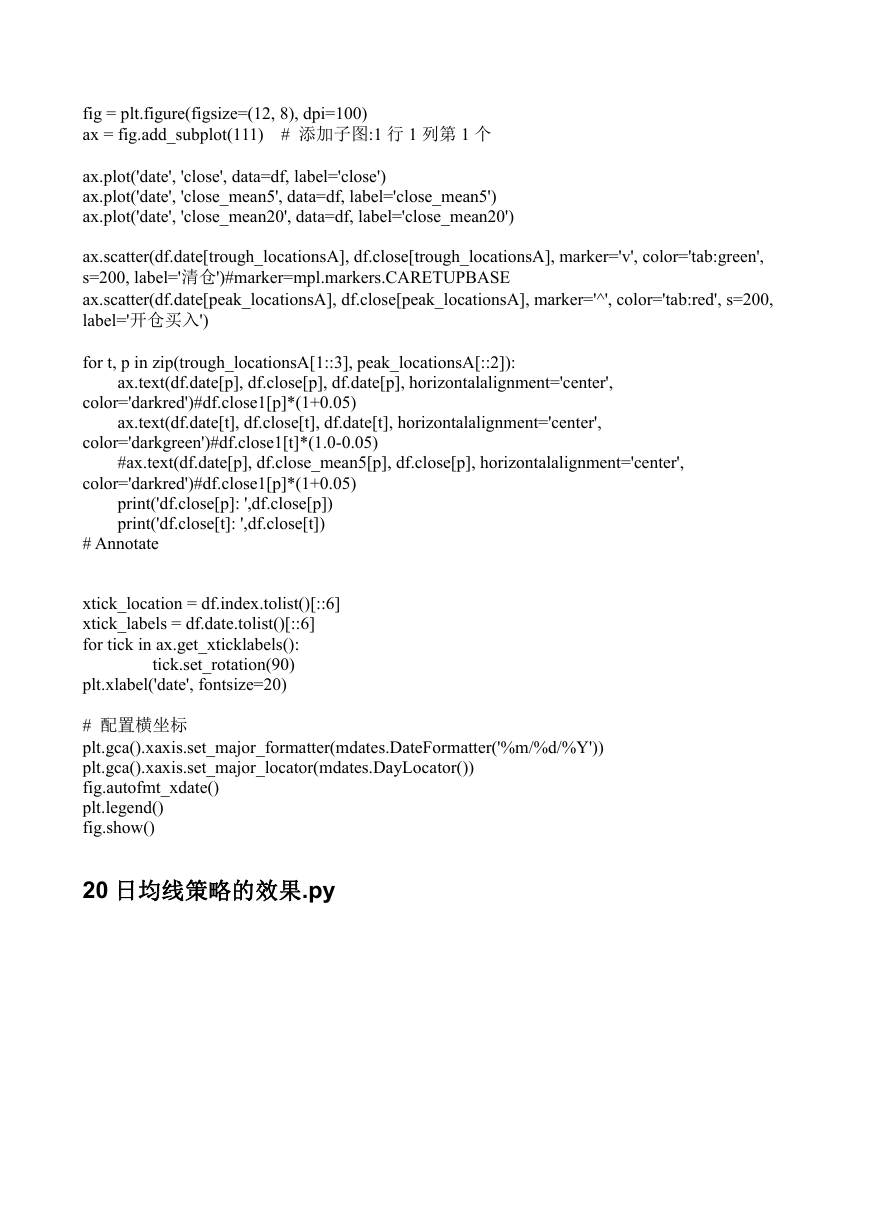
以下是这种标记方法两个例子,其他策略可以类似处理。
相关关系分析_MACD 交易策略.py
import numpy as np
import pandas as pd
import matplotlib as mpl
import matplotlib.pyplot as plt
import seaborn as sns
import warnings; warnings.filterwarnings(action='once')
import tushare as ts
from matplotlib.figure import Figure
import matplotlib.dates as mdates
import warnings; warnings.filterwarnings(action='once')
df = ts.get_hist_data('600006',start='2019-06-01')
df = df.sort_index(0)
#直接保存
df.to_csv('600006.csv')
# Import Data
df = pd.read_csv('600006.csv')
data = df['close'].values
�
doublediff = np.diff(np.sign(np.diff(data)))
print('doublediff',doublediff)
peak_locations = np.where(doublediff == -2)[0] + 1
doublediff2 = np.diff(np.sign(np.diff(-1*data)))
trough_locations = np.where(doublediff2 == -2)[0] + 1
#print('doublediff2',doublediff2)
#print('trough_locations',trough_locations)
def get_EMA(df,N):
for i in range(len(df)):
if i==0:
if i>0:
df.loc[i,'ema']=df.loc[i,'close']
ema=list(df['ema'])
return ema
def get_MACD(df,short=12,long=26,M=9):
a=get_EMA(df,short)
b=get_EMA(df,long)
df['diff']=pd.Series(a)-pd.Series(b)
#print(df['diff'])
for i in range(len(df)):
if i==0:
if i>0:
df.loc[i,'dea']=df.loc[i,'diff']
df['macd']=2*(df['diff']-df['dea'])
return df
macd1=get_MACD(df,12,26,9)
#print(get_MACD(df,12,26,9).info())
df.loc[i,'ema']=(2*df.loc[i,'close']+(N-1)*df.loc[i-1,'ema'])/(N+1)
df.loc[i,'dea']=(2*df.loc[i,'diff']+(M-1)*df.loc[i-1,'dea'])/(M+1)
single = np.diff(np.sign(np.diff(df['diff'])))
',single)
print('single
peak_locationsA = np.where(single== 2)[0] + 1
trough_locationsA = np.where(single== -2)[0] + 1
print('trough_locationsA ',trough_locationsA)
print('peak_locationsA ',peak_locationsA)
df['close_mean5']=np.round(df['close'].rolling(window=5,center=False).mean(),2)
df['close_mean20']=np.round(df['close'].rolling(window=20,center=False).mean(),2)
df['close_m5-20']=df['close_mean5']-df['close_mean20']
df['diff']=np.sign(df['close_mean5']-df['close_mean20'])
df['signal'] = np.sign(df['diff'] - df['diff'].shift(1))
#print('df[signal]',df['signal'])
cross_up=np.where(df['signal'] == 1)[0] + 1
cross_down=np.where(df['signal'] == -1)[0] + 1
print('df[cross_down]',cross_down)
print('df[cross_up]',cross_up)
# Draw Plot
�
fig = plt.figure(figsize=(12, 8), dpi=100)
ax = fig.add_subplot(111) # 添加子图:1 行 1 列第 1 个
ax.plot('date', 'close', data=df, label='close')
ax.plot('date', 'close_mean5', data=df, label='close_mean5')
ax.plot('date', 'close_mean20', data=df, label='close_mean20')
ax.scatter(df.date[trough_locationsA], df.close[trough_locationsA], marker='v', color='tab:green',
s=200, label='清仓')#marker=mpl.markers.CARETUPBASE
ax.scatter(df.date[peak_locationsA], df.close[peak_locationsA], marker='^', color='tab:red', s=200,
label='开仓买入')
for t, p in zip(trough_locationsA[1::3], peak_locationsA[::2]):
ax.text(df.date[p], df.close[p], df.date[p], horizontalalignment='center',
color='darkred')#df.close1[p]*(1+0.05)
ax.text(df.date[t], df.close[t], df.date[t], horizontalalignment='center',
color='darkgreen')#df.close1[t]*(1.0-0.05)
#ax.text(df.date[p], df.close_mean5[p], df.close[p], horizontalalignment='center',
color='darkred')#df.close1[p]*(1+0.05)
print('df.close[p]: ',df.close[p])
print('df.close[t]: ',df.close[t])
# Annotate
xtick_location = df.index.tolist()[::6]
xtick_labels = df.date.tolist()[::6]
for tick in ax.get_xticklabels():
tick.set_rotation(90)
plt.xlabel('date', fontsize=20)
# 配置横坐标
plt.gca().xaxis.set_major_formatter(mdates.DateFormatter('%m/%d/%Y'))
plt.gca().xaxis.set_major_locator(mdates.DayLocator())
fig.autofmt_xdate()
plt.legend()
fig.show()
20 日均线策略的效果.py
�
# -*- coding: utf-8 -*-
import numpy as np
import pandas as pd
import matplotlib as mpl
import matplotlib.pyplot as plt
import seaborn as sns
import warnings; warnings.filterwarnings(action='once')
import tushare as ts
from matplotlib.figure import Figure
import matplotlib.dates as mdates
import warnings; warnings.filterwarnings(action='once')
df = ts.get_hist_data('600006',start='2019-06-01')
df = df.sort_index(0)
#直接保存
df.to_csv('600006.csv')
# Import Data
df = pd.read_csv('600006.csv')
data = df['close'].values
df['close_mean5']=np.round(df['close'].rolling(window=5,center=False).mean(),2)
df['close_mean20']=np.round(df['close'].rolling(window=20,center=False).mean(),2)
df['close_m5-20']=df['close_mean5']-df['close_mean20']
df['diff']=np.sign(df['close_mean5']-df['close_mean20'])
df['signal'] = np.sign(df['diff'] - df['diff'].shift(1))
#print('df[signal]',df['signal'])
cross_up=np.where(df['signal'] == 1)[0] + 1
�
cross_down=np.where(df['signal'] == -1)[0] + 1
print('df[cross_down]',cross_down)
print('df[cross_up]',cross_up)
# Draw Plot
fig = plt.figure(figsize=(12, 8), dpi=100)
ax = fig.add_subplot(111) # 添加子图:1 行 1 列第 1 个
#plt.figure(figsize=(16,10), dpi= 80)
ax.plot('date', 'close', data=df, label='close')
ax.plot('date', 'close_mean5', data=df, label='close_mean5')
ax.plot('date', 'close_mean20', data=df, label='close_mean20')
ax.scatter(df.date[cross_down], df.close_mean5[cross_down], marker='v', color='tab:green', s=200,
label='cross_down')#marker=mpl.markers.CARETUPBASE
ax.scatter(df.date[cross_up], df.close_mean20[cross_up], marker='^', color='tab:red', s=200,
label='cross_up')
for t, p in zip(cross_down[1::5], cross_up[::3]):
ax.text(df.date[p], df.close_mean5[p], df.date[p], horizontalalignment='center',
color='darkred')#df.close1[p]*(1+0.05)
ax.text(df.date[t], df.close_mean5[t], df.date[t], horizontalalignment='center',
color='darkgreen')#df.close1[t]*(1.0-0.05)
#ax.text(df.date[p], df.close_mean5[p], df.close[p], horizontalalignment='center',
color='darkred')#df.close1[p]*(1+0.05)
print('df.close_mean5[p]: ',df.close_mean5[p])
print('df.close[t]: ',df.close[t])
# Annotate
#plt.ylim(50,750)
xtick_location = df.index.tolist()[::6]
xtick_labels = df.date.tolist()[::6]
for tick in ax.get_xticklabels():
tick.set_rotation(90)
#fig.xticks(ticks=xtick_location, labels=xtick_labels, rotation=45, fontsize=12, alpha=.7)
#plt.title("Peak and Troughs of 600006", fontsize=22)
#fig.yticks(fontsize=12, alpha=.7)
plt.xlabel('', fontsize=20)
# 配置横坐标
plt.gca().xaxis.set_major_formatter(mdates.DateFormatter('%m/%d/%Y'))
plt.gca().xaxis.set_major_locator(mdates.DayLocator())
fig.autofmt_xdate()
plt.legend()
fig.show()
欢迎转载,不需要注明来处,python 是自由软件,由它派生
出来的东西也没有必要私藏起来
xie380205 2019-10-13
�


 2023年江西萍乡中考道德与法治真题及答案.doc
 2012年重庆南川中考生物真题及答案.doc
 2013年江西师范大学地理学综合及文艺理论基础考研真题.doc
 2020年四川甘孜小升初语文真题及答案I卷.doc
 2020年注册岩土工程师专业基础考试真题及答案.doc
 2023-2024学年福建省厦门市九年级上学期数学月考试题及答案.doc
 2021-2022学年辽宁省沈阳市大东区九年级上学期语文期末试题及答案.doc
 2022-2023学年北京东城区初三第一学期物理期末试卷及答案.doc
 2018上半年江西教师资格初中地理学科知识与教学能力真题及答案.doc
 2012年河北国家公务员申论考试真题及答案-省级.doc
 2020-2021学年江苏省扬州市江都区邵樊片九年级上学期数学第一次质量检测试题及答案.doc
 2022下半年黑龙江教师资格证中学综合素质真题及答案.doc