第一部分
GnuPlot 4.6
中文手册 当前修订次数:2
版权
Copyright (C) 1986 - 1993, 1998, 2004, 2007 Thomas Williams, Colin Kelley
Permission to use, copy, and distribute this software and its
documentation for any purpose with or without fee is hereby granted,
provided that the above copyright notice appear in all copies and
that both that copyright notice and this permission notice appear in
supporting documentation.
Permission to modify the software is granted, but not the right
to distribute the complete modified source code. Modifications are
to be distributed as patches to the released version. Permission to
distribute binaries produced by compiling modified sources is
granted, provided you
1. distribute the corresponding source modifications from the
released version in the form of a patch file along with the
binaries,
2. add special version identification to distinguish your version
in addition to the base release version number,
3. provide your name and address as the primary contact for the
support of your modified version, and
4. retain our contact information in regard to use of the base
software.
Permission to distribute the released version of the source code
along with corresponding source
�
modifications
in the form of a patch file is granted with same provisions 2
through 4 for binary distributions.
作者
Original Software:
Thomas Williams,
Colin Kelley.
Gnuplot 2.0 additions:
Russell Lang, Dave Kotz, John Campbell.
Gnuplot 3.0 additions:
Gershon Elber and many others.
Gnuplot 4.0 additions:
See list of contributors at head of this document.
译者:三寸断梁
前言
本文档针对 4.6 版手册翻译了全文大约%85 的内容,终端部分从略。本手册是本人空闲时间学习
gnuplot 而翻译,疏漏难免。不保证含义准确,仅供参考。若发现手册中有错误可以报告:
gnuplot_cn_manual@126.com ,邮件主题必须以"gnuplot: " 开始,否则系统不接收,成功后你可以
收到自动回复的邮件。
Gnuplot 是一个小巧的命令行绘图工具,运行于 LINUX ,OS/2,MS Windows,VMS 等等其它平台。
它的源代码开放。它最初被设计为科学家或学生交互式创建函数图像和数据图表。但是现在它也作为一
个绘图引擎用于其它程序,octave 是一个例子。
Gnuplot 支持多种类型的绘图,2D 和 3D。它能利用线段,点,直方图,或者其它元素绘制你需要的
图形。同时你可以在图形中添加一些文本。
Gnuplot 支持多种类型的输出类型:交互式屏幕终端(鼠标、键盘),直接输出多种文件格式
(png,jpg,LaTeX,pdf,postscript)或者现代打印机。Gnuplot 很容易扩展去支持新的输出类型。最新
的支持有基于 wxWidgets 的交互终端,QT。将输出 web 页面可以使用 svg 或者 HTML5 canvas 输出类型。
Gnuplot 是大小写敏感的。所有的命令名和关键字在它无歧义时可以缩写 1。在命令尾部使用分号可
以让多条命令出现在同一行。字符串可以用双引号或单引号括主,有少许不同。
1 plot "data" using 1:2 with lines; 可以缩写为: plot "data" u 1:2 w l;
�
如果一条命令太长可以在末尾使用反斜线后在下一行继续(反斜线必须是此行的最后一个字符):
plot sin(x),f2(x),f3(x),\
f4(x),f5(x);
但是如果发生错误,命令解析器无法准确定位到出错的行。在本文中花括号用于表示可选参数,管
道符号用于分割一些可选选项。<>用于表示可认为更改的部分。
Gnuplot 在命令行上使用 gnuplot {OPTIONS} file1 file2. … ; 启动。对于 X11 系统 可以使用:gnuplot
{X11OPTIONS} {OPTIONS} file1 file2 ... 具体查阅 X11 的文档。
命令行中的选项可以出现在行的任何地方,文件名将按顺序依次执行。
- 作为文件名,让 gnuplot 从标准输入读取。
新特性
本节介绍 4.4 版本以来主要的附加功能。详见 NEWS 文件。
新语法
这个版本的 gnuplot 新增了佚代指令,和块结构(if else while do)详见后文。简单的佚代指令可以在 plot
set 命令中使用。例如:
set multiplot layout 2,2
100 term Fourier series
fourier(k, x) = sin(3./2*k)/k * 2./3*cos(k*x)
do for [power = 0:3] {
TERMS = 10**power
set title sprintf("%g term Fourier series",TERMS)
plot 0.5 + sum [k=1:TERMS] fourier(k,x) notitle
}
nset multiplot
本地化的 linetypes 用户设置
你可以设置默认的 linetype,详见set linetype。这通常在启动文件中设置。
新的 plot styles
查看 plot styles :boxplot,circles,ellipses 的文档。
�
翻转坐标轴
坐标轴现在可以不使用 x y 命名。详情查看 set polar and set rrange
新的平滑算法
新的算法支持 2d 3d 绘制。smooth kdensity 或者 smooth cumulative 同 plot 指令同时使用。
新的时间和日期处理
Gnuplot 现在使用毫秒(千分之一秒)精度。时间数据必须被格式化成规定格式。内建函数 time()返
回当前系统时间。例如输出时间:
print strftime("%H:%M:%.3S %d-%b-%Y",time(0.0))
18:15:04.253 16-Apr-2011
数据统计汇总
新命令 stats 从文件读取数据,使用 plot 相同的语法。并且输出统计汇总,包括最大值,最小值,众数,
平均值,标准差,关联性。等等。
反向兼容
Gnuplot 4.0 摒弃了旧版本中的部分语法。但是仍然对它们提供了支持。需要在编译时提供支
持:./configure --enable-backwards-compatibility 。
Deprecated:
set title "Old" 0,-1
set data linespoints
plot 1 2 4
# horizontal line at y=1
New:
TITLE = "New"
set title TITLE offset char 0, char -1
set style data linespoints
plot 1 linetype 2 pointtype 4
批量处理和交互操作
Gnuplot 既可以从文件读取命令执行,也可以交互运行。使用-e "command" 将执行一个 gnuplot
�
命令。
使用-persist 直接从命令行读取程序。退出后窗体后台保留。
gnuplot -persist -e "set title 'Sine curve'; plot sin(x)"
设置变量影响脚本执行。
gnuplot -e "a=2; s='file.png'" input.gpl
画布尺寸
以前版本 gnuplot,对于某些终端类型使用 set size 命令控制画布大小,而其它终端用其它方法。4.2
版本以来 set size 命令被放弃。4.4 版本几乎所有的终端类型使用同样的语法。
set term size ,
默认情况下,输出将使用整个画布。
set size , 缩放 plot 相对于画布的大小。值小于 1 表示 plot 不使用整个画布。值大于 1
表示 plot 的某一部分将会被显示在画布上。在某些终端类型下值大于 1 会出错。
这个规则的主要例外是,PostScript 驱动。
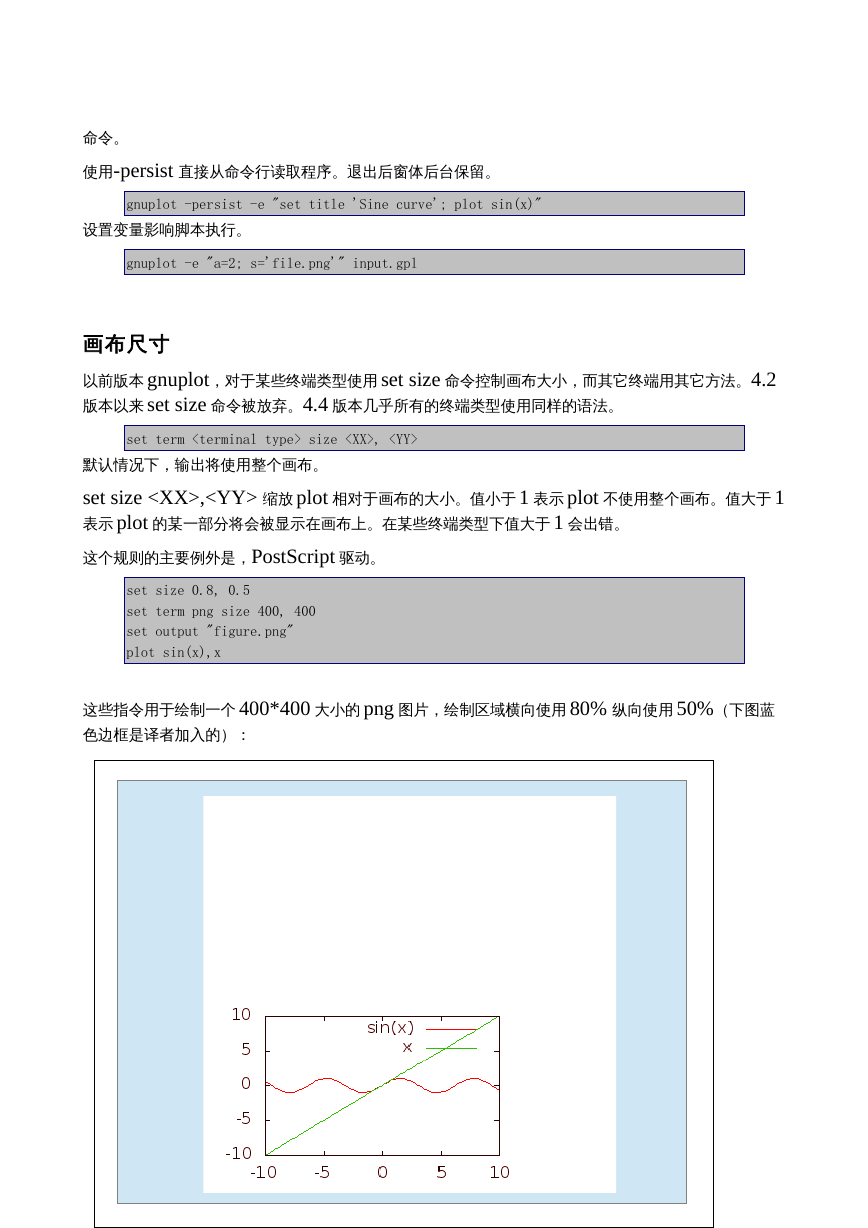
set size 0.8, 0.5
set term png size 400, 400
set output "figure.png"
plot sin(x),x
这些指令用于绘制一个 400*400 大小的 png 图片,绘制区域横向使用 80% 纵向使用 50%(下图蓝
色边框是译者加入的):
�
注释
脚本中的注释 #开始一直到行尾。
数据文件中的注释由 set datafile commentschars 设定,默认为#。
坐标
set arrow, set key, set label 和 set object 命令允许使用坐标作为参数,坐标的表示方法为:
{} , {} {,{} }
可以为 first, second, graph, screen, 或者 character.
First 设置 xyz 值到第一坐标系1,second 设置 xyz 到第二坐标系,graph 设置相对与图像区域的比
例,0,0 代表左底点,1,1 右上点。screen 代表坐标相对与整个画布2, 0,0 代表画布左底点,1,1 画布右
上点。character 关键字,坐标位置决定于字符的宽或高,因此它和当前字体相关。参考:page 7
如果 x 没有指定坐标系,默认使用 first,如果 y 没指定,默认依赖于 x。
某些情况下需要使用相对坐标(例如 set arrow 的第二个参数)。如果给定坐标处于对数坐标系,那么
值被解释为比例因子。例如:
set logscale x
set arrow from 100,5 rto 10,2
箭头从 100,5 指向 1000,7
如果某个轴的数据是日期,那么必须使用满足 set timefmt 格式的字符串。
字符串数据
数据文件现在可以包括字符串数据。字符串可以包括任意可显示字符。
1.000 2.000 "NUM ONE" 2.00
gnuplot 有两个坐标系统参见 24
1
2 画布和图像区域,前者范围大于图像区域。系统在图像区域之外的画布区域为坐标轴注明刻度标签。
�
2,000 1.000 "N. TWO" 3.00
此行数据含有 4 列。
2D 或者 3D plot 指令可以将文本字段自动定位。
plot 'datafile' using 1:2:3 with labels
这些命令将从文件中读取数值作为坐标,将字符串写在指定坐标处。
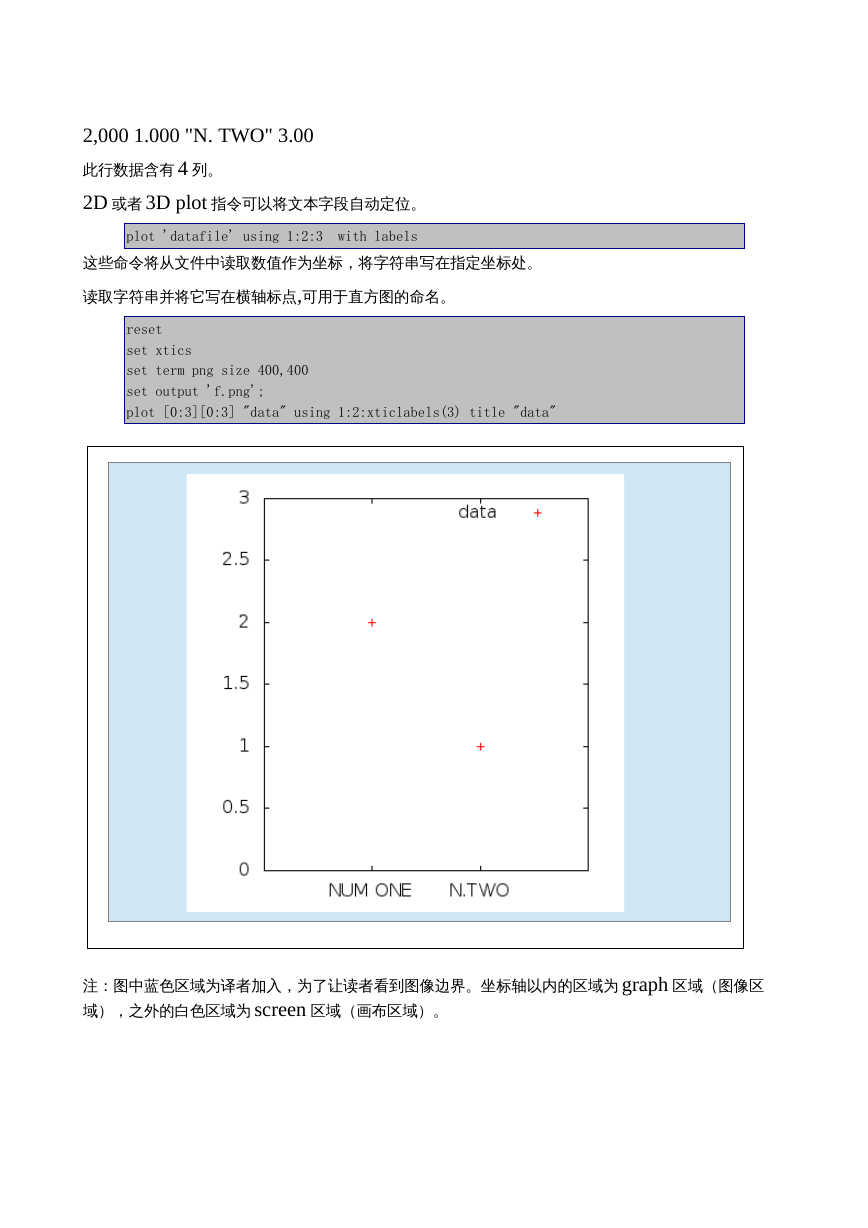
读取字符串并将它写在横轴标点,可用于直方图的命名。
reset
set xtics
set term png size 400,400
set output 'f.png';
plot [0:3][0:3] "data" using 1:2:xticlabels(3) title "data"
注:图中蓝色区域为译者加入,为了让读者看到图像边界。坐标轴以内的区域为 graph 区域(图像区
域),之外的白色区域为 screen 区域(画布区域)。
�
增强文本模式
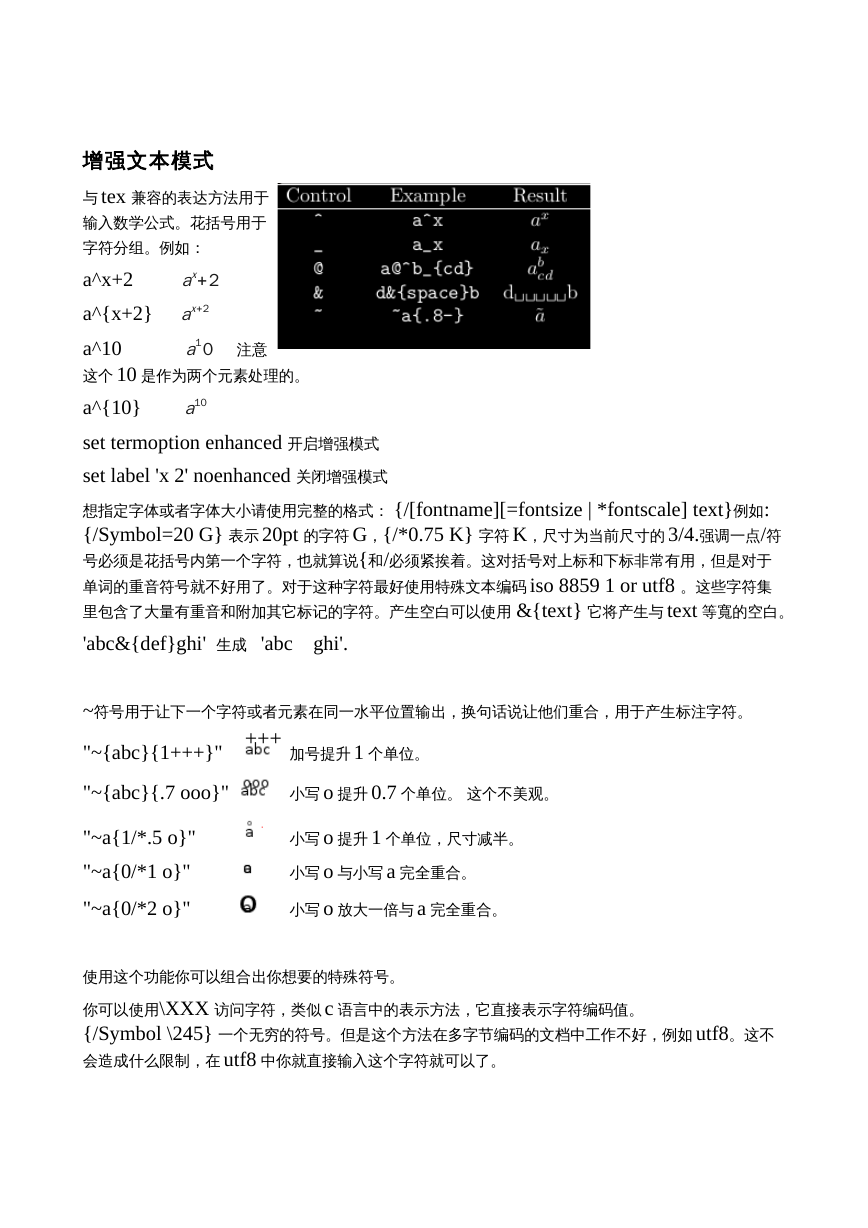
与 tex 兼容的表达方法用于
输入数学公式。花括号用于
字符分组。例如:
a^x+2 ax+2
a^{x+2} ax+2
a^10 a10 注意
这个 10 是作为两个元素处理的。
a^{10} a10
set termoption enhanced 开启增强模式
set label 'x 2' noenhanced 关闭增强模式
想指定字体或者字体大小请使用完整的格式: {/[fontname][=fontsize | *fontscale] text}例如:
{/Symbol=20 G} 表示 20pt 的字符 G,{/*0.75 K} 字符 K,尺寸为当前尺寸的 3/4.强调一点/符
号必须是花括号内第一个字符,也就算说{和/必须紧挨着。这对括号对上标和下标非常有用,但是对于
单词的重音符号就不好用了。对于这种字符最好使用特殊文本编码 iso 8859 1 or utf8 。这些字符集
里包含了大量有重音和附加其它标记的字符。产生空白可以使用 &{text} 它将产生与 text 等寬的空白。
'abc&{def}ghi' 生成 'abc ghi'.
~符号用于让下一个字符或者元素在同一水平位置输出,换句话说让他们重合,用于产生标注字符。
"~{abc}{1+++}"
加号提升 1 个单位。
"~{abc}{.7 ooo}"
小写 o 提升 0.7 个单位。 这个不美观。
"~a{1/*.5 o}"
"~a{0/*1 o}"
"~a{0/*2 o}"
小写 o 提升 1 个单位,尺寸减半。
小写 o 与小写 a 完全重合。
小写 o 放大一倍与 a 完全重合。
使用这个功能你可以组合出你想要的特殊符号。
你可以使用\XXX 访问字符,类似 c 语言中的表示方法,它直接表示字符编码值。
{/Symbol \245} 一个无穷的符号。但是这个方法在多字节编码的文档中工作不好,例如 utf8。这不
会造成什么限制,在 utf8 中你就直接输入这个字符就可以了。
�


 2023年江西萍乡中考道德与法治真题及答案.doc
 2012年重庆南川中考生物真题及答案.doc
 2013年江西师范大学地理学综合及文艺理论基础考研真题.doc
 2020年四川甘孜小升初语文真题及答案I卷.doc
 2020年注册岩土工程师专业基础考试真题及答案.doc
 2023-2024学年福建省厦门市九年级上学期数学月考试题及答案.doc
 2021-2022学年辽宁省沈阳市大东区九年级上学期语文期末试题及答案.doc
 2022-2023学年北京东城区初三第一学期物理期末试卷及答案.doc
 2018上半年江西教师资格初中地理学科知识与教学能力真题及答案.doc
 2012年河北国家公务员申论考试真题及答案-省级.doc
 2020-2021学年江苏省扬州市江都区邵樊片九年级上学期数学第一次质量检测试题及答案.doc
 2022下半年黑龙江教师资格证中学综合素质真题及答案.doc