ARTICLE IN PRESS
Reliability Engineering and System Safety ] (]]]]) ]]]–]]]
Contents lists available at ScienceDirect
Reliability Engineering and System Safety
journal homepage: www.elsevier.com/locate/ress
Dynamic fault tree analysis using Monte Carlo simulation in probabilistic
safety assessment
K. Durga Rao a,�, V. Gopika a, V.V.S. Sanyasi Rao a, H.S. Kushwaha a, A.K. Verma b, A. Srividya b
a Bhabha Atomic Research Centre, Mumbai, India
b Indian Institute of Technology Bombay, Mumbai, India
a r t i c l e i n f o
a b s t r a c t
Article history:
Received 21 July 2007
Received in revised form
22 September 2008
Accepted 24 September 2008
Keywords:
Dynamic fault trees
Markov models
Monte Carlo simulation
Probabilistic safety assessment
Reactor regulation system
Traditional fault tree (FT) analysis is widely used for reliability and safety assessment of complex and
critical engineering systems. The behavior of components of complex systems and their interactions
such as sequence- and functional-dependent failures, spares and dynamic redundancy management,
and priority of failure events cannot be adequately captured by traditional FTs. Dynamic fault tree (DFT)
extend traditional FT by defining additional gates called dynamic gates to model these complex
interactions. Markov models are used in solving dynamic gates. However, state space becomes too large
for calculation with Markov models when the number of gate inputs increases. In addition, Markov
model is applicable for only exponential failure and repair distributions. Modeling test and maintenance
information on spare components is also very difficult. To address these difficulties, Monte Carlo
simulation-based approach is used in this work to solve dynamic gates. The approach is first applied to a
problem available in the literature which is having non-repairable components. The obtained results are
in good agreement with those in literature. The approach is later applied to a simplified scheme of
electrical power supply system of nuclear power plant (NPP), which is a complex repairable system
having tested and maintained spares. The results obtained using this approach are in good agreement
with those obtained using analytical approach. In addition to point estimates of reliability measures,
failure time, and repair time distributions are also obtained from simulation. Finally a case study on
reactor regulation system (RRS) of NPP is carried out to demonstrate the application of simulation-
based DFT approach to large-scale problems.
& 2008 Elsevier Ltd. All rights reserved.
1.
Introduction
Fault tree (FT) analysis has gained wide spread acceptance for
the quantitative reliability and safety analysis. FT is graphical
representation of various combinations of basic failures that lead
to the occurrence of undesirable top event. Starting with the top
event all possible ways for this event to occur are systematically
deduced. The methodology is based on three assumptions: (i)
events are binary events, (ii) events are statistically independent,
and (iii) relationship between events are represented by means of
logical Boolean gates (AND, OR, and Voting). The analysis is
carried out
in two steps: a qualitative step in which the
logical expression of the top event is derived in terms of
prime implicants (the minimal cut-sets); a quantitative step in
which on the basis of the probabilities assigned to the failure
events of the basic components, the probability of occurrence of
the top event is calculated.
� Corresponding author.
E-mail address: durga_k_rao@yahoo.com (K. Durga Rao).
0951-8320/$ - see front matter & 2008 Elsevier Ltd. All rights reserved.
doi:10.1016/j.ress.2008.09.007
The traditional static fault trees with AND, OR, and Voting
gates cannot capture the dynamic behavior of system failure
mechanisms such as sequence-dependent events, spares and
dynamic redundancy management, and priorities of
failure
events.
In order to overcome this difficulty, the concept of
dynamic FTs is introduced by adding sequential notion to the
traditional FT approach. System failures can then depend on
component failure order as well as combination [1]. This is done
by introducing dynamic gates into FTs. With the help of dynamic
gates, system sequence-dependent
failure behavior can be
specified using dynamic FTs that are compact and easily under-
stood. The modeling power of dynamic FTs has gained the
attention of many reliability engineers working on safety critical
systems [2].
Several researchers [1–3] proposed methods to solve dynamic
FTs. Dugan et al. [1,4,5], has shown through a process known as
modularization, it is possible to identify the independent sub-
trees with dynamic gates and to use different Markov model for
each of them. It was applied to computer-based fault tolerant
systems successfully. But, with the increase in the number of basic
elements, there is problem state space explosion. To reduce state
space and minimize the computational
time, an improved
Please cite this article as: Durga Rao K, et al. Dynamic fault tree analysis using Monte Carlo simulation in probabilistic safety
assessment. Reliab Eng Syst Safety (2008), doi:10.1016/j.ress.2008.09.007
�
ARTICLE IN PRESS
2
K. Durga Rao et al. / Reliability Engineering and System Safety ] (]]]]) ]]]–]]]
decomposition scheme where the dynamic sub-tree can be
further modularized (if there exist some independent sub-trees
in it) is proposed by Huang and Chang [6]. Amari et al. [2],
proposed a numerical integration technique for solving dynamic
gates. Though, this method is solving the state-space problem, it
cannot be easily applied for repairable systems. Bobbio et al. [3,7],
proposed Bayesian network-based method to further reduce the
problem of solving dynamic FTs with state-space approach.
Keeping the importance of sophisticated modeling for engineering
systems in dynamic environment, several researches [8–11]
contributed significantly to the development and application of
dynamic FTs.
However, state-space approach for solving dynamic gates
becomes too large for calculation with Markov models when the
number of gate input increases. This is the case especially with
probabilistic safety assessment (PSA) of nuclear power plant (NPP)
where there is large number of cut sets. In addition, Markov
model is applicable for exponential failure and repair distributions
and also modeling test, maintenance information on spare
components is difficult. Many of the methods to solve dynamic
FTs are problem specific and it may be difficult to generalize for all
the scenarios. In order to address some of these limitations of the
above-mentioned methods, Monte Carlo simulation approach is
attempted here to implement dynamic gates. Scenarios which
may often be difficult to solve with analytical solutions are easily
tackled with the Monte Carlo simulation approach. Monte Carlo
simulation-based reliability approach, due to its inherent cap-
ability in simulating the actual process and random behavior of
the system, can eliminate uncertainty in reliability modeling
[12,13]. A software tool, Dynamic Reliability with SIMulation
(DRSIM) is developed to do comprehensive dynamic FT analysis.
Two reliability problems are solved with the tool and found that
results are exactly matching with the analytical approaches. After
validation of the approach, it is extended to a case study on RRS
of NPP.
2. Dynamic fault tree analysis: dynamic gates
Dynamic fault trees (DFTs) introduces four basic (dynamic)
gates: the priority AND (PAND), the sequence enforcing (SEQ), the
standby or spare (SPARE), and the functional dependency (FDEP)
[1]. They are discussed here briefly.
The PAND gate reaches a failure state if all of its input
components have failed in a pre-assigned order (from left to right
in graphical notation). A SEQ gate forces its inputs to fail in a
particular order: when a SEQ gate is found in a DFT, it never
happens that the failure sequence takes place in different orders.
While the SEQ gate allows the events to occur only in a pre-
assigned order and states that a different failure sequence can
never take place, the PAND gate does not force such a strong
assumption: it simply detects the failure order and fails just in one
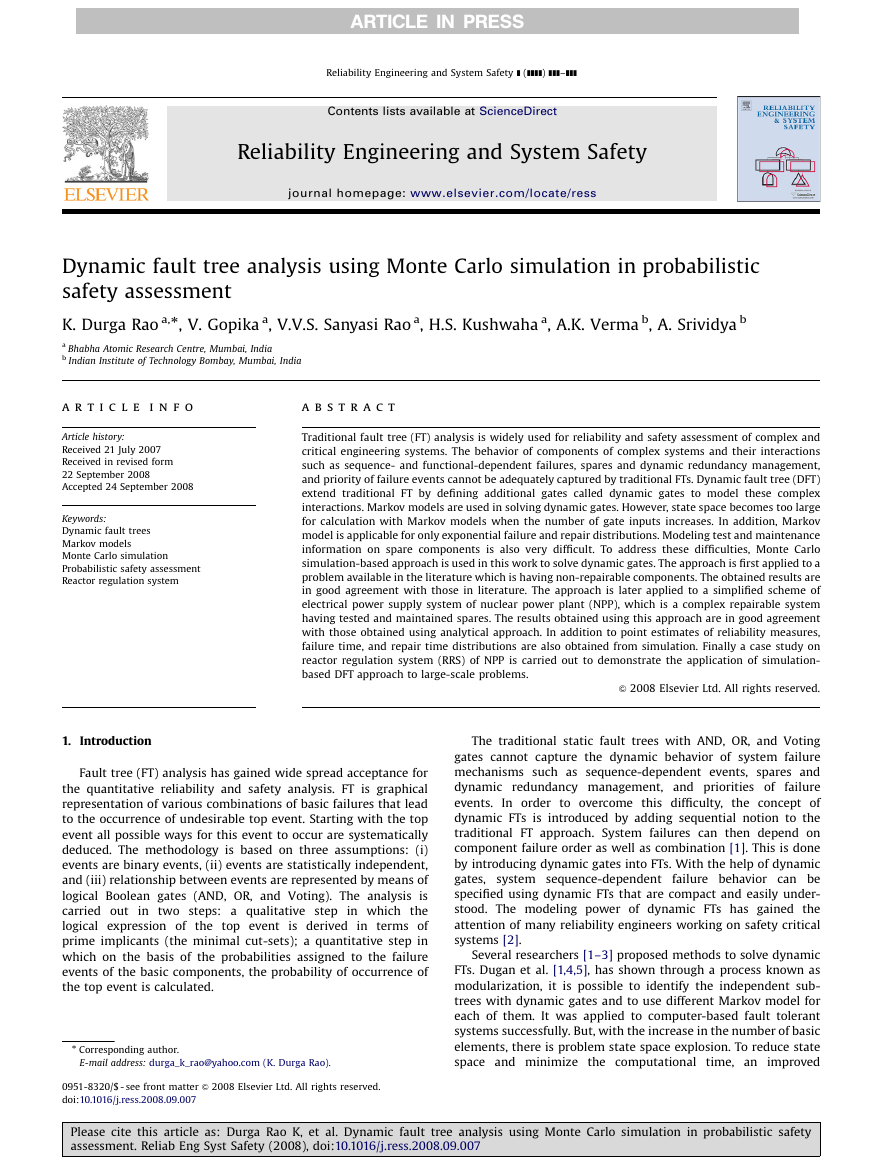
case (in Fig. 1—PAND: failure occurs if A fails before B, but B may
fail before A without producing a failure in G).
SPARE gates are dynamic gates modeling one or more principal
components that can be substituted by one or more backups
(spares), with the same functionality (Fig. 1). The SPARE gate fails
when the number of operational powered spares and/or principal
components is less than the minimum required. Spares can fail
even while they are dormant, but the failure rate of an unpowered
spare is lower than the failure rate of the corresponding powered
one. More precisely, l being the failure rate of a powered spare,
the failure rate of the unpowered spare is al, where 0pap1 is the
dormancy factor. Spares are more properly called ‘‘hot’’ if a ¼ 1
and ‘‘cold’’ if a ¼ 0.
In the FDEP gate (Fig. 1), there will be one trigger-input (either
a basic event or the output of another gate in the tree) and one or
more dependent events. The dependent events are functionally
dependent on the trigger event. When the trigger event occurs,
the dependent basic events are forced to occur. In the Markov-
chain generation, when a state is generated in which the trigger
event is satisfied, all the associated dependent events are marked
as having occurred. The separate occurrence of any of the
dependent basic events has no effect on the trigger event.
3. Monte Carlo simulation-based approach for dynamic gates
Monte Carlo simulation is a very valuable method which is
widely used in the solution of real engineering problems in many
fields. Lately the utilization of this method is growing for the
assessment of availability of complex systems and the monetary
value of plant operations and maintenances [12–15]. The com-
plexity of the modern engineering systems besides the need for
realistic considerations when modeling their availability/reliabil-
ity renders analytical methods very difficult to be used. Analyses
that involve repairable systems with multiple additional events
and/or other maintainability information are very difficult to solve
analytically (dynamic FTs through state space, numerical integra-
tion, Bayesian network approaches). Dynamic FT through simula-
tion approach can incorporate these complexities and can give
wide range of output parameters.
Simulation technique estimates the reliability indices by
simulating the actual process and random behavior of the system
in a computer model in order to create a realistic lifetime scenario
of the system. This method treats the problem as a series of real
experiments conducted in a simulated time. It estimates the
probability and other indices by counting the number of times an
event occurs in simulated time. The required information for the
analysis is: probability density functions (PDF) for time to failure
and repair of all basic components with the parameter values;
maintenance policies; interval and duration of tests and pre-
ventive maintenance.
Components are simulated for a specified mission time for
depicting the duration of available (up) and unavailable (down)
states. Up and down states will come alternatively, as these states
are changing with time they are called state time diagrams. Down
state can be due to unexpected failure and its recovery will
G
G
G
G
PAND
SEQ
SPARE
FDEP
T
A
B
A
B
C
A
S1
S2
A
B C
Fig. 1. Dynamic gates.
Please cite this article as: Durga Rao K, et al. Dynamic fault tree analysis using Monte Carlo simulation in probabilistic safety
assessment. Reliab Eng Syst Safety (2008), doi:10.1016/j.ress.2008.09.007
�
ARTICLE IN PRESS
K. Durga Rao et al. / Reliability Engineering and System Safety ] (]]]]) ]]]–]]]
3
depend upon the time taken for repair action. Duration of the
state is random for both up and down states. It will depend upon
PDF of time to failure and time to repair, respectively.
3.1. Evaluation of time to failure or time to repair for state
time diagrams
Consider a random variable x is following exponential
distribution with parameter l, f(x) and F(x) are given by the
following expressions:
fðxÞ ¼ l expð�lxÞ,
FðxÞ ¼
fðxÞ dx ¼ 1 � expð�lxÞ.
Z
x
0
Now x derived as a function of F(x)
�
�
x ¼ GðFðxÞÞ ¼ 1
l ln
1
1 � FðxÞ
.
A uniform random number is generated using any of the
standard random number generators. Let us assume 0.8 is
generated by random number generator then the value of x is
calculated by substituting 0.8 in place of F(x) and say 1.8/yr (5e�3/
h) in place of l in the above equation
�
�
x ¼ 1
5e � 3
ln
1
1 � 0:8
¼ 321:8 h.
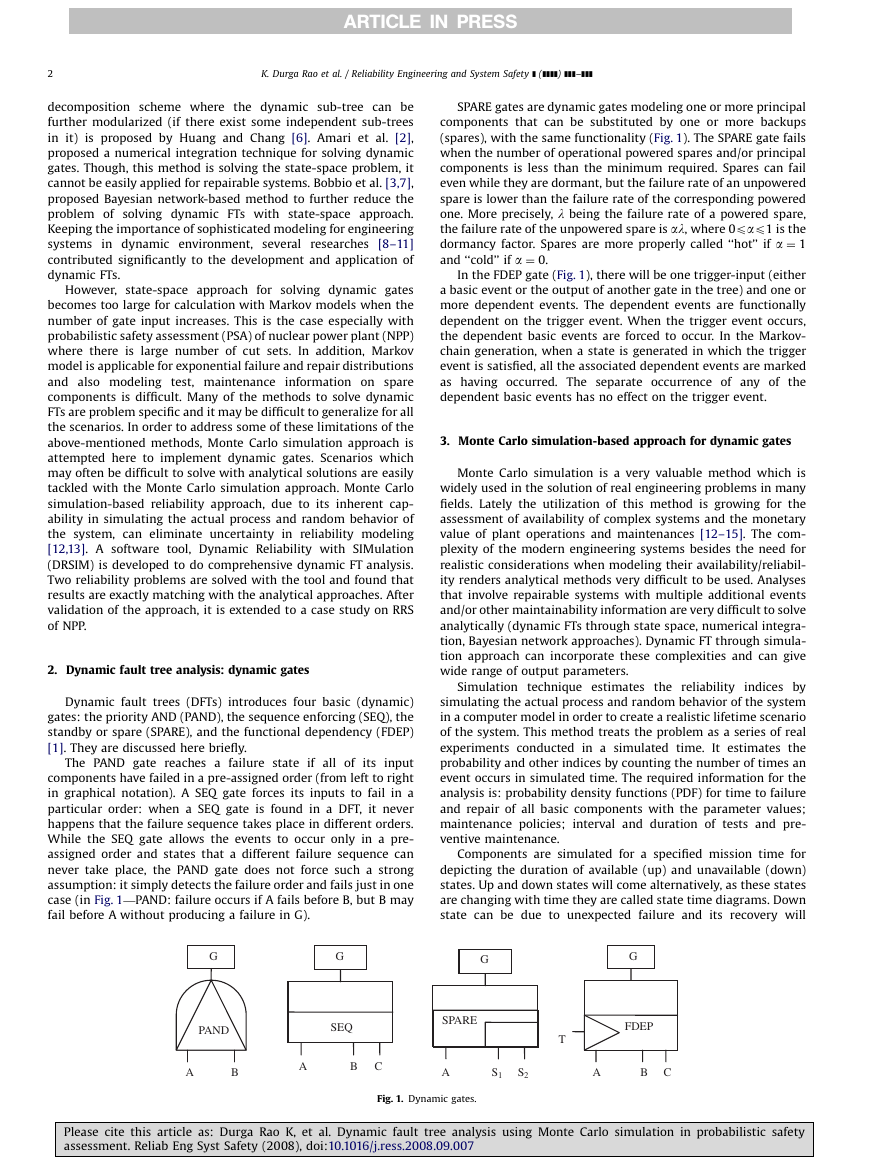
This indicates time to failure of the component is 321.8 h (see
Fig. 2). This procedure is applicable similarly for repair time also
and if the shape of PDF is different accordingly one has to solve
for G(F(x)).
1
0.8
0.6
0.4
0.2
)
x
(
R
;
)
x
(
F
0
0
F (x) = 1-exp (-0.005x)
R (x) = exp (-0.005x)
200
400
600
Time (Hrs)
800
1000
Fig. 2. Exponential distribution.
A
B
A
B
A
B
The four basic dynamic gates are solved here through
simulation approach.
3.2. PAND gate
Consider PAND gate having two active components, A and B.
Active component is the one which is in working condition during
normal operation of the system. Active components can be either
in success state or failure state. Based on the PDF of failure of
component, time to failure is obtained from the procedure
mentioned above. The failure is followed by repair whose
time depends on the PDF of repair time. This sequence is
continued until it reaches the predetermined system mission
time. Similarly for the second component also state time diagrams
are developed.
For generating PAND gate state time diagram, both the
components state time profiles are compared. The PAND gate
reaches a failure state if all of its input components have failed in a
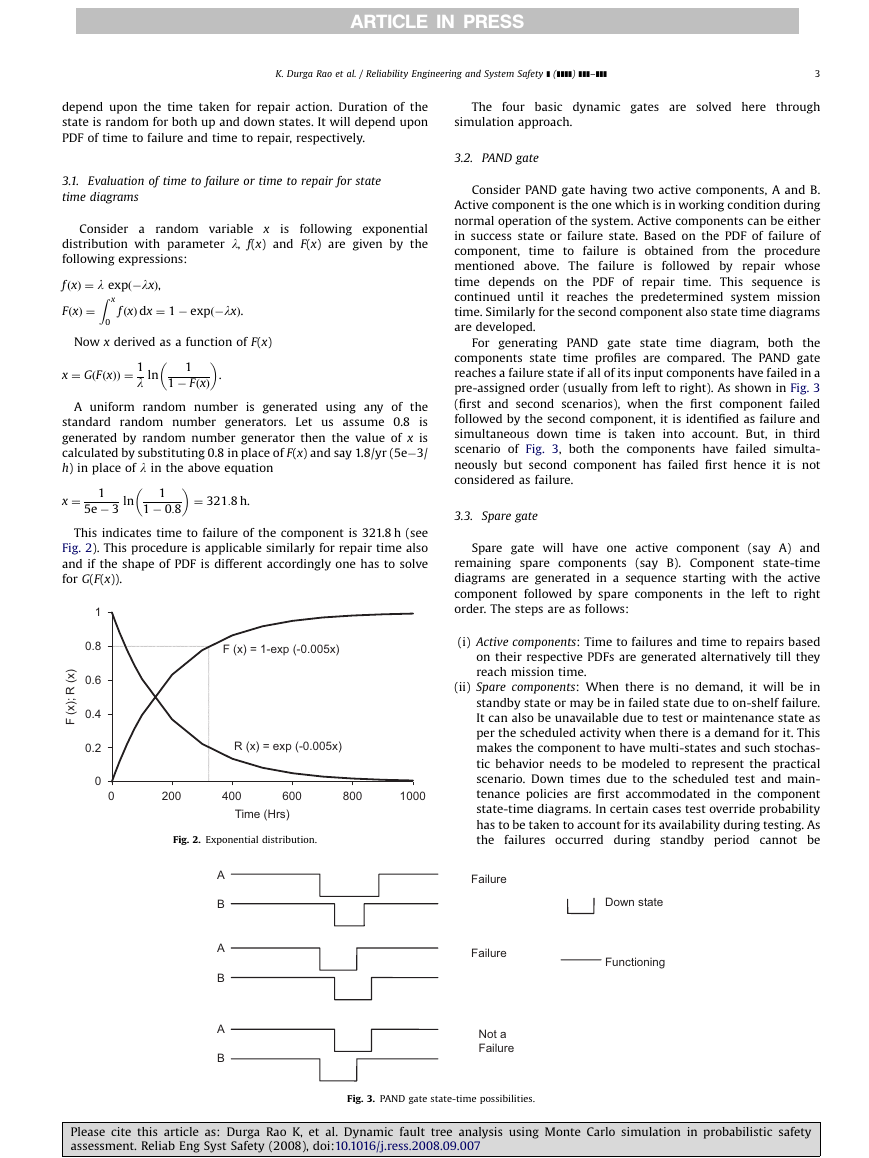
pre-assigned order (usually from left to right). As shown in Fig. 3
(first and second scenarios), when the first component failed
followed by the second component, it is identified as failure and
simultaneous down time is taken into account. But, in third
scenario of Fig. 3, both the components have failed simulta-
neously but second component has failed first hence it is not
considered as failure.
3.3. Spare gate
Spare gate will have one active component (say A) and
remaining spare components (say B). Component state-time
diagrams are generated in a sequence starting with the active
component followed by spare components in the left to right
order. The steps are as follows:
(i) Active components: Time to failures and time to repairs based
on their respective PDFs are generated alternatively till they
reach mission time.
(ii) Spare components: When there is no demand, it will be in
standby state or may be in failed state due to on-shelf failure.
It can also be unavailable due to test or maintenance state as
per the scheduled activity when there is a demand for it. This
makes the component to have multi-states and such stochas-
tic behavior needs to be modeled to represent the practical
scenario. Down times due to the scheduled test and main-
tenance policies are first accommodated in the component
state-time diagrams. In certain cases test override probability
has to be taken to account for its availability during testing. As
the failures occurred during standby period cannot be
Down state
Functioning
Failure
Failure
Not a
Failure
Please cite this article as: Durga Rao K, et al. Dynamic fault tree analysis using Monte Carlo simulation in probabilistic safety
assessment. Reliab Eng Syst Safety (2008), doi:10.1016/j.ress.2008.09.007
Fig. 3. PAND gate state-time possibilities.
�
ARTICLE IN PRESS
4
K. Durga Rao et al. / Reliability Engineering and System Safety ] (]]]]) ]]]–]]]
revealed till its testing, time from failure till identification has
to be taken as down time. It is followed by imposing the
standby down times obtained from the standby time to failure
PDF and time to repair PDF. Apart from the availability on
demand, it is also required to check whether the standby
component
is successfully meeting its mission. This is
incorporated by obtaining the time to failure based on the
operating failure PDF and is checked with the mission time,
which is the down time of active component. If the first stand-
by component
the active
component, then demand will be passed on to the next spare
component.
fails before the recovery of
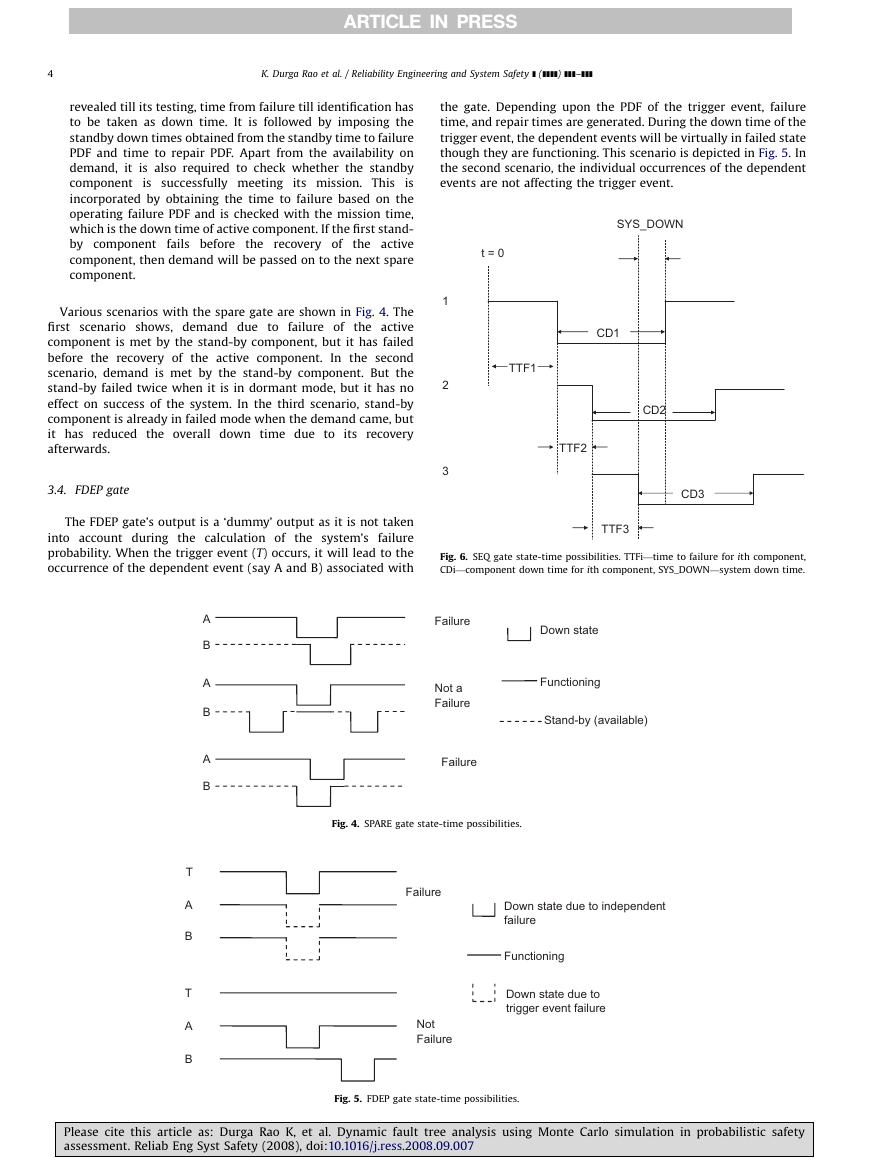
Various scenarios with the spare gate are shown in Fig. 4. The
first scenario shows, demand due to failure of
the active
component is met by the stand-by component, but it has failed
before the recovery of the active component.
In the second
scenario, demand is met by the stand-by component. But the
stand-by failed twice when it is in dormant mode, but it has no
effect on success of the system. In the third scenario, stand-by
component is already in failed mode when the demand came, but
it has reduced the overall down time due to its recovery
afterwards.
3.4. FDEP gate
The FDEP gate’s output is a ‘dummy’ output as it is not taken
into account during the calculation of the system’s failure
probability. When the trigger event (T) occurs, it will lead to the
occurrence of the dependent event (say A and B) associated with
the gate. Depending upon the PDF of the trigger event, failure
time, and repair times are generated. During the down time of the
trigger event, the dependent events will be virtually in failed state
though they are functioning. This scenario is depicted in Fig. 5. In
the second scenario, the individual occurrences of the dependent
events are not affecting the trigger event.
SYS_DOWN
t = 0
1
2
3
CD1
TTF1
CD2
TTF2
CD3
TTF3
Fig. 6. SEQ gate state-time possibilities. TTFi—time to failure for ith component,
CDi—component down time for ith component, SYS_DOWN—system down time.
A
B
A
B
A
B
T
A
B
T
A
B
Failure
Not a
Failure
Failure
Down state
Functioning
Stand-by (available)
Fig. 4. SPARE gate state-time possibilities.
Failure
Down state due to independent
failure
Functioning
Down state due to
trigger event failure
Not
Failure
Please cite this article as: Durga Rao K, et al. Dynamic fault tree analysis using Monte Carlo simulation in probabilistic safety
assessment. Reliab Eng Syst Safety (2008), doi:10.1016/j.ress.2008.09.007
Fig. 5. FDEP gate state-time possibilities.
�
ARTICLE IN PRESS
K. Durga Rao et al. / Reliability Engineering and System Safety ] (]]]]) ]]]–]]]
5
3.5. SEQ gate
It is similar to PAND gate but occurrence of events are forced to
take place in a particular fashion. Failure of first component forces
the other components to follow. No component can fail prior to
the first component. Consider a three input SEQ gate having
repairable components. The following steps are involved with
Monte Carlo simulation approach.
1. Component state time profile is generated for first component
based upon its failure and repair rate. Down time of first
component
the second component.
Similarly the down time of second component is mission time
for the third component.
is mission time for
2. When first component fails, operation of the second compo-
nent starts. Failure instance of the first component is taken as
t ¼ 0 for second component. Time to failure (TTF2) and time to
Table 1
Failure data for the basic events
Gate
AND
OR
Failure rate of basic events
1.1e�2
1.1e�3
1.2e�2
1.2e�3
1.3e�2
1.3e�3
1.4e�2
1.4e�3
1.5e�2
1.5e�3
repair/component down time (CD2) is generated for second
component.
3. When second component fails, operation of the third compo-
nent starts. Failure instance of the second component is taken
as t ¼ 0 for third component. Time to failure (TTF3) and time to
repair/component down time (CD3) is generated for third
component.
4. The common period in which all the components are down is
considered as the down time of the SEQ gate.
5. The process is repeated for all the down states of the first
component (Fig. 6).
4. Validation with examples
4.1. Example 1—DFT problem from Ref. [2]
Consider a PAND gate with AND and OR gates as inputs (see
Table 1 and Fig. 7). Amari et al. [2] suggested an approach based
on the numerical integration technique to solve this problem and
compared it with Markov-model approach. For mission time
1000 h, the top event probability is 3.6e�1, and overall computa-
tion time is less than 1.0e�2 s. State-space approach generated
162 states and computation time is 25 s. However, both the
methods need lot of time for the development of analytical
expression and multiple states, respectively. Once the analytical
Top Event
PAND
Gate 2:
Static AND
Gate 3: OR
Event 1
Event 5
Event 6
Event 10
...
...
Fig. 7. Fault tree having dynamic gate (PAND).
)
x
(
f
0.12
0.1
0.08
0.06
0.04
0.02
0
)
x
(
F
1
0.8
0.6
0.4
0.2
0
0
200 400 600 800 1000 1200
failure time (x)
0
200 400 600 800 1000 1200
failure time(x)
Please cite this article as: Durga Rao K, et al. Dynamic fault tree analysis using Monte Carlo simulation in probabilistic safety
assessment. Reliab Eng Syst Safety (2008), doi:10.1016/j.ress.2008.09.007
Fig. 8. Failure time distributions.
�
ARTICLE IN PRESS
6
K. Durga Rao et al. / Reliability Engineering and System Safety ] (]]]]) ]]]–]]]
expression is developed, calculation is straightforward. However,
the former method is limited for non-repairable basic events only.
The disadvantage with the later method is number of states in the
Markov model which increases exponentially as the number of
basic events increase. Solution to this problem has been obtained
with the simulation approach as explained in the previous section.
Simulation is carried out for 10,000 iterations with a mission time
of 1000 h. The top event probability is obtained same as Amari
et al. [2] method. Apart from the mean value of failure probability,
randomness in the failure time is characterized by the probability
distribution as shown in Fig. 8. Mean time to failure is obtained as
290.1 h with simulation approach.
4.2. Example 2—simplified electrical (AC) power supply system of
typical NPP
Electrical power supply is essential in the operation of process
and safety system of any NPP. Grid supply (off-site-power supply)
known as Class IV supply is the one which feeds all these loads. To
ensure high reliability of power supply, redundancy is provided
with the diesel generators known as Class III supply (also known
as on-site emergency supply) in the absence of Class IV supply to
supply the loads. There will be sensing and control circuitry to
Sensing
&
Control
Circuitry
Grid Supply
Diesel Supply
Fig. 9. Reliability block diagram of electrical power supply system of NPP.
Station Blackout
detect the failure of Class IV supply which triggers the redundant
Class III supply [16]. Loss of off-site power supply (Class IV)
coupled with loss of on-site AC power (Class III) is called station
blackout. In many PSA studies [17], accident sequences resulting
from station blackout conditions have been recognized to be
significant contributors to the risk of core damage. For this reason
the reliability/availability modeling of AC Power supply system is
of special interest in PSA of NPP.
The reliability block diagram is shown in Fig. 9. Now this
system can be modeled with the dynamic gates to calculate the
unavailability of overall AC power supply of a NPP.
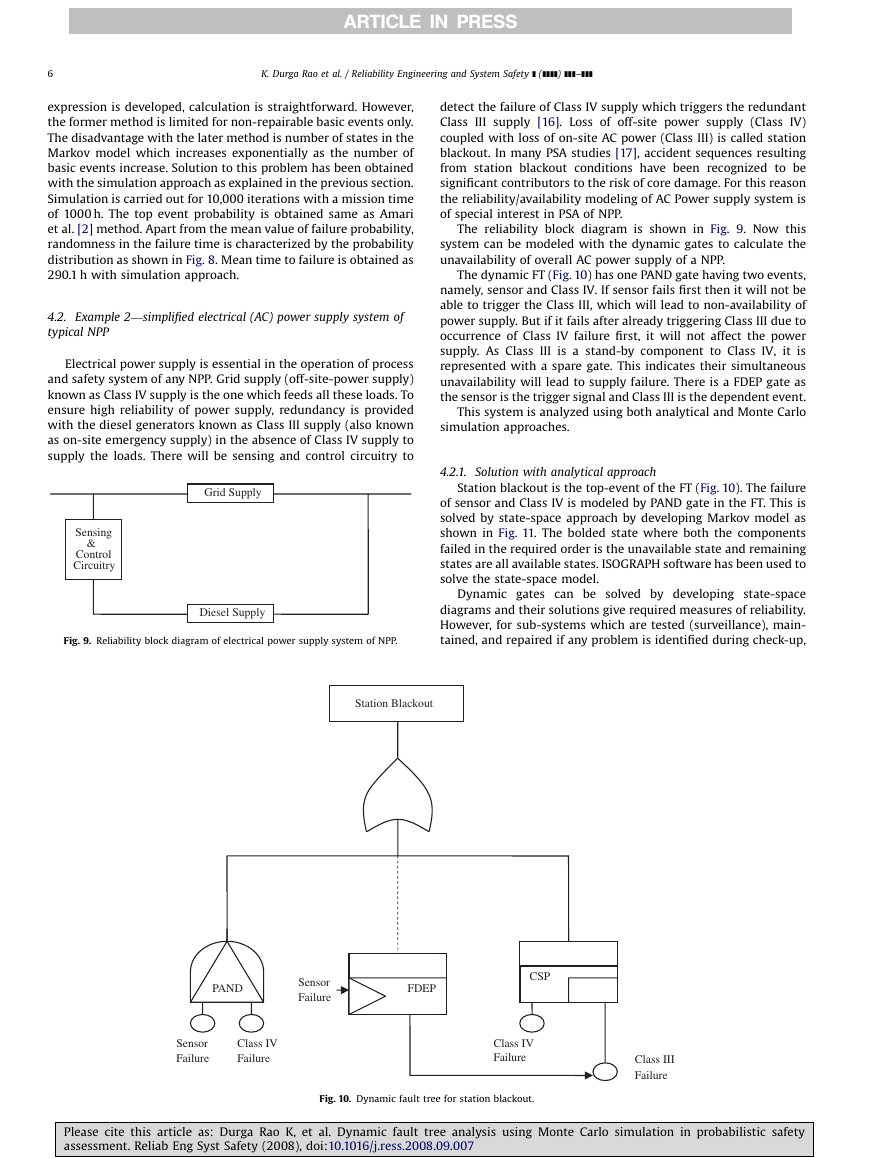
The dynamic FT (Fig. 10) has one PAND gate having two events,
namely, sensor and Class IV. If sensor fails first then it will not be
able to trigger the Class III, which will lead to non-availability of
power supply. But if it fails after already triggering Class III due to
occurrence of Class IV failure first, it will not affect the power
supply. As Class III is a stand-by component to Class IV, it is
represented with a spare gate. This indicates their simultaneous
unavailability will lead to supply failure. There is a FDEP gate as
the sensor is the trigger signal and Class III is the dependent event.
This system is analyzed using both analytical and Monte Carlo
simulation approaches.
4.2.1. Solution with analytical approach
Station blackout is the top-event of the FT (Fig. 10). The failure
of sensor and Class IV is modeled by PAND gate in the FT. This is
solved by state-space approach by developing Markov model as
shown in Fig. 11. The bolded state where both the components
failed in the required order is the unavailable state and remaining
states are all available states. ISOGRAPH software has been used to
solve the state-space model.
Dynamic gates can be solved by developing state-space
diagrams and their solutions give required measures of reliability.
However, for sub-systems which are tested (surveillance), main-
tained, and repaired if any problem is identified during check-up,
PAND
Sensor
Failure
FDEP
Sensor
Failure
Class IV
Failure
CSP
Class IV
Failure
Class III
Failure
Fig. 10. Dynamic fault tree for station blackout.
Please cite this article as: Durga Rao K, et al. Dynamic fault tree analysis using Monte Carlo simulation in probabilistic safety
assessment. Reliab Eng Syst Safety (2008), doi:10.1016/j.ress.2008.09.007
�
ARTICLE IN PRESS
K. Durga Rao et al. / Reliability Engineering and System Safety ] (]]]]) ]]]–]]]
7
SENSOR (A)
CLASS IV (B)
λA
μB
A – Dn
B – Up
μA
λB
A – Up
B – Dn
Failed state
A – Dn
B – Dn
μA
μB
A – Dn
B – Dn
λB
μB
λA
μA
Fig. 11. Markov (state-space) diagram for PAND gate having sensor and Class IV as inputs.
Table 2
Component failure and maintenance information
Component
Failure rate (h)
Repair rate (h)
Test period (h)
Test time (h)
Maint. period (h)
Maint. time (h)
Class IV
Sensor
Class III
2.3e�4
1.0e�4
5.3e�4
2.6
2.5e�1
8.7e�2
–
–
168
–
–
8.3e�2
–
–
2160
–
–
8
Class IV
Class III
Sensor
System
Stand-by (available)
Functioning
Down state
Fig. 12. State-time diagrams for Class IV, sensor, Class III and overall system.
cannot be modeled by state-space diagrams. Though, there is a
school of thought that initial state probabilities can be given as
per the maintenance and demand information, this is often
debatable. A simplified time averaged unavailability expression is
suggested in IAEA P-4 [18] for stand-by subsystems having
exponential failure/repair characteristics. The same is applied
here to solve stand-by (SPARE) gate. If Q is the unavailability of
stand-by component, it is expressed by the following equation:
�
þ ½f mT m þ ½lT r,
Q ¼ 1 � 1 � e�lT
lT
�
h i
þ t
T
where l is failure rate, T is test interval, t is test duration, fm is
frequency of preventive maintenance, Tm is duration of main-
tenance, and Tr is repair time. It is sum of contribution from
failures, test outage, maintenance outage and repair outage. In
order to obtain the unavailability of stand-by gate, unavailability
of Class IV is multiplied with the unavailability (Q) of stand-by
component Class III.
Input parameter values used in the analysis are shown in
Table 2 [19]. The sum of the both the values (PAND and SPARE)
give the unavailability of station blackout scenario which is
obtained as 4.8e�6.
4.2.2. Solution with Monte Carlo simulation
As one can see Markov model for a two-component dynamic
gate is having 5 states with 10 transitions, thus state space
becomes unmanageable as the number of components increases.
In case of stand-by components, the time-averaged analytical
expression for unavailability is only valid for exponential cases.
Please cite this article as: Durga Rao K, et al. Dynamic fault tree analysis using Monte Carlo simulation in probabilistic safety
assessment. Reliab Eng Syst Safety (2008), doi:10.1016/j.ress.2008.09.007
�
ARTICLE IN PRESS
8
K. Durga Rao et al. / Reliability Engineering and System Safety ] (]]]]) ]]]–]]]
To address these limitations, Monte Carlo simulation is applied
here to solve the problem.
In simulation approach, random failure/repair times from each
components failure/repair distributions are generated. These
failure/repair times are then combined in accordance with the
way the components are reliability-wise arranged with in the
system. As explained in the previous section, PAND gate and
SPARE gate can easily be implemented through simulation
approach. The difference from normal AND gate to PAND and
SPARE gates is that the sequence of failure has to be taken into
account and stand-by behavior including the testing, mainte-
nance, dormant failures have to be accommodated. The unique
advantage with simulation is incorporating non-exponential
distributions and eliminating S-independent assumption.
Component state-time diagrams are developed as shown in
the components in the system. For active
Fig. 12 for all
components which are independent, only two states will be
there, one is functioning state (up—operational state), and second
is repair state due to failure (down—repair state). In the present
problem, Class IV and sensor are active components where as
Class III is stand-by component. For Class III, generation of state-
time diagram involves more calculations than former. It is having
six possible states, namely: testing, preventive maintenance,
corrective maintenance, stand-by functioning, stand-by failure
undetected, and normal functioning to meet the demand. As
testing and preventive maintenance are scheduled activities, they
are deterministic and are initially accommodated in component
profile. Stand-by failure, demand failure, and repair are random
and according to their PDF the values are generated. The demand
functionality of Class III depends on the functioning of sensor and
Class IV. Initially after generating the state-time diagrams of
sensor and Class IV, the down states of Class IV is identified and
sensor availability at the beginning of the down state is checked to
trigger the Class III. The reliability of Class III during the down
state of Class IV is checked. DRSIM tool developed by authors has
been used for implementing this problem. Unavailability obtained
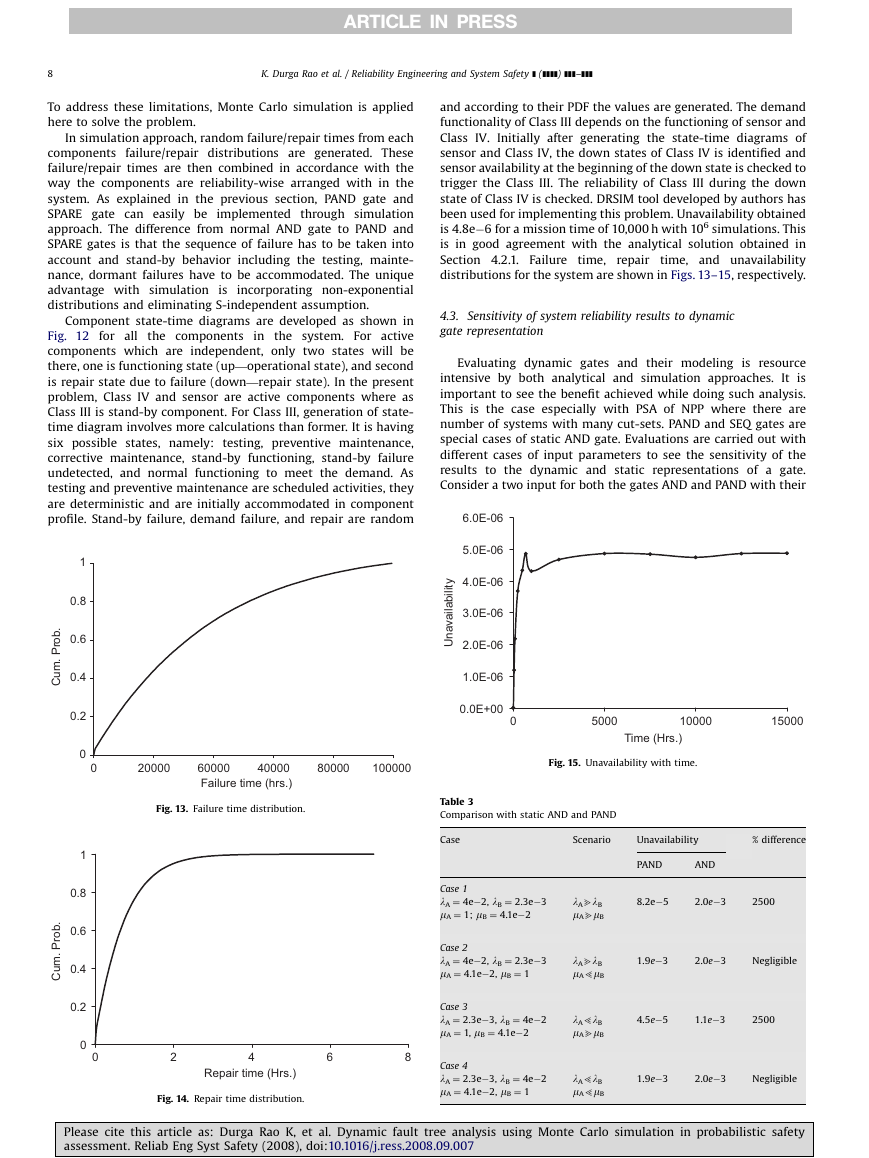
is 4.8e�6 for a mission time of 10,000 h with 106 simulations. This
is in good agreement with the analytical solution obtained in
Section 4.2.1. Failure time,
time, and unavailability
distributions for the system are shown in Figs. 13–15, respectively.
repair
4.3. Sensitivity of system reliability results to dynamic
gate representation
Evaluating dynamic gates and their modeling is resource
intensive by both analytical and simulation approaches. It is
important to see the benefit achieved while doing such analysis.
This is the case especially with PSA of NPP where there are
number of systems with many cut-sets. PAND and SEQ gates are
special cases of static AND gate. Evaluations are carried out with
different cases of input parameters to see the sensitivity of the
results to the dynamic and static representations of a gate.
Consider a two input for both the gates AND and PAND with their
6.0E-06
5.0E-06
4.0E-06
3.0E-06
2.0E-06
1.0E-06
y
t
i
l
i
b
a
l
i
a
v
a
n
U
0.0E+00
0
5000
10000
15000
Time (Hrs.)
Fig. 15. Unavailability with time.
.
b
o
r
P
.
m
u
C
.
b
o
r
P
.
m
u
C
1
0.8
0.6
0.4
0.2
0
0
1
0.8
0.6
0.4
0.2
0
0
20000
60000
40000
Failure time (hrs.)
80000
100000
Fig. 13. Failure time distribution.
Table 3
Comparison with static AND and PAND
Case
Scenario
Unavailability
% difference
Case 1
lA ¼ 4e�2, lB ¼ 2.3e�3
mA ¼ 1; mB ¼ 4.1e�2
Case 2
lA ¼ 4e�2, lB ¼ 2.3e�3
mA ¼ 4.1e�2, mB ¼ 1
Case 3
lA ¼ 2.3e�3, lB ¼ 4e�2
mA ¼ 1, mB ¼ 4.1e�2
Case 4
lA ¼ 2.3e�3, lB ¼ 4e�2
mA ¼ 4.1e�2, mB ¼ 1
lAblB
mAbmB
lAblB
mA5mB
lA5lB
mAbmB
lA5lB
mA5mB
PAND
AND
8.2e�5
2.0e�3
2500
1.9e�3
2.0e�3
Negligible
4.5e�5
1.1e�3
2500
1.9e�3
2.0e�3
Negligible
2
4
6
8
Repair time (Hrs.)
Fig. 14. Repair time distribution.
Please cite this article as: Durga Rao K, et al. Dynamic fault tree analysis using Monte Carlo simulation in probabilistic safety
assessment. Reliab Eng Syst Safety (2008), doi:10.1016/j.ress.2008.09.007
�




 2023年江西萍乡中考道德与法治真题及答案.doc
 2012年重庆南川中考生物真题及答案.doc
 2013年江西师范大学地理学综合及文艺理论基础考研真题.doc
 2020年四川甘孜小升初语文真题及答案I卷.doc
 2020年注册岩土工程师专业基础考试真题及答案.doc
 2023-2024学年福建省厦门市九年级上学期数学月考试题及答案.doc
 2021-2022学年辽宁省沈阳市大东区九年级上学期语文期末试题及答案.doc
 2022-2023学年北京东城区初三第一学期物理期末试卷及答案.doc
 2018上半年江西教师资格初中地理学科知识与教学能力真题及答案.doc
 2012年河北国家公务员申论考试真题及答案-省级.doc
 2020-2021学年江苏省扬州市江都区邵樊片九年级上学期数学第一次质量检测试题及答案.doc
 2022下半年黑龙江教师资格证中学综合素质真题及答案.doc