数据的极大丰富使人们可以逐渐摆脱对模型和假设的依赖。对于大数据时代,
谷歌的研究主管 Peter Norvig 有一句名言“All Models are wrong, and
increasingly you can succeed without them”。所以,大数据 GIS 的特征之
二就是空间分析方法由模型驱动逐渐转变为数据驱动。
数据驱动采用的方式是根据对业务的分析建立数据模型来进行系统设计的
一种方法,通过数据模型的建立来完成系统的实现,一般来说,在采取数据模型
的系统中多采用的是前台直接和数据模型进行绑定的方式,这样在实现起来相对
来讲会非常的快速。根据数据驱动的系统设计以及实现方式上来讲,数据驱动适
合于数据型的应用系统的建设,而现在大部分的中小型应用系统很多就停留在这
个层面上,在这类系统中数据驱动会显得特别的实用和好用,这类系统一个非常
突出的共同点就是系统基本属于信息的录入、显示以及查询这样的一个过程,不
存在复杂的数据业务逻辑处理。
模型驱动采用的方式根据对业务的分析建立业务对象模型来进行系统设计
的一种方法,通过业务对象模型结合系统架构约束来进行系统的实现,一般来说,
在采取模型驱动的系统中多采用 N 层的结构体系,前台显示一般和业务显示模型
进行交互,而业务显示模型则通过业务对象模型进行交互来完成业务逻辑的处
理,业务对象模型通过与持久对象模型进行业务持久的处理,在这样的情况下,
势必增加了系统的复杂度,模型驱动适合与业务型应用系统的建设,这个在行业
化的业务应用上显得比较突出,这类系统的共同点在于业务逻辑较为复杂而且多
变,系统不仅仅是信息的录入、显示以及查询,更多的是对录入或显示的信息进
行业务逻辑的处理。
经过上面的简单介绍后,我觉得对于数据驱动和模型驱动都会有个大概的概念,
只能说数据驱动和模型驱动各有优势,要结合系统需求来选择相应的驱动方式。
对于模型驱动个人有些观点,其实从模型驱动我们可以看出如果采用模型驱
动面对一个数据型的应用系统时,最后产生的业务对象模型即退化为了数据模
型,只是由于模型驱动通常采用的 N 层架构此时反而约束了此模型的快速实现,
是否应该在模型驱动的 N 层架构中去考虑一种退化的业务对象模型的支持呢?
觉得这点是值得思考的,如果支持的话应该说对于模型驱动非常有利或者说是模
型驱动的一个补充,相当于对于模型驱动进行分类处理,有些时候架构不能太 S,
还是要根据系统建设的需求做出适当的调整。
根据这样的观点,其实数据驱动也是模型驱动,只是它采用的是一种退化的
业务对象模型的驱动,并同时进行架构层次的调整以适应系统的快速建设,但数
据驱动对于复杂多变的业务逻辑系统来说毕竟难去满足了,主要是会在数据模型
的建立以及业务逻辑的修改的方面。
综合这样的观点,还是更为倾向模型驱动,同时也认为,模型驱动的架构应
该考虑对于退化的业务对象模型的支持。
�
一般说的数据驱动大都认为是把测试用例中的业务逻辑和测试数据分别抽象出
来。但是逻辑和数据怎么组织呢
主要分三种情况
1、数据池。这是使用程度最高的,也是最普及的一种做法。逻辑是定的,数据
也是定的,只不过数据会有很多,循环执行。比如一个登录界面的测试,会准备
很多登录的数据进行测试,包括不同的验证内容。这种类型的框架也被说成高级
的参数化应用。
2、数据不同导致逻辑走向不同。也就是说由数据决定测试流程。比第一种有难
度。
3、数据变动驱动测试发生。这种说法比较冷门。大概意思是说某个测试用例准
备了一套测试数据,又添加一套测试数据时,引发测试发生。
总结一下,
人类认知能力的提高主要来自于发现并掌握世界的规律; 规律往往用数学模型
来表达的 ; 数学模型的确定分两步,一步是确定数学模型(狭义的模型),第
二步是确定参数 ; 确定数学模型的难度极大,人类想到通过将多个粗糙但是简
单模型的组合的方法来逼近真实模型(大概的构想) ;
具体的做法是:先建立一个粗糙的模型,之后用大量的数据来细化数据使得模型
不断的契合数据;
这个方法被称之为「数据驱动方法」 ;
它的使用前提是,具有大量的具有代表性的数据,仅仅有大量数据还不够,数据
必须具备代表性,在过去,做到这点极难,但是在大数据的普及今天这点比较容
易做到。;
这种方法的意义在于,真理的发现是困难而漫长的,但是通过大量的数据和计算
来换取研究的时间,得到的结果虽然不完美但是足够指导实践。
�
MATLAB CODE
The accompanying figure presents a sample MATLAB code for performing n
iterations of the standard (firstorder) SPSA algorithm. Algorithm
initialization for program variables theta, n, p, a, A, c, alpha, gamma
is not shown here since that can be handled in many ways (e.g., read from
another file, direct inclusion in the program, and user input during
execution). The program calls an external function “loss” to obtain the
(possibly noisy) measurements. The Dki elements are generated according
to a Bernoulli ±1 distribution.
For k=1:n
ak=a/(k+A)^alpha;
ck=c/k^gamma;
delta=2*round(rand(p,1))-1;
thetaplus=theta+ck*delta;
thetaminus=theta-ck*delta;
yplus=loss(thetaplus);
yminus=loss(thetaminus);
ghat=(yplus-yminus)./(2*ck*delta);
theta=theta-ak*ghat;
end
theta
If maximum and minimum values on the values of theta can be specified,
say thetamax and thetamin, then the following two lines can be added below
the theta update line to impose the constraints
theta=min(theta, thetamax);
theta=max(theta, thetamin);
�
调用函数(简单)
function J=optexampfunction(theta)
J=5*theat(1,1)+6*theat(2,1)
调用函数(复杂)
% Function to be optimized:
function J=optexampfunction(theta)
% An example function to optimize:
J=...
+5*exp(-0.1*((theta(1,1)-15)^2+(theta(2,1)-20)^2))...
-2*exp(-0.08*((theta(1,1)-20)^2+(theta(2,1)-15)^2))...
+3*exp(-0.08*((theta(1,1)-25)^2+(theta(2,1)-10)^2))...
+2*exp(-0.1*((theta(1,1)-10)^2+(theta(2,1)-10)^2))...
-2*exp(-0.5*((theta(1,1)-5)^2+(theta(2,1)-10)^2))...
-4*exp(-0.1*((theta(1,1)-15)^2+(theta(2,1)-5)^2))...
-2*exp(-0.5*((theta(1,1)-8)^2+(theta(2,1)-25)^2))...
-2*exp(-0.5*((theta(1,1)-21)^2+(theta(2,1)-25)^2))...
+2*exp(-0.5*((theta(1,1)-25)^2+(theta(2,1)-16)^2))...
+2*exp(-0.5*((theta(1,1)-5)^2+(theta(2,1)-14)^2));
SPSA 代码
%
Simultaneous Perturbation Stochastic Approximation (SPSA) algorithm
%%%%%%%%%%%%%%%%%%%%%%%%%%%%%%%%%%%%%%%%%%%%%%%%%%%%%%%%%%%%%%%%%%%%%%%%%
%
%
% This program simulates the minimization of a simple function with
% the SPSA method.
%
%%%%%%%%%%%%%%%%%%%%%%%%%%%%%%%%%%%%%%%%%%%%%%%%%%%%%%%%%%%%%%%%%%%%%%%%%%
clear
p=2;
% Initialize memory
% Dimension of the search space
thetamin=[0; 0];
% Set edges of region want to search in
thetamax=[30;30];
�
Nspsa=100;
% Maximum number of iterations to produce
% Next set the parameters of the algorithm:
lambda=1;
lambda0=1;
alpha1=0.602;
alpha2=0.101;
c=0.01;
% Next, pick the initial value of the parameter vector
theta(:,1)=[15; 15]; % Falls into one local minimum
%theta(:,1)=[17; 10]; % Moves to the global minimum
%theta(:,1)=[15; 20]; % Start at global maximum - goes to a local minimum
%theta(:,1)=[1; 1]; % Start at a relatively flat region - moves slow
% Allocate memory
theta(:,2:Nspsa)=0*ones(p,Nspsa-1);
%%%%%%%%%%%%%%%%%%%%%%%%%%%%%%%%%%%%%%%%%%%%%%
% Start the SPSA loop
for j=1:Nspsa
% Use projection in case update (or initial values) out of range
theta(:,j)=min(theta(:,j),thetamax);
theta(:,j)=max(theta(:,j),thetamin);
% Set parameters and perturb parameters
lambdaj=lambda/(lambda0+j)^alpha1; % Note since this corresponds to zero
cj=c/j^alpha2;
Delta=2*round(rand(p,1))-1; % According to a Bernoulli +- 1 dist.
thetaplus=theta(:,j)+cj*Delta;
thetaminus=theta(:,j)-cj*Delta;
% Use projection in case perturbed out of range.
�
thetaplus=min(thetaplus,thetamax);
thetaplus=max(thetaplus,thetamin);
thetaminus=min(thetaminus,thetamax);
thetaminus=max(thetaminus,thetamin);
% Next we must compute the cost function for thetaplus and thetaminus
Jplus=optexampfunction([thetaplus(1,1);thetaplus(2,1)]);
Jminus=optexampfunction([thetaminus(1,1);thetaminus(2,1)]);
% Next, compute the approximation to the gradient
g=(Jplus-Jminus)./(2*cj*Delta);
% Then, update the parameters
theta(:,j+1)=theta(:,j)-lambdaj*g;
end % End main loop...
best_theta=theta(:,100)
best_f=optexampfunction(best_theta)
%%%%%%%%%%%%%%%%%%%%%%%%%%%%%%%%%%%%%%%%%%%%%%%%%%%%%%
% Plot the function we are seeking the minimum of:
x=0:31/100:30;
% For our function the range of values we are considering
y=x;
% Compute the function that we are trying to find the minimum of.
for jj=1:length(x)
for ii=1:length(y)
z(ii,jj)=optexampfunction([x(jj);y(ii)]);
end
end
% First, show the actual function to be maximized
figure(1)
clf
�
surf(x,y,z);
colormap(jet)
% Use next line for generating plots to put in black and white documents.
colormap(white);
xlabel('x=\theta_1');
ylabel('y=\theta_2');
zlabel('z=J');
title('Function to be minimized');
%%%%%%%%%%%%%%%%%%%%%%%%%%%%%%%%%%%%%%%%%%%%%%%%%%%%%%%%%%%%%%%%%%%%%%%%%
% Next, provide some plots of the results of the simulation.
%%%%%%%%%%%%%%%%%%%%%%%%%%%%%%%%%%%%%%%%%%%%%%%%%%%%%%%%%%%%%%%%%%%%%%%%%
t=0:Nspsa; % For use in plotting
figure(2)
clf
plot(t,theta(1,:),'k-',t,theta(2,:),'k--')
ylabel('\theta_1, \theta_2')
xlabel('Iteration, j')
title('SPSA parameter trajectories')
figure(3)
clf
contour(x,y,z,25)
colormap(jet)
% Use next line for generating plots to put in black and white documents.
colormap(gray);
xlabel('x=\theta_1');
ylabel('y=\theta_2');
title('Function to be minimized (contour map)');
hold on
plot(theta(1,:),theta(2,:),'k-')
%%%%%%%%%%%%%%%%%%%%%%%%%%%%%%%%%%%%%%%%%%%%%%%%%%%%%%%%%%%%%%%%%%%%%%%%%
% End of program
�
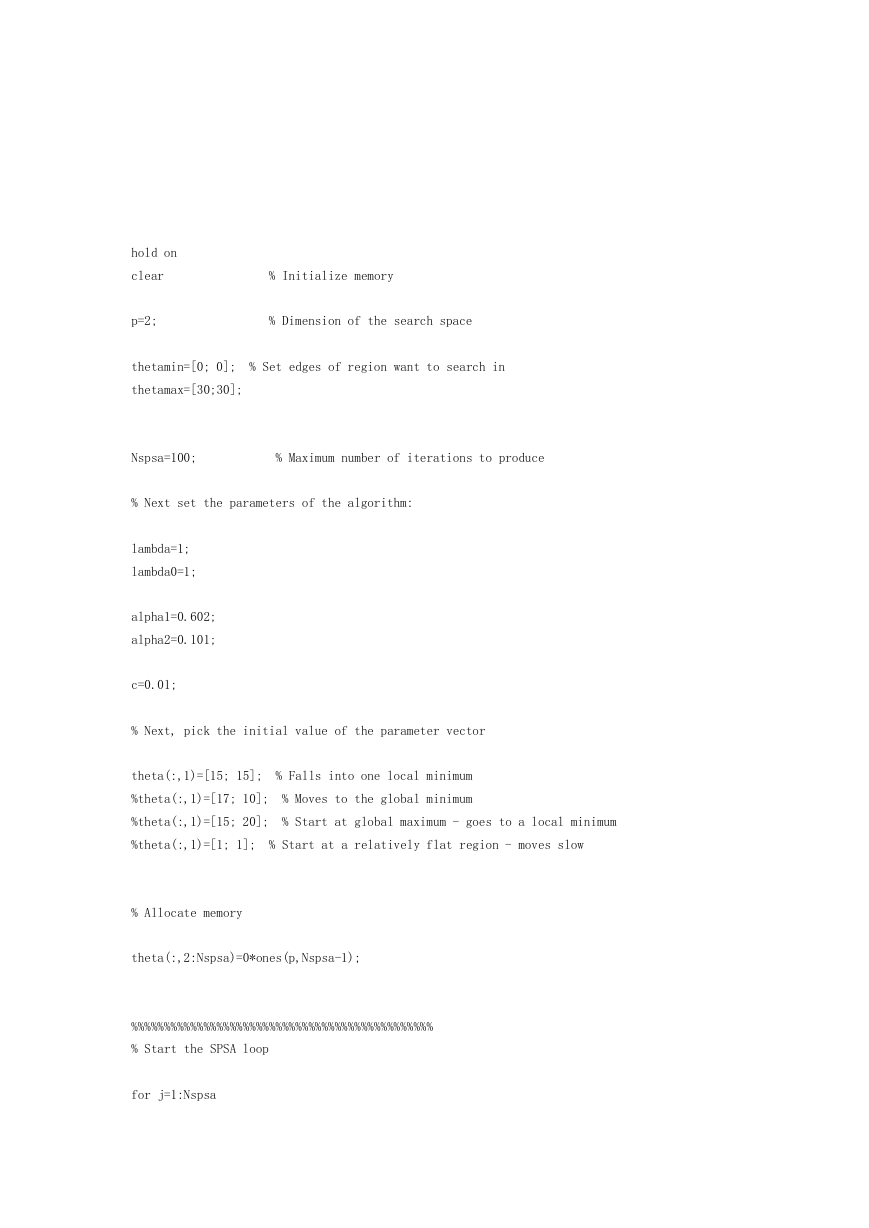
hold on
clear
% Initialize memory
p=2;
% Dimension of the search space
thetamin=[0; 0];
% Set edges of region want to search in
thetamax=[30;30];
Nspsa=100;
% Maximum number of iterations to produce
% Next set the parameters of the algorithm:
lambda=1;
lambda0=1;
alpha1=0.602;
alpha2=0.101;
c=0.01;
% Next, pick the initial value of the parameter vector
theta(:,1)=[15; 15]; % Falls into one local minimum
%theta(:,1)=[17; 10]; % Moves to the global minimum
%theta(:,1)=[15; 20]; % Start at global maximum - goes to a local minimum
%theta(:,1)=[1; 1]; % Start at a relatively flat region - moves slow
% Allocate memory
theta(:,2:Nspsa)=0*ones(p,Nspsa-1);
%%%%%%%%%%%%%%%%%%%%%%%%%%%%%%%%%%%%%%%%%%%%%%
% Start the SPSA loop
for j=1:Nspsa
�


 2023年江西萍乡中考道德与法治真题及答案.doc
 2012年重庆南川中考生物真题及答案.doc
 2013年江西师范大学地理学综合及文艺理论基础考研真题.doc
 2020年四川甘孜小升初语文真题及答案I卷.doc
 2020年注册岩土工程师专业基础考试真题及答案.doc
 2023-2024学年福建省厦门市九年级上学期数学月考试题及答案.doc
 2021-2022学年辽宁省沈阳市大东区九年级上学期语文期末试题及答案.doc
 2022-2023学年北京东城区初三第一学期物理期末试卷及答案.doc
 2018上半年江西教师资格初中地理学科知识与教学能力真题及答案.doc
 2012年河北国家公务员申论考试真题及答案-省级.doc
 2020-2021学年江苏省扬州市江都区邵樊片九年级上学期数学第一次质量检测试题及答案.doc
 2022下半年黑龙江教师资格证中学综合素质真题及答案.doc