International Journal of Modern Physics C
Vol. 26, No. 6 (2015) 1550071 (12 pages)
#.c World Scienti¯c Publishing Company
DOI: 10.1142/S0129183115500710
The multiscale analysis between stock market time series
Wenbin Shi* and Pengjian Shang†
School of Science, Beijing Jiaotong University
Beijing 100044, P. R. China
*11121739@bjtu.edu.cn
†pjshang@bjtu.edu.cn
Received 5 January 2014
Accepted 27 October 2014
Published 25 November 2014
This paper is devoted to multiscale cross-correlation analysis on stock market time series, where
multiscale DCCA cross-correlation coe±cient as well as multiscale cross-sample entropy
(MSCE) is applied. Multiscale DCCA cross-correlation coe±cient is a realization of DCCA
cross-correlation coe±cient on multiple scales. The results of this method present a good scaling
characterization. More signi¯cantly, this method is able to group stock markets by areas.
Compared to multiscale DCCA cross-correlation coe±cient, MSCE presents a more remarkable
scaling characterization and the value of each log return of ¯nancial time series decreases with
the increasing of scale factor. But the results of grouping is not as good as multiscale DCCA
cross-correlation coe±cient.
Keywords: DCCA cross-correlation coe±cient; multiscale cross-sample entropy; multiscale
analysis; stock market time series.
1. Introduction
In recent years, economy has become an active research area for physicists.
\Econophysics"1,2 is one of the great achievements which successfully applies sta-
tistical mechanics to the economic systems. A range of statistical tools has been
introduced to investigate stock markets, such as the correlation function, multi-
fractal, spin-glass models and complex networks.3–5 As a consequence, it is now found
that all those companies in the stock market are correlated and interconnected, so
the interaction therein is highly nonlinear, unstable and long-ranged.6 To quantify
the long range power-law correlations embedded in a nonstationary time series, the
method of detrended °uctuation analysis (DFA) was proposed.7 A few years later,
Podobnik and Stanley8 extended the DFA method into two time series, and
proposed the detrended cross-correlation analysis (DCCA). Studies using these
techniques have been applied widely,9–20 and they also o®er theoretical and practical
considerations.
1550071-1
Int. J. Mod. Phys. C Downloaded from www.worldscientific.comby BEIJING JIAOTONG UNIVERSITY on 11/25/14. For personal use only.�
W. Shi & P. Shang
Recently, Zebende proposed a DCCA cross-correlation coe±cient �,21 based on
DFA and DCCA. This approach is particularly useful to distinguish between posi-
tive, negative or absence of cross-correlation. The coe±cient always satis¯es �1 �
� � 1 according to the Cauchy–Schwarz inequality. In some cases, however, the
scaling behavior is more complicated, and di®erent scaling properties existed for
di®erent parts of the series. Recent studies showed higher complexity was found in
systems when they take into account the multiple temporal or spatial scales. Zhang22
proposed an innovative approach, based on a weighted sum of various coarse-grained
entropies over multiple scales, which yields higher values for correlated noises (1=f
noise) than uncorrelated ones (white noise). Costa et al.23–27 introduced the multi-
scale entropy (MSE) analysis to quantify the complexity of biological systems using
time series of heart rates and coding and noncoding DNA sequences. They found
correlated noise has a higher complexity level than uncorrelated noise over larger
time scales. Besides, pathologic dynamics associated with either increased regularity
or with increased variability due to loss of correlation properties are both charac-
terized by a reduction in complexity. In this work, we consider the DCCA cross-
correlation coe±cient in multiple scales and hope to ¯nd out the relationship between
this coe±cient and scale �. Then, we compare this method to multiscale cross-sample
entropy (MSCE)28 as veri¯cation.
Originating from signal processing, information is an important keyword in an-
alyzing the market or in estimating the stock price of a given company. A key
measure of information is entropy, which is usually expressed by the average number
of bits needed to store or communicate one symbol in a message. It is known that
entropy increases with the degree of disorder and is maximum for completely random
systems. However, an increase in the entropy may not always be associated with an
increase in dynamical complexity. Diseased systems, when associated with the
emergence of more regular behavior, show reduced entropy values compared to the
dynamical systems. Financial time series, be susceptible to market or government
policy, are linked with highly erratic °uctuations with statistical properties resem-
bling uncorrelated noise. Traditional algorithms will yield an increase in entropy
values for such noisy signals. This inconsistency may be related to the fact that
widely used entropy measures are based on single-scale analysis and do not take into
account the complex temporal °uctuations. Richman and Moorman29 introduced the
information theoretic inspired concept of cross-sample entropy (cross-SampEn),
which is based on the cross approximate entropy,30 aimed at analyzing the degree of
asynchrony between two related time series. For given two related time series, cross-
SampEn computes a non-negative value, where larger value corresponds to greater
asynchrony, smaller value corresponds to greater synchrony.31 The MSCE method is
based on MSE,23 it is the multiscale realization of cross-SampEn and is able to
analyze the complexity and correlation of two time series.
The rest part of this paper is organized as follows. Section 2 presents the multi-
scale procedure as well as two kinds of methods, DCCA cross-correlation coe±cient
and cross-SampEn. Section 3 brie°y describes the database used in our work.
1550071-2
Int. J. Mod. Phys. C Downloaded from www.worldscientific.comby BEIJING JIAOTONG UNIVERSITY on 11/25/14. For personal use only.�
The multiscale analysis between stock market time series
Section 4 is devoted to provide the detailed results for di®erent stock markets.
Finally, it ends with a conclusion.
2. Methods
2.1. Multiscale procedure
u ¼ ðuð1Þ; uð2Þ; . . . ; uðNÞÞ and v ¼ ðvð1Þ; vð2Þ; . . . ; vðNÞÞ are two synchronous time
series of length-N. We construct consecutive coarse-grained time series, fuð�Þg and
fvð�Þg, determined by the scale factor �. The coarse-graining process is like this: we
¯rst divide the original time series into nonoverlapping segments of length � and then
calculate the average of data points in each segment. Generally, each element of the
coarse-grained time series u
�
ð�Þ
ð�Þ
j and v
j are calculated referring to the equation
Xj�
i¼ðj�1Þ�þ1
Xj�
i¼ðj�1Þ�þ1
1 � j � N=�;
1 � j � N=�:
ui;
vi;
�
j ¼ 1
ð�Þ
j ¼ 1
ð�Þ
u
v
For scale one ð� ¼ 1Þ, the time series fuð1Þg and fvð1Þg are the original time series.
The length of each coarse-grained time series is equal to N=�.
Next, we calculate DCCA cross-correlation coe±cient as well as an entropy
measure (cross-sample entropy) for coarse-grained time series plotted as a function of
the scale factor �.
2.2. DCCA cross-correlation coe±cient
Time series always exhibit complex behavior such as self-a±nity, one of the most
frequently cited method to analyze time series of complex problems is the DFA.21
This method provides a relationship between FDFAðnÞ (root mean square °uctua-
tion) and the scale n, characterized for a power law FDFAðnÞ � n�. DFA method has
been very e±cient at detecting long-range auto-correlations embedded in a patch
landscape and also avoiding spurious detection of apparent long-range auto-corre-
lations. However, if we have two time series, fuð�Þg and fvð�Þg, the analysis of cross-
correlation can be applied. The DCCA method is a generalization of the DFA
method and is based on detrended covariance. This method is designed to investigate
power-law cross-correlations between di®erent simultaneously recorded time series in
the presence of nonstationarity. Therefore, for two time series of equal length N=�,
we compute two integrated signals Rk ¼
, where
k ¼ 1; . . . ; N=�. In the next step we divide the entire time series into N=� � n
overlapping boxes, each box containing n þ 1 values. For both time series, in each
box that starts at i and ends at i þ n, we de¯ne the local trend, ^Rk;i and
k;iði � k � i þ nÞ, to be the ordinate of a linear least-squares ¯t. We de¯ne the
^R0
detrended walk as the di®erence between the original walk and the local trend. Next,
and R0
k ¼
k
i¼1 u
P
P
k
i¼1 v
ð�Þ
i
ð�Þ
i
1550071-3
Int. J. Mod. Phys. C Downloaded from www.worldscientific.comby BEIJING JIAOTONG UNIVERSITY on 11/25/14. For personal use only.�
W. Shi & P. Shang
P
the
the
2
F
residuals
calculate
in each box f 2
we
1=ðn þ 1Þ
ance function by summing over all overlapping N=� � n boxes of size n:
DCCAðn; iÞ ¼
k;iÞ. Finally, we calculate the detrended covari-
covariance of
k � ^R0
k¼iðRk � ^Rk;iÞðR0
iþn
DCCA ¼ ðN=� � nÞ�1
XN=��n
i¼1
When Rk ¼ R0
DCCAðnÞ reduces to the detrended
k, the detrended covariance F 2
variance F 2
then
DCCAðnÞ � n2�. The � exponent quanti¯es the long-range power-law cross-corre-
F 2
lation. To quantify the level of cross-correlation, we can apply the DCCA cross-
correlation coe±cient, de¯ned as the ratio between the detrended covariance
function F 2
DFAðnÞ used in the DFA method.
DCCA and the detrended variance function FDFA.
self-a±nity appears,
DCCAðn; iÞ:
2
f
If
�DCCA ¼
F 2
DCCA
FDFAfyigFDFAfy 0
ig
:
This equation leads us to a new scale of cross-correlation in nonstationary time series.
The value of �DCCA ranges between �1 � �DCCA � 1. A value of �DCCA ¼ 0 means
there is no cross-correlation, �DCCA ¼ 1 means the cross-correlation between two
time series is perfect and �DCCA ¼ �1 means there is a perfect anti-cross-correlation.
To perform multiscale analysis, we use n ¼ 100 for all the experiments in this work.
2.3. Multiscale cross-sample entropy
2.3.1. De¯nition
We then calculate the cross-sample entropy between the two coarse-grained time
series fuð�Þg and fvð�Þg. m and r are input parameters, where m is embedding
dimension, and r is the tolerance for accepting matches. Form vector sequences
xmðiÞ ¼ ðuð�ÞðiÞ; uð�Þði þ 1Þ; . . . ; uð�Þði þ m � 1ÞÞ;
ymðjÞ ¼ ðvð�ÞðjÞ; vð�Þðj þ 1Þ; . . . ; vð�Þðj þ m � 1ÞÞ;
1 � i � N=� � m;
1 � j � N=� � m
for uð�Þ and vð�Þ, respectively.
For each i � N=� � m, set
i ðrÞðvð�Þjjuð�ÞÞ ¼ number of 1 � j � N=� � m such that d½xmðiÞ; ymðjÞ � r
B m
N=� � m
;
where
d½xmðiÞ; ymðjÞ ¼ maxfjuð�Þði þ kÞ � vð�Þðj þ kÞj : 0 � k � m � 1g
i.e. the maximum di®erence in their respective scalar components. B m
the probability that any ymðjÞ is within r of xmðiÞ. Then, de¯ne
i ðrÞðvð�Þjjuð�ÞÞ
B m
N=� � m
BmðrÞðvð�Þjjuð�ÞÞ ¼
N=��m
i¼1
P
i ðvð�Þjjuð�ÞÞ is
which is the average value of B m
i ðrÞðvð�Þjjuð�ÞÞ.
1550071-4
Int. J. Mod. Phys. C Downloaded from www.worldscientific.comby BEIJING JIAOTONG UNIVERSITY on 11/25/14. For personal use only.�
Similarly, we de¯ne
The multiscale analysis between stock market time series
i ðrÞðvð�Þjjuð�ÞÞ ¼ number of 1 � j � N=� � m such that d½xmþ1ðiÞ; ymþ1ðjÞ � r
A m
N=� � m
and
AmðrÞðvð�Þjjuð�ÞÞ ¼
P
N=��m
i¼1
i ðrÞðvð�Þjjuð�ÞÞ
A m
N=� � m
which is the average value of A m
i ðrÞðvð�Þjjuð�ÞÞ.
In this way, BmðrÞðvð�Þjjuð�ÞÞ is the probability that the two templates matches for
m points, and AmðrÞðvð�Þjjuð�ÞÞ is the probability that the two templates matches for
m þ 1 points.
Finally, we de¯ne
cross � SampEn ¼ � ln
�
�
:
AmðrÞðvð�Þjjuð�ÞÞ
BmðrÞðvð�Þjjuð�ÞÞ
Set B ¼ ðN=� � mÞ2BmðrÞðvð�Þjjuð�ÞÞ and A ¼ ðN=� � mÞ2AmðrÞðvð�Þjjuð�ÞÞ, so
that B is the total number of pairs of vectors of length m from the two series that
match within r, and A is the number of pairs of forward matches of length m þ 1.
2.3.2. The con¯dence interval of the cross-SampEn
We extend the computation of con¯dence interval for SampEn32 to cross-SampEn.
Let CP ¼ A=B, which estimates the conditional probability of a match of length
m þ 1 given there is a match of length m. The number of matches of length m þ 1
can be expressed as
X
A ¼
Uij; where Uij ¼ 1 if d½xmþ1ðiÞ; ymþ1ðjÞ � r;
0 otherwise:
�
The summation can be restricted to the B pairs ði; jÞ of matches of length m, where
d½xmðiÞ; ymðjÞ � r. Thus, the variance of CP is
X
X
CP ¼ VarðAÞ
B2 ¼ 1
For the B pairs where i ¼ k and j ¼ l
� 2
B2
CovðUij; UklÞ:
i;j
k;l
CovðUij; UklÞ ¼ VarðUijÞ ¼ CPð1 � CPÞ:
If the templates involved for Uij and Ukl have no points in common, they are inde-
pendent and thus uncorrelated so that CovðUij; UklÞ ¼ 0. If the templates overlap,
i.e. minfji � kj;jj � ljg � m the covariance can be estimated by UijUkl � CP2, which
is 1 � CP2 when both pairs of m þ 1 templates match and �CP2 otherwise. So the
1550071-5
Int. J. Mod. Phys. C Downloaded from www.worldscientific.comby BEIJING JIAOTONG UNIVERSITY on 11/25/14. For personal use only.�
W. Shi & P. Shang
variance of CP is estimated as
CP ¼ CPð1 � CPÞ
� 2
B
þ 1
B2 ½KA � KBðCPÞ2;
where KA is the number of pairs of matching templates of length m þ 1 that overlap
and KB is the number of pairs of matching templates of length m that overlap. Using
the standard approximation �gðCPÞ � jg0ðCPÞj�CP with gðCPÞ ¼ � logðCPÞ and the
¯rst derivative g0ðCPÞ ¼ 1=�CP, the standard error of cross-SampEn can be esti-
mated by �CP=CP. As Lake et al.33 did, the cross-SampEn is assumed to be normally
distributed, and we de¯ne the 95% con¯dence interval for each cross-SampEn
calculation to be
�logðCPÞ � 1:96ð�CP=CPÞ:
2.3.3. Choosing the parameters m and r
General experiences lead to the use of values of r between 0:1 and 0:25 and values of
m of 1 or 2 for data records of length N ranging from 100 to 5000.32 In this paper, we
determine m according to the estimated AR process order of each return time series,
where the AR process order is estimated using the maximum likelihood method and
the AIC criteria. We use the criterion proposed by Lake et al.33 to select r which
minimizes the quantity
�
�
max
�CP
CP
;
�CP
�logðCPÞCP
that is the maximum of the relative error of SampEn and the CP estimator,
respectively.
3. Data
The analyzed dataset consists of six indices: three US stock indices, Dow Jones Index
(DJI), Nasdaq Composite Index (NAS) and Standard & Poor's 500 index (S&P500)
together with three Chinese stock indices, Hang Seng Index (HSI), Shanghai secu-
rities composite index (SSEC) and Shenzhen Stock Exchange Component Index
(SZSE). The data are recorded every day of closing prices from 3rd April, 1991, to
13th November, 2013. Because of the US stock markets and the Chinese stock
markets have the di®erent opening dates. So, we exclude or complement the asyn-
chronous datum and then reconnect the remaining parts of the original series to
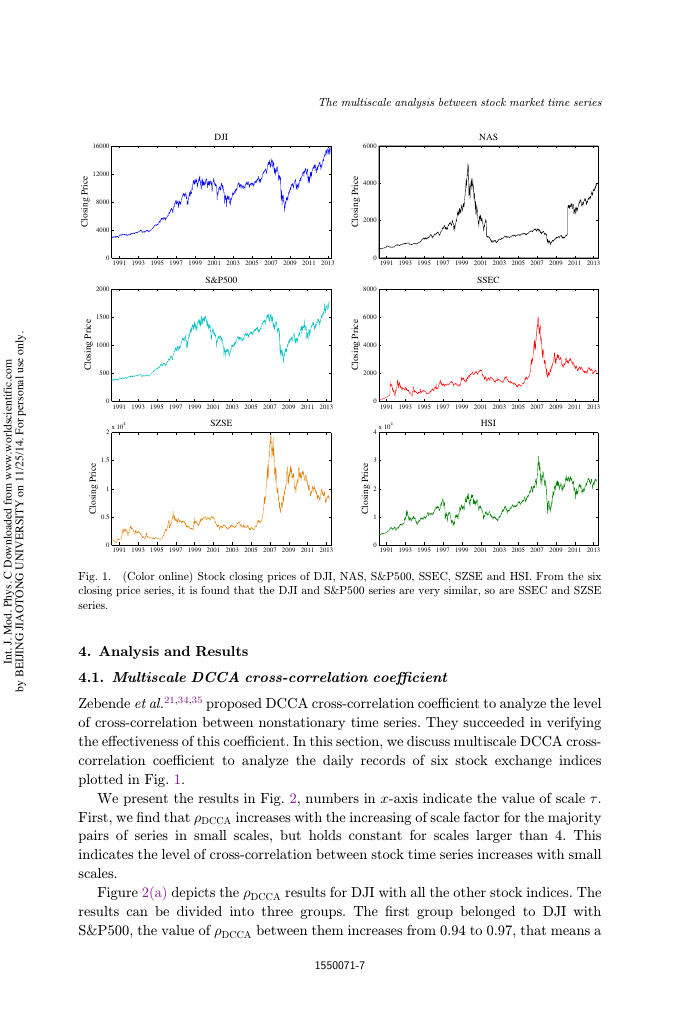
obtain the same length time series. The overall run of indices after the preprocessing
is displayed in Fig. 1.
In practice, we usually apply standardized time series. Denoting the stock market
index as fxðtÞg, the logarithmic daily return is de¯ned by gðtÞ ¼ logðxðtÞÞ�
logðxðt � 1ÞÞ. The normalized daily return is de¯ned as RðtÞ ¼ ðgðtÞ � hgðtÞiÞ=�,
where � is the standard deviation of the series gðtÞ.
1550071-6
Int. J. Mod. Phys. C Downloaded from www.worldscientific.comby BEIJING JIAOTONG UNIVERSITY on 11/25/14. For personal use only.�
DJI
16000
12000
The multiscale analysis between stock market time series
6000
4000
2000
0
8000
6000
4000
2000
e
c
i
r
P
g
n
i
s
o
l
C
e
c
i
r
P
g
n
i
s
o
l
C
0
4
3
2
1
0
e
c
i
r
P
g
n
i
s
o
l
C
NAS
1991 1993 1995 1997 1999 2001 2003 2005 2007 2009 2011 2013
SSEC
1991 1993 1995 1997 1999 2001 2003 2005 2007 2009 2011 2013
x 104
HSI
1991 1993 1995 1997 1999 2001 2003 2005 2007 2009 2011 2013
e
c
i
r
P
g
n
i
s
o
l
C
e
c
i
r
P
g
n
i
s
o
l
C
1991 1993 1995 1997 1999 2001 2003 2005 2007 2009 2011 2013
S&P500
8000
4000
0
2000
1500
1000
500
0
2
1.5
1
0.5
0
e
c
i
r
P
g
n
i
s
o
l
C
1991 1993 1995 1997 1999 2001 2003 2005 2007 2009 2011 2013
x 104
SZSE
1991 1993 1995 1997 1999 2001 2003 2005 2007 2009 2011 2013
Fig. 1.
(Color online) Stock closing prices of DJI, NAS, S&P500, SSEC, SZSE and HSI. From the six
closing price series, it is found that the DJI and S&P500 series are very similar, so are SSEC and SZSE
series.
4. Analysis and Results
4.1. Multiscale DCCA cross-correlation coe±cient
Zebende et al.21,34,35 proposed DCCA cross-correlation coe±cient to analyze the level
of cross-correlation between nonstationary time series. They succeeded in verifying
the e®ectiveness of this coe±cient. In this section, we discuss multiscale DCCA cross-
correlation coe±cient to analyze the daily records of six stock exchange indices
plotted in Fig. 1.
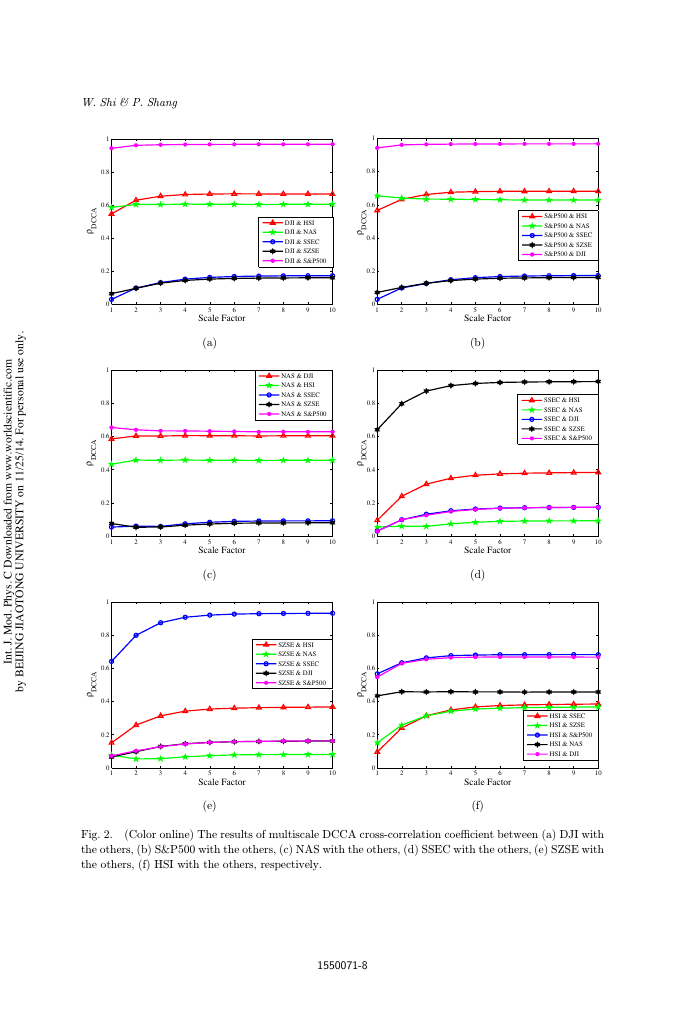
We present the results in Fig. 2, numbers in x-axis indicate the value of scale �.
First, we ¯nd that �DCCA increases with the increasing of scale factor for the majority
pairs of series in small scales, but holds constant for scales larger than 4. This
indicates the level of cross-correlation between stock time series increases with small
scales.
Figure 2(a) depicts the �DCCA results for DJI with all the other stock indices. The
results can be divided into three groups. The ¯rst group belonged to DJI with
S&P500, the value of �DCCA between them increases from 0.94 to 0.97, that means a
1550071-7
Int. J. Mod. Phys. C Downloaded from www.worldscientific.comby BEIJING JIAOTONG UNIVERSITY on 11/25/14. For personal use only.�
W. Shi & P. Shang
1
0.8
0.6
0.4
0.2
A
C
C
D
ρ
0
1
2
3
4
1
0.8
0.6
0.4
0.2
A
C
C
D
ρ
0
1
2
3
4
1
0.8
0.6
0.4
0.2
A
C
C
D
ρ
0
1
2
3
4
DJI & HSI
DJI & NAS
DJI & SSEC
DJI & SZSE
DJI & S&P500
7
8
9
10
NAS & DJI
NAS & HSI
NAS & SSEC
NAS & SZSE
NAS & S&P500
7
8
9
10
SZSE & HSI
SZSE & NAS
SZSE & SSEC
SZSE & DJI
SZSE & S&P500
7
8
9
10
5
6
Scale Factor
(a)
5
6
Scale Factor
(c)
5
6
Scale Factor
1
0.8
0.6
A
C
C
D
ρ
0.4
0.2
0
1
1
0.8
0.6
A
C
C
D
ρ
0.4
0.2
0
1
1
0.8
0.6
2
3
4
2
3
4
5
6
Scale Factor
(b)
5
6
Scale Factor
(d)
A
C
C
D
ρ
0.4
0.2
0
1
2
3
4
5
6
Scale Factor
S&P500 & HSI
S&P500 & NAS
S&P500 & SSEC
S&P500 & SZSE
S&P500 & DJI
7
8
9
10
SSEC & HSI
SSEC & NAS
SSEC & DJI
SSEC & SZSE
SSEC & S&P500
7
8
9
10
HSI & SSEC
HSI & SZSE
HSI & S&P500
HSI & NAS
HSI & DJI
7
8
9
10
(e)
(f)
Fig. 2.
(Color online) The results of multiscale DCCA cross-correlation coe±cient between (a) DJI with
the others, (b) S&P500 with the others, (c) NAS with the others, (d) SSEC with the others, (e) SZSE with
the others, (f) HSI with the others, respectively.
1550071-8
Int. J. Mod. Phys. C Downloaded from www.worldscientific.comby BEIJING JIAOTONG UNIVERSITY on 11/25/14. For personal use only.�



 2023年江西萍乡中考道德与法治真题及答案.doc
 2012年重庆南川中考生物真题及答案.doc
 2013年江西师范大学地理学综合及文艺理论基础考研真题.doc
 2020年四川甘孜小升初语文真题及答案I卷.doc
 2020年注册岩土工程师专业基础考试真题及答案.doc
 2023-2024学年福建省厦门市九年级上学期数学月考试题及答案.doc
 2021-2022学年辽宁省沈阳市大东区九年级上学期语文期末试题及答案.doc
 2022-2023学年北京东城区初三第一学期物理期末试卷及答案.doc
 2018上半年江西教师资格初中地理学科知识与教学能力真题及答案.doc
 2012年河北国家公务员申论考试真题及答案-省级.doc
 2020-2021学年江苏省扬州市江都区邵樊片九年级上学期数学第一次质量检测试题及答案.doc
 2022下半年黑龙江教师资格证中学综合素质真题及答案.doc