Note: The following table appears in the printed Annual Report on the facing page of the Chairman's Letter
Berkshire’s Corporate Performance vs. the S&P 500
Annual Percentage Change
in S&P 500
in Per-Share
Book Value of with Dividends
Berkshire
Included
Year
1965
1966
1967
1968
1969
1970
1971
1972
1973
1974
1975
1976
1977
1978
1979
1980
1981
1982
1983
1984
1985
1986
1987
1988
1989
1990
1991
1992
1993
1994
1995
1996
1997
1998
1999
2000
2001
2002
2003
2004
2005
..................................................
..................................................
..................................................
..................................................
..................................................
..................................................
..................................................
..................................................
..................................................
..................................................
..................................................
..................................................
..................................................
..................................................
..................................................
..................................................
..................................................
..................................................
..................................................
..................................................
..................................................
..................................................
..................................................
..................................................
..................................................
..................................................
..................................................
..................................................
..................................................
..................................................
..................................................
..................................................
..................................................
..................................................
..................................................
..................................................
..................................................
..................................................
..................................................
..................................................
..................................................
(1)
23.8
20.3
11.0
19.0
16.2
12.0
16.4
21.7
4.7
5.5
21.9
59.3
31.9
24.0
35.7
19.3
31.4
40.0
32.3
13.6
48.2
26.1
19.5
20.1
44.4
7.4
39.6
20.3
14.3
13.9
43.1
31.8
34.1
48.3
.5
6.5
(6.2)
10.0
21.0
10.5
6.4
Relative
Results
(1)-(2)
13.8
32.0
(19.9)
8.0
24.6
8.1
1.8
2.8
19.5
31.9
(15.3)
35.7
39.3
17.6
17.5
(13.0)
36.4
18.6
9.9
7.5
16.6
7.5
14.4
3.5
12.7
10.5
9.1
12.7
4.2
12.6
5.5
8.8
.7
19.7
(20.5)
15.6
5.7
32.1
(7.7)
(.4)
1.5
(2)
10.0
(11.7)
30.9
11.0
(8.4)
3.9
14.6
18.9
(14.8)
(26.4)
37.2
23.6
(7.4)
6.4
18.2
32.3
(5.0)
21.4
22.4
6.1
31.6
18.6
5.1
16.6
31.7
(3.1)
30.5
7.6
10.1
1.3
37.6
23.0
33.4
28.6
21.0
(9.1)
(11.9)
(22.1)
28.7
10.9
4.9
Average Annual Gain — 1965-2005
Overall Gain — 1964-2005
21.5
305,134
10.3
5,583
11.2
Notes: Data are for calendar years with these exceptions: 1965 and 1966, year ended 9/30; 1967, 15 months ended 12/31.
Starting in 1979, accounting rules required insurance companies to value the equity securities they hold at market
rather than at the lower of cost or market, which was previously the requirement. In this table, Berkshire’s results
through 1978 have been restated to conform to the changed rules. In all other respects, the results are calculated using
the numbers originally reported.
The S&P 500 numbers are pre-tax whereas the Berkshire numbers are after-tax. If a corporation such as Berkshire
were simply to have owned the S&P 500 and accrued the appropriate taxes, its results would have lagged the S&P 500
in years when that index showed a positive return, but would have exceeded the S&P 500 in years when the index
showed a negative return. Over the years, the tax costs would have caused the aggregate lag to be substantial.
2
�
BERKSHIRE HATHAWAY INC.
To the Shareholders of Berkshire Hathaway Inc.:
Our gain in net worth during 2005 was $5.6 billion, which increased the per-share book value of
both our Class A and Class B stock by 6.4%. Over the last 41 years (that is, since present management
took over) book value has grown from $19 to $59,377, a rate of 21.5% compounded annually.*
Berkshire had a decent year in 2005. We initiated five acquisitions (two of which have yet to
close) and most of our operating subsidiaries prospered. Even our insurance business in its entirety did
well, though Hurricane Katrina inflicted record losses on both Berkshire and the industry. We estimate our
loss from Katrina at $2.5 billion – and her ugly sisters, Rita and Wilma, cost us an additional $.9 billion.
Credit GEICO – and its brilliant CEO, Tony Nicely – for our stellar insurance results in a disaster-
ridden year. One statistic stands out: In just two years, GEICO improved its productivity by 32%.
Remarkably, employment fell by 4% even as policy count grew by 26% – and more gains are in store.
When we drive unit costs down in such a dramatic manner, we can offer ever-greater value to our
customers. The payoff: Last year, GEICO gained market-share, earned commendable profits and
strengthened its brand. If you have a new son or grandson in 2006, name him Tony.
* * * * * * * * * * * *
My goal in writing this report is to give you the information you need to estimate Berkshire’s
intrinsic value. I say “estimate” because calculations of intrinsic value, though all-important, are
necessarily imprecise and often seriously wrong. The more uncertain the future of a business, the more
possibility there is that the calculation will be wildly off-base. (For an explanation of intrinsic value, see
pages 77 – 78.) Here Berkshire has some advantages: a wide variety of relatively-stable earnings streams,
combined with great liquidity and minimum debt. These factors mean that Berkshire’s intrinsic value can
be more precisely calculated than can the intrinsic value of most companies.
Yet if precision is aided by Berkshire’s financial characteristics, the job of calculating intrinsic
value has been made more complex by the mere presence of so many earnings streams. Back in 1965,
when we owned only a small textile operation, the task of calculating intrinsic value was a snap. Now we
own 68 distinct businesses with widely disparate operating and financial characteristics. This array of
unrelated enterprises, coupled with our massive investment holdings, makes it impossible for you to simply
examine our consolidated financial statements and arrive at an informed estimate of intrinsic value.
We have attempted to ease this problem by clustering our businesses into four logical groups, each
of which we discuss later in this report. In these discussions, we will provide the key figures for both the
group and its important components. Of course, the value of Berkshire may be either greater or less than
the sum of these four parts. The outcome depends on whether our many units function better or worse by
being part of a larger enterprise and whether capital allocation improves or deteriorates when it is under the
direction of a holding company. In other words, does Berkshire ownership bring anything to the party, or
would our shareholders be better off if they directly owned shares in each of our 68 businesses? These are
important questions but ones that you will have to answer for yourself.
Before we look at our individual businesses, however, let’s review two sets of figures that show
where we’ve come from and where we are now. The first set is the amount of investments (including cash
and cash-equivalents) we own on a per-share basis. In making this calculation, we exclude investments
held in our finance operation because these are largely offset by borrowings:
*All figures used in this report apply to Berkshire’s A shares, the successor to the only stock that
the company had outstanding before 1996. The B shares have an economic interest equal to 1/30th that of
the A.
3
�
Per-Share Investments*
Year
1965 .....................................................................
1975 .....................................................................
1985 .....................................................................
1995 .....................................................................
2005 .....................................................................
Compound Growth Rate 1965-2005....................
Compound Growth Rate 1995-2005....................
*Net of minority interests
$ 4
159
2,407
21,817
$74,129
28.0%
13.0%
In addition to these marketable securities, which with minor exceptions are held in our insurance
companies, we own a wide variety of non-insurance businesses. Below, we show the pre-tax earnings
(excluding goodwill amortization) of these businesses, again on a per-share basis:
Per-Share Earnings*
Year
1965 .....................................................................
1975 .....................................................................
1985 .....................................................................
1995 .....................................................................
2005 .....................................................................
Compound Growth Rate 1965-2005....................
Compound Growth Rate 1995-2005....................
*Pre-tax and net of minority interests
$ 4
4
52
175
$2,441
17.2%
30.2%
When growth rates are under discussion, it will pay you to be suspicious as to why the beginning
and terminal years have been selected. If either year was aberrational, any calculation of growth will be
distorted. In particular, a base year in which earnings were poor can produce a breathtaking, but
meaningless, growth rate. In the table above, however, the base year of 1965 was abnormally good;
Berkshire earned more money in that year than it did in all but one of the previous ten.
As you can see from the two tables, the comparative growth rates of Berkshire’s two elements of
value have changed in the last decade, a result reflecting our ever-increasing emphasis on business
acquisitions. Nevertheless, Charlie Munger, Berkshire’s Vice Chairman and my partner, and I want to
increase the figures in both tables. In this ambition, we hope – metaphorically – to avoid the fate of the
elderly couple who had been romantically challenged for some time. As they finished dinner on their 50th
anniversary, however, the wife – stimulated by soft music, wine and candlelight – felt a long-absent tickle
and demurely suggested to her husband that they go upstairs and make love. He agonized for a moment
and then replied, “I can do one or the other, but not both.”
Acquisitions
Over the years, our current businesses, in aggregate, should deliver modest growth in operating
earnings. But they will not in themselves produce truly satisfactory gains. We will need major acquisitions
to get that job done.
In this quest, 2005 was encouraging. We agreed to five purchases: two that were completed last
year, one that closed after yearend and two others that we expect to close soon. None of the deals involve
the issuance of Berkshire shares. That’s a crucial, but often ignored, point: When a management proudly
acquires another company for stock, the shareholders of the acquirer are concurrently selling part of their
interest in everything they own. I’ve made this kind of deal a few times myself – and, on balance, my
actions have cost you money.
4
�
Here are last year’s purchases:
• On June 30 we bought Medical Protective Company (“MedPro”), a 106-year-old medical
malpractice insurer based in Fort Wayne. Malpractice insurance is tough to underwrite and has
proved to be a graveyard for many insurers. MedPro nevertheless should do well. It will have the
attitudinal advantage that all Berkshire insurers share, wherein underwriting discipline trumps all
other goals. Additionally, as part of Berkshire, MedPro has financial strength far exceeding that of
its competitors, a quality assuring doctors that long-to-settle claims will not end up back on their
doorstep because their insurer failed. Finally, the company has a smart and energetic CEO, Tim
Kenesey, who instinctively thinks like a Berkshire manager.
• Forest River, our second acquisition, closed on August 31. A couple of months earlier, on June
21, I received a two-page fax telling me – point by point – why Forest River met the acquisition
criteria we set forth on page 25 of this report. I had not before heard of the company, a
recreational vehicle manufacturer with $1.6 billion of sales, nor of Pete Liegl, its owner and
manager. But the fax made sense, and I immediately asked for more figures. These came the next
morning, and that afternoon I made Pete an offer. On June 28, we shook hands on a deal.
Pete is a remarkable entrepreneur. Some years back, he sold his business, then far smaller than
today, to an LBO operator who promptly began telling him how to run the place. Before long,
Pete left, and the business soon sunk into bankruptcy. Pete then repurchased it. You can be sure
that I won’t be telling Pete how to manage his operation.
Forest River has 60 plants, 5,400 employees and has consistently gained share in the RV business,
while also expanding into other areas such as boats. Pete is 61 – and definitely in an acceleration
mode. Read the piece from RV Business that accompanies this report, and you’ll see why Pete and
Berkshire are made for each other.
• On November 12, 2005, an article ran in The Wall Street Journal dealing with Berkshire’s unusual
acquisition and managerial practices. In it Pete declared, “It was easier to sell my business than to
renew my driver’s license.”
In New York, Cathy Baron Tamraz read the article, and it struck a chord. On November 21, she
sent me a letter that began, “As president of Business Wire, I’d like to introduce you to my
company, as I believe it fits the profile of Berkshire Hathaway subsidiary companies as detailed in
a recent Wall Street Journal article.”
By the time I finished Cathy’s two-page letter, I felt Business Wire and Berkshire were a fit. I
particularly liked her penultimate paragraph: “We run a tight ship and keep unnecessary spending
under wraps. No secretaries or management layers here. Yet we’ll invest big dollars to gain a
technological advantage and move the business forward.”
I promptly gave Cathy a call, and before long Berkshire had reached agreement with Business
Wire’s controlling shareholder, Lorry Lokey, who founded the company in 1961 (and who had
just made Cathy CEO). I love success stories like Lorry’s. Today 78, he has built a company that
disseminates information in 150 countries for 25,000 clients. His story, like those of many
entrepreneurs who have selected Berkshire as a home for their life’s work, is an example of what
can happen when a good idea, a talented individual and hard work converge.
In December we agreed to buy 81% of Applied Underwriters, a company that offers a combination
of payroll services and workers’ compensation insurance to small businesses. A majority of
Applied’s customers are located in California.
•
5
�
In 1998, though, when the company had 12 employees, it acquired an Omaha-based operation
with 24 employees that offered a somewhat-similar service. Sid Ferenc and Steve Menzies, who
have built Applied’s remarkable business, concluded that Omaha had many advantages as an
operational base – a brilliant insight, I might add – and today 400 of the company’s 479
employees are located here.
Less than a year ago, Applied entered into a large reinsurance contract with Ajit Jain, the
extraordinary manager of National Indemnity’s reinsurance division. Ajit was impressed by Sid
and Steve, and they liked Berkshire’s method of operation. So we decided to join forces. We are
pleased that Sid and Steve retain 19% of Applied. They started on a shoestring only 12 years ago,
and it will be fun to see what they can accomplish with Berkshire’s backing.
• Last spring, MidAmerican Energy, our 80.5% owned subsidiary, agreed to buy PacifiCorp, a
major electric utility serving six Western states. An acquisition of this sort requires many
regulatory approvals, but we’ve now obtained these and expect to close this transaction soon.
Berkshire will then buy $3.4 billion of MidAmerican’s common stock, which MidAmerican will
supplement with $1.7 billion of borrowing to complete the purchase. You can’t expect to earn
outsized profits in regulated utilities, but the industry offers owners the opportunity to deploy large
sums at fair returns – and therefore, it makes good sense for Berkshire. A few years back, I said
that we hoped to make some very large purchases in the utility field. Note the plural – we’ll be
looking for more.
Let’s now talk about our four sectors and start with insurance, our core business. What counts
In addition to buying these new operations, we continue to make “bolt-on” acquisitions. Some
aren’t so small: Shaw, our carpet operation, spent about $550 million last year on two purchases that
furthered its vertical integration and should improve its profit margin in the future. XTRA and Clayton
Homes also made value-enhancing acquisitions.
Unlike many business buyers, Berkshire has no “exit strategy.” We buy to keep. We do, though,
have an entrance strategy, looking for businesses in this country or abroad that meet our six criteria and are
available at a price that will produce a reasonable return. If you have a business that fits, give me a call.
Like a hopeful teenage girl, I’ll be waiting by the phone.
Insurance
here is the amount of “float” and its cost over time.
For new readers, let me explain. “Float” is money that doesn’t belong to us but that we
temporarily hold. Most of our float arises because (1) premiums are paid upfront though the service we
provide – insurance protection – is delivered over a period that usually covers a year and; (2) loss events
that occur today do not always result in our immediately paying claims, because it sometimes takes many
years for losses to be reported (asbestos losses would be an example), negotiated and settled. The $20
million of float that came with our 1967 entry into insurance has now increased – both by way of internal
growth and acquisitions – to $49 billion.
Float is wonderful – if it doesn’t come at a high price. Its cost is determined by underwriting
results, meaning how the expenses and losses we will ultimately pay compare with the premiums we have
received. When an insurer earns an underwriting profit – as has been the case at Berkshire in about half of
the 39 years we have been in the insurance business – float is better than free. In such years, we are
actually paid for holding other people’s money. For most insurers, however, life has been far more
difficult: In aggregate, the property-casualty industry almost invariably operates at an underwriting loss.
When that loss is large, float becomes expensive, sometimes devastatingly so.
6
�
In 2004 our float cost us less than nothing, and I told you that we had a chance – absent a mega-
catastrophe – of no-cost float in 2005. But we had the mega-cat, and as a specialist in that coverage,
Berkshire suffered hurricane losses of $3.4 billion. Nevertheless, our float was costless in 2005 because of
the superb results we had in our other insurance activities, particularly at GEICO.
* * * * * * * * * * * *
Auto policies in force grew by 12.1% at GEICO, a gain increasing its market share of U.S. private
passenger auto business from about 5.6% to about 6.1%. Auto insurance is a big business: Each share-
point equates to $1.6 billion in sales.
While our brand strength is not quantifiable, I believe it also grew significantly. When Berkshire
acquired control of GEICO in 1996, its annual advertising expenditures were $31 million. Last year we
were up to $502 million. And I can’t wait to spend more.
Our advertising works because we have a great story to tell: More people can save money by
insuring with us than is the case with any other national carrier offering policies to all comers. (Some
specialized auto insurers do particularly well for applicants fitting into their niches; also, because our
national competitors use rating systems that differ from ours, they will sometimes beat our price.) Last
year, we achieved by far the highest conversion rate – the percentage of internet and phone quotes turned
into sales – in our history. This is powerful evidence that our prices are more attractive relative to the
competition than ever before. Test us by going to GEICO.com or by calling 800-847-7536. Be sure to
indicate you are a shareholder because that fact will often qualify you for a discount.
I told you last year about GEICO’s entry into New Jersey in August, 2004. Drivers in that state
love us. Our retention rate there for new policyholders is running higher than in any other state, and by
sometime in 2007, GEICO is likely to become the third largest auto insurer in New Jersey. There, as
elsewhere, our low costs allow low prices that lead to steady gains in profitable business.
That simple formula immediately impressed me 55 years ago when I first discovered GEICO.
Indeed, at age 21, I wrote an article about the company – it’s reproduced on page 24 – when its market
value was $7 million. As you can see, I called GEICO “The Security I Like Best.” And that’s what I still
call it.
* * * * * * * * * * * *
We have major reinsurance operations at General Re and National Indemnity. The former is run
by Joe Brandon and Tad Montross, the latter by Ajit Jain. Both units performed well in 2005 considering
the extraordinary hurricane losses that battered the industry.
It’s an open question whether atmospheric, oceanic or other causal factors have dramatically
changed the frequency or intensity of hurricanes. Recent experience is worrisome. We know, for instance,
that in the 100 years before 2004, about 59 hurricanes of Category 3 strength, or greater, hit the
Southeastern and Gulf Coast states, and that only three of these were Category 5s. We further know that in
2004 there were three Category 3 storms that hammered those areas and that these were followed by four
more in 2005, one of them, Katrina, the most destructive hurricane in industry history. Moreover, there
were three Category 5s near the coast last year that fortunately weakened before landfall.
Was this onslaught of more frequent and more intense storms merely an anomaly? Or was it
caused by changes in climate, water temperature or other variables we don’t fully understand? And could
these factors be developing in a manner that will soon produce disasters dwarfing Katrina?
Joe, Ajit and I don’t know the answer to these all-important questions. What we do know is that
our ignorance means we must follow the course prescribed by Pascal in his famous wager about the
existence of God. As you may recall, he concluded that since he didn’t know the answer, his personal
gain/loss ratio dictated an affirmative conclusion.
7
�
So guided, we’ve concluded that we should now write mega-cat policies only at prices far higher
than prevailed last year – and then only with an aggregate exposure that would not cause us distress if shifts
in some important variable produce far more costly storms in the near future. To a lesser degree, we felt
this way after 2004 – and cut back our writings when prices didn’t move. Now our caution has intensified.
If prices seem appropriate, however, we continue to have both the ability and the appetite to be the largest
writer of mega-cat coverage in the world.
* * * * * * * * * * * *
Our smaller insurers, with MedPro added to the fold, delivered truly outstanding results last year.
However, what you see in the table below does not do full justice to their performance. That’s because we
increased the loss reserves of MedPro by about $125 million immediately after our purchase.
No one knows with any precision what amount will be required to pay the claims we inherited.
Medical malpractice insurance is a “long-tail” line, meaning that claims often take many years to settle. In
addition, there are other losses that have occurred, but that we won’t even hear about for some time. One
thing, though, we have learned – the hard way – after many years in the business: Surprises in insurance are
far from symmetrical. You are lucky if you get one that is pleasant for every ten that go the other way.
Too often, however, insurers react to looming loss problems with optimism. They behave like the fellow in
a switchblade fight who, after his opponent has taken a mighty swipe at his throat, exclaimed, “You never
touched me.” His adversary’s reply: “Just wait until you try to shake your head.”
Excluding the reserves we added for prior periods, MedPro wrote at an underwriting profit. And
our other primary companies, in aggregate, had an underwriting profit of $324 million on $1,270 million of
volume. This is an extraordinary result, and our thanks go to Rod Eldred of Berkshire Hathaway
Homestate Companies, John Kizer of Central States Indemnity, Tom Nerney of U. S. Liability, Don Towle
of Kansas Bankers Surety and Don Wurster of National Indemnity.
Here’s the overall tally on our underwriting and float for each major sector of insurance:
Underwriting Profit (Loss)
(in $ millions)
Insurance Operations
General Re .......................
B-H Reinsurance..............
GEICO .............................
Other Primary...................
Total.................................
2005
$( 334)
(1,069)
1,221
235*
$ 53
*Includes MedPro from June 30, 2005.
2004
$ 3
417
970
161
$1,551
Yearend Float
2004
$23,120
15,278
5,960
1,736
$46,094
2005
$22,920
16,233
6,692
3,442
$49,287
Regulated Utility Business
We have an 80.5% (fully diluted) interest in MidAmerican Energy Holdings, which owns a wide
variety of utility operations. The largest of these are (1) Yorkshire Electricity and Northern Electric, whose
3.7 million electric customers make it the third largest distributor of electricity in the U.K.; (2)
MidAmerican Energy, which serves 706,000 electric customers, primarily in Iowa; and (3) Kern River and
Northern Natural pipelines, which carry 7.8% of the natural gas consumed in the U.S. When our PacifiCorp
acquisition closes, we will add 1.6 million electric customers in six Western states, with Oregon and Utah
providing us the most business. This transaction will increase MidAmerican’s revenues by $3.3 billion and
its assets by $14.1 billion.
8
�
The Public Utility Holding Company Act (“PUHCA”) was repealed on August 8, 2005, a
milestone that allowed Berkshire to convert its MidAmerican preferred stock into voting common shares on
February 9, 2006. This conversion ended a convoluted corporate arrangement that PUHCA had forced
upon us. Now we have 83.4% of both the common stock and the votes at MidAmerican, which allows us
to consolidate the company’s income for financial accounting and tax purposes. Our true economic
interest, however, is the aforementioned 80.5%, since there are options outstanding that are sure to be
exercised within a few years and that upon exercise will dilute our ownership.
Though our voting power has increased dramatically, the dynamics of our four-party ownership
have not changed at all. We view MidAmerican as a partnership among Berkshire, Walter Scott, and two
terrific managers, Dave Sokol and Greg Abel. It’s unimportant how many votes each party has; we will
make major moves only when we are unanimous in thinking them wise. Five years of working with Dave,
Greg and Walter have underscored my original belief: Berkshire couldn’t have better partners.
You will notice that this year we have provided you with two balance sheets, one representing our
actual figures per GAAP on December 31, 2005 (which does not consolidate MidAmerican) and one that
reflects the subsequent conversion of our preferred. All future financial reports of Berkshire will include
MidAmerican’s figures.
Somewhat incongruously, MidAmerican owns the second largest real estate brokerage firm in the
U.S. And it’s a gem. The parent company’s name is HomeServices of America, but our 19,200 agents
operate through 18 locally-branded firms. Aided by three small acquisitions, we participated in $64 billion
of transactions last year, up 6.5% from 2004.
Currently, the white-hot market in residential real estate of recent years is cooling down, and that
should lead to additional acquisition possibilities for us. Both we and Ron Peltier, the company’s CEO,
expect HomeServices to be far larger a decade from now.
Here are some key figures on MidAmerican’s operations:
Earnings (in $ millions)
U.K. utilities .......................................................................................................
Iowa utility .........................................................................................................
Pipelines .............................................................................................................
HomeServices.....................................................................................................
Other (net) ..........................................................................................................
Income (loss) from discontinued zinc project ....................................................
Earnings before corporate interest and taxes......................................................
Interest, other than to Berkshire .........................................................................
Interest on Berkshire junior debt ........................................................................
Income tax ..........................................................................................................
Net earnings........................................................................................................
Earnings applicable to Berkshire*......................................................................
Debt owed to others............................................................................................
Debt owed to Berkshire......................................................................................
*Includes interest earned by Berkshire (net of related income taxes) of $102 in 2005 and $110 in 2004.
2005
$ 308
288
309
148
107
8
1,168
(200)
(157)
(248)
$ 563
$ 523
10,296
1,289
2004
$ 326
268
288
130
172
(579)
605
(212)
(170)
(53)
$ 170
$ 237
10,528
1,478
9
�


 2025年软考高级信息系统项目管理师金色考点
 软考高项三色笔记
 镇安县双鑫矿业月河年处理15万吨尾渣综合加工利用项目水土保持报告表
  红杉资本:生成式AI最新市场格局.pdf
 wireshark 使用教程.pdf
 【2021年-贝佐斯致股东的信】.pdf
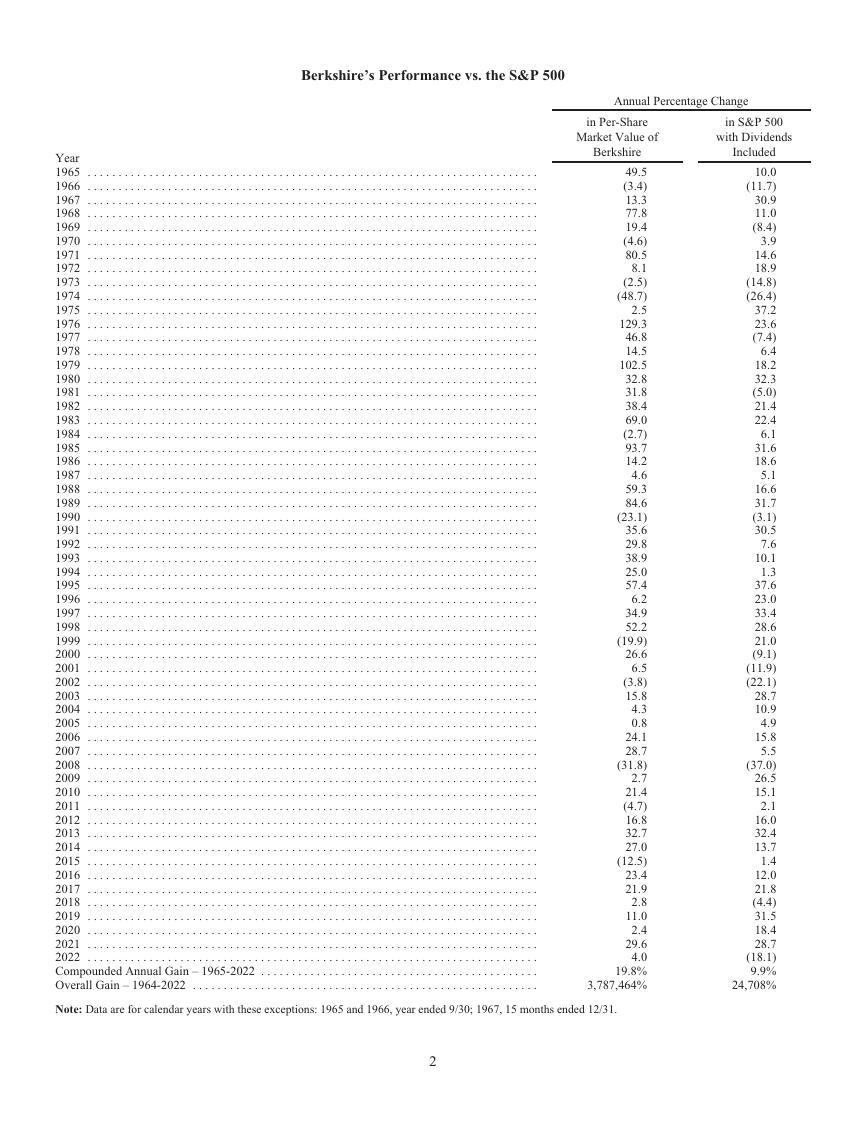 巴菲特致股东的公开信 - 2022.pdf
 MySQL 8.1 参考手册.pdf
 世界银行报告下载:激进政策缩紧浪潮不足遏制通胀 全球经济衰退迫在眉睫(Is a Global Recession Imminent?).pdf
 红杉资本报告:适应与忍耐(Adapting to Endure).pdf
 高保真音响系统设计制作-毕业论文.doc
 一种自适应互补滤波姿态估计算法.pdf