Note: The following table appears in the printed Annual Report on the facing page of the Chairman's Letter
and is referred to in that letter.
Berkshire’s Corporate Performance vs. the S&P 500
in Per-Share
Book Value of
Berkshire
in S&P 500
with Dividends
Included
Annual Percentage Change
Year
1965
1966
1967
1968
1969
1970
1971
1972
1973
1974
1975
1976
1977
1978
1979
1980
1981
1982
1983
1984
1985
1986
1987
1988
1989
1990
1991
1992
1993
1994
1995
1996
1997
1998
1999
2000
2001
2002
2003
2004
2005
2006
2007
....................................................
....................................................
....................................................
....................................................
....................................................
....................................................
....................................................
....................................................
....................................................
....................................................
....................................................
....................................................
....................................................
....................................................
....................................................
....................................................
....................................................
....................................................
....................................................
....................................................
....................................................
....................................................
....................................................
....................................................
....................................................
....................................................
....................................................
....................................................
....................................................
....................................................
....................................................
....................................................
....................................................
....................................................
....................................................
....................................................
....................................................
....................................................
....................................................
....................................................
....................................................
....................................................
....................................................
(1)
23.8
20.3
11.0
19.0
16.2
12.0
16.4
21.7
4.7
5.5
21.9
59.3
31.9
24.0
35.7
19.3
31.4
40.0
32.3
13.6
48.2
26.1
19.5
20.1
44.4
7.4
39.6
20.3
14.3
13.9
43.1
31.8
34.1
48.3
.5
6.5
(6.2)
10.0
21.0
10.5
6.4
18.4
11.0
Relative
Results
(1)-(2)
13.8
32.0
(19.9)
8.0
24.6
8.1
1.8
2.8
19.5
31.9
(15.3)
35.7
39.3
17.6
17.5
(13.0)
36.4
18.6
9.9
7.5
16.6
7.5
14.4
3.5
12.7
10.5
9.1
12.7
4.2
12.6
5.5
8.8
.7
19.7
(20.5)
15.6
5.7
32.1
(7.7)
(.4)
1.5
2.6
5.5
(2)
10.0
(11.7)
30.9
11.0
(8.4)
3.9
14.6
18.9
(14.8)
(26.4)
37.2
23.6
(7.4)
6.4
18.2
32.3
(5.0)
21.4
22.4
6.1
31.6
18.6
5.1
16.6
31.7
(3.1)
30.5
7.6
10.1
1.3
37.6
23.0
33.4
28.6
21.0
(9.1)
(11.9)
(22.1)
28.7
10.9
4.9
15.8
5.5
Compounded Annual Gain – 1965-2007
Overall Gain – 1964-2007
21.1%
400,863%
10.3%
6,840%
10.8
Notes: Data are for calendar years with these exceptions: 1965 and 1966, year ended 9/30; 1967, 15 months ended 12/31.
Starting in 1979, accounting rules required insurance companies to value the equity securities they hold at market
rather than at the lower of cost or market, which was previously the requirement. In this table, Berkshire’s results
through 1978 have been restated to conform to the changed rules. In all other respects, the results are calculated using
the numbers originally reported.
The S&P 500 numbers are pre-tax whereas the Berkshire numbers are after-tax. If a corporation such as Berkshire
were simply to have owned the S&P 500 and accrued the appropriate taxes, its results would have lagged the S&P 500
in years when that index showed a positive return, but would have exceeded the S&P 500 in years when the index
showed a negative return. Over the years, the tax costs would have caused the aggregate lag to be substantial.
2
�
To the Shareholders of Berkshire Hathaway Inc.:
BERKSHIRE HATHAWAY INC.
Our gain in net worth during 2007 was $12.3 billion, which increased the per-share book value of
both our Class A and Class B stock by 11%. Over the last 43 years (that is, since present management took
over) book value has grown from $19 to $78,008, a rate of 21.1% compounded annually.*
Overall, our 76 operating businesses did well last year. The few that had problems were primarily
those linked to housing, among them our brick, carpet and real estate brokerage operations. Their setbacks
are minor and temporary. Our competitive position in these businesses remains strong, and we have first-
class CEOs who run them right, in good times or bad.
Some major financial institutions have, however, experienced staggering problems because they
engaged in the “weakened lending practices” I described in last year’s letter. John Stumpf, CEO of Wells
Fargo, aptly dissected the recent behavior of many lenders: “It is interesting that the industry has invented
new ways to lose money when the old ways seemed to work just fine.”
You may recall a 2003 Silicon Valley bumper sticker that implored, “Please, God, Just One More
Bubble.” Unfortunately, this wish was promptly granted, as just about all Americans came to believe that
house prices would forever rise. That conviction made a borrower’s income and cash equity seem
unimportant to lenders, who shoveled out money, confident that HPA – house price appreciation – would
cure all problems. Today, our country is experiencing widespread pain because of that erroneous belief.
As house prices fall, a huge amount of financial folly is being exposed. You only learn who has been
swimming naked when the tide goes out – and what we are witnessing at some of our largest financial
institutions is an ugly sight.
Turning to happier thoughts, we can report that Berkshire’s newest acquisitions of size, TTI and
Iscar, led by their CEOs, Paul Andrews and Jacob Harpaz respectively, performed magnificently in 2007.
Iscar is as impressive a manufacturing operation as I’ve seen, a view I reported last year and that was
confirmed by a visit I made in the fall to its extraordinary plant in Korea.
Finally, our insurance business – the cornerstone of Berkshire – had an excellent year. Part of the
reason is that we have the best collection of insurance managers in the business – more about them later.
But we also were very lucky in 2007, the second year in a row free of major insured catastrophes.
That party is over. It’s a certainty that insurance-industry profit margins, including ours, will fall
significantly in 2008. Prices are down, and exposures inexorably rise. Even if the U.S. has its third
consecutive catastrophe-light year, industry profit margins will probably shrink by four percentage points
or so. If the winds roar or the earth trembles, results could be far worse. So be prepared for lower
insurance earnings during the next few years.
Yardsticks
Berkshire has two major areas of value. The first is our investments: stocks, bonds and cash
equivalents. At yearend these totaled $141 billion (not counting those in our finance or utility operations,
which we assign to our second bucket of value).
are 1/30th of those shown for the A.
*All per-share figures used in this report apply to Berkshire’s A shares. Figures for the B shares
3
�
Insurance float – money we temporarily hold in our insurance operations that does not belong to
us – funds $59 billion of our investments. This float is “free” as long as insurance underwriting breaks
even, meaning that the premiums we receive equal the losses and expenses we incur. Of course, insurance
underwriting is volatile, swinging erratically between profits and losses. Over our entire history, however,
we’ve been profitable, and I expect we will average breakeven results or better in the future. If we do that,
our investments can be viewed as an unencumbered source of value for Berkshire shareholders.
Berkshire’s second component of value is earnings that come from sources other than investments
and insurance. These earnings are delivered by our 66 non-insurance companies, itemized on page 76. In
our early years, we focused on the investment side. During the past two decades, however, we have put
ever more emphasis on the development of earnings from non-insurance businesses.
intervals. We exclude those applicable to minority interests.
The following tables illustrate this shift. In the first we tabulate per-share investments at 14-year
Compounded Annual
Gain in Per-Share Investments
Year
1965
1979
1993
2007
Per-Share
Investments
$ 4
577
13,961
90,343
Years
1965-1979
1979-1993
1993-2007
For the entire 42 years, our compounded annual gain in per-share investments was 27.1%. But the
trend has been downward as we increasingly used our available funds to buy operating businesses.
share basis and after applicable minority interests.
Here’s the record on how earnings of our non-insurance businesses have grown, again on a per-
Compounded Annual Gain in Per-
Share Pre-Tax Earnings
Year
1965
1979
1993
2007
Per Share
Pre-Tax Earnings
$ 4
18
212
4,093
Years
1965-1979
1979-1993
1993-2007
For the entire period, the compounded annual gain was 17.8%, with gains accelerating as our
focus shifted.
Though these tables may help you gain historical perspective and be useful in valuation, they are
completely misleading in predicting future possibilities. Berkshire’s past record can’t be duplicated or
even approached. Our base of assets and earnings is now far too large for us to make outsized gains in the
future.
Charlie Munger, my partner at Berkshire, and I will continue to measure our progress by the two
yardsticks I have just described and will regularly update you on the results. Though we can’t come close
to duplicating the past, we will do our best to make sure the future is not disappointing.
In our efforts, we will be aided enormously by the managers who have joined Berkshire. This is
an unusual group in several ways. First, most of them have no financial need to work. Many sold us their
businesses for large sums and run them because they love doing so, not because they need the money.
Naturally they wish to be paid fairly, but money alone is not the reason they work hard and productively.
* * * * * * * * * * * *
4
42.8%
25.6%
14.3%
11.1%
19.1%
23.5%
�
A second, somewhat related, point about these managers is that they have exactly the job they
want for the rest of their working years. At almost any other company, key managers below the top aspire
to keep climbing the pyramid. For them, the subsidiary or division they manage today is a way station – or
so they hope. Indeed, if they are in their present positions five years from now, they may well feel like
failures.
Conversely, our CEOs’ scorecards for success are not whether they obtain my job but instead are
the long-term performances of their businesses. Their decisions flow from a here-today, here-forever
mindset. I think our rare and hard-to-replicate managerial structure gives Berkshire a real advantage.
Acquisitions
Though our managers may be the best, we will need large and sensible acquisitions to get the
growth in operating earnings we wish. Here, we made little progress in 2007 until very late in the year.
Then, on Christmas day, Charlie and I finally earned our paychecks by contracting for the largest cash
purchase in Berkshire’s history.
The seeds of this transaction were planted in 1954. That fall, only three months into a new job, I
was sent by my employers, Ben Graham and Jerry Newman, to a shareholders’ meeting of Rockwood
Chocolate in Brooklyn. A young fellow had recently taken control of this company, a manufacturer of
assorted cocoa-based items. He had then initiated a one-of-a-kind tender, offering 80 pounds of cocoa
beans for each share of Rockwood stock. I described this transaction in a section of the 1988 annual report
that explained arbitrage. I also told you that Jay Pritzker – the young fellow mentioned above – was the
business genius behind this tax-efficient idea, the possibilities for which had escaped all the other experts
who had thought about buying Rockwood, including my bosses, Ben and Jerry.
At the meeting, Jay was friendly and gave me an education on the 1954 tax code. I came away
very impressed. Thereafter, I avidly followed Jay’s business dealings, which were many and brilliant. His
valued partner was his brother, Bob, who for nearly 50 years ran Marmon Group, the home for most of the
Pritzker businesses.
Jay died in 1999, and Bob retired early in 2002. Around then, the Pritzker family decided to
gradually sell or reorganize certain of its holdings, including Marmon, a company operating 125
businesses, managed through nine sectors. Marmon’s largest operation is Union Tank Car, which together
with a Canadian counterpart owns 94,000 rail cars that are leased to various shippers. The original cost of
this fleet is $5.1 billion. All told, Marmon has $7 billion in sales and about 20,000 employees.
We will soon purchase 60% of Marmon and will acquire virtually all of the balance within six
years. Our initial outlay will be $4.5 billion, and the price of our later purchases will be based on a formula
tied to earnings. Prior to our entry into the picture, the Pritzker family received substantial consideration
from Marmon’s distribution of cash, investments and certain businesses.
This deal was done in the way Jay would have liked. We arrived at a price using only Marmon’s
financial statements, employing no advisors and engaging in no nit-picking. I knew that the business
would be exactly as the Pritzkers represented, and they knew that we would close on the dot, however
chaotic financial markets might be. During the past year, many large deals have been renegotiated or killed
entirely. With the Pritzkers, as with Berkshire, a deal is a deal.
Marmon’s CEO, Frank Ptak, works closely with a long-time associate, John Nichols. John was
formerly the highly successful CEO of Illinois Tool Works (ITW), where he teamed with Frank to run a
mix of industrial businesses. Take a look at their ITW record; you’ll be impressed.
5
�
Byron Trott of Goldman Sachs – whose praises I sang in the 2003 report – facilitated the Marmon
transaction. Byron is the rare investment banker who puts himself in his client’s shoes. Charlie and I trust
him completely.
You’ll like the code name that Goldman Sachs assigned the deal. Marmon entered the auto
business in 1902 and exited it in 1933. Along the way it manufactured the Wasp, a car that won the first
Indianapolis 500 race, held in 1911. So this deal was labeled “Indy 500.”
* * * * * * * * * * * *
Let’s take a look at what kind of businesses turn us on. And while we’re at it, let’s also discuss
In May 2006, I spoke at a lunch at Ben Bridge, our Seattle-based jewelry chain. The audience was
a number of its vendors, among them Dennis Ulrich, owner of a company that manufactured gold jewelry.
In January 2007, Dennis called me, suggesting that with Berkshire’s support he could build a large
jewelry supplier. We soon made a deal for his business, simultaneously purchasing a supplier of about
equal size. The new company, Richline Group, has since made two smaller acquisitions. Even with those,
Richline is far below the earnings threshold we normally require for purchases. I’m willing to bet,
however, that Dennis – with the help of his partner, Dave Meleski – will build a large operation, earning
good returns on capital employed.
Businesses – The Great, the Good and the Gruesome
what we wish to avoid.
Charlie and I look for companies that have a) a business we understand; b) favorable long-term
economics; c) able and trustworthy management; and d) a sensible price tag. We like to buy the whole
business or, if management is our partner, at least 80%. When control-type purchases of quality aren’t
available, though, we are also happy to simply buy small portions of great businesses by way of stock-
market purchases. It’s better to have a part interest in the Hope Diamond than to own all of a rhinestone.
A truly great business must have an enduring “moat” that protects excellent returns on invested
capital. The dynamics of capitalism guarantee that competitors will repeatedly assault any business
“castle” that is earning high returns. Therefore a formidable barrier such as a company’s being the low-
cost producer (GEICO, Costco) or possessing a powerful world-wide brand (Coca-Cola, Gillette, American
Express) is essential for sustained success. Business history is filled with “Roman Candles,” companies
whose moats proved illusory and were soon crossed.
Our criterion of “enduring” causes us to rule out companies in industries prone to rapid and
continuous change. Though capitalism’s “creative destruction” is highly beneficial for society, it precludes
investment certainty. A moat that must be continuously rebuilt will eventually be no moat at all.
Additionally, this criterion eliminates the business whose success depends on having a great
manager. Of course, a terrific CEO is a huge asset for any enterprise, and at Berkshire we have an
abundance of these managers. Their abilities have created billions of dollars of value that would never
have materialized if typical CEOs had been running their businesses.
But if a business requires a superstar to produce great results, the business itself cannot be deemed
great. A medical partnership led by your area’s premier brain surgeon may enjoy outsized and growing
earnings, but that tells little about its future. The partnership’s moat will go when the surgeon goes. You
can count, though, on the moat of the Mayo Clinic to endure, even though you can’t name its CEO.
6
�
Long-term competitive advantage in a stable industry is what we seek in a business. If that comes
with rapid organic growth, great. But even without organic growth, such a business is rewarding. We will
simply take the lush earnings of the business and use them to buy similar businesses elsewhere. There’s no
rule that you have to invest money where you’ve earned it. Indeed, it’s often a mistake to do so: Truly
great businesses, earning huge returns on tangible assets, can’t for any extended period reinvest a large
portion of their earnings internally at high rates of return.
Let’s look at the prototype of a dream business, our own See’s Candy. The boxed-chocolates
industry in which it operates is unexciting: Per-capita consumption in the U.S. is extremely low and doesn’t
grow. Many once-important brands have disappeared, and only three companies have earned more than
token profits over the last forty years. Indeed, I believe that See’s, though it obtains the bulk of its revenues
from only a few states, accounts for nearly half of the entire industry’s earnings.
At See’s, annual sales were 16 million pounds of candy when Blue Chip Stamps purchased the
company in 1972. (Charlie and I controlled Blue Chip at the time and later merged it into Berkshire.) Last
year See’s sold 31 million pounds, a growth rate of only 2% annually. Yet its durable competitive
advantage, built by the See’s family over a 50-year period, and strengthened subsequently by Chuck
Huggins and Brad Kinstler, has produced extraordinary results for Berkshire.
We bought See’s for $25 million when its sales were $30 million and pre-tax earnings were less
than $5 million. The capital then required to conduct the business was $8 million. (Modest seasonal debt
was also needed for a few months each year.) Consequently, the company was earning 60% pre-tax on
invested capital. Two factors helped to minimize the funds required for operations. First, the product was
sold for cash, and that eliminated accounts receivable. Second, the production and distribution cycle was
short, which minimized inventories.
Last year See’s sales were $383 million, and pre-tax profits were $82 million. The capital now
required to run the business is $40 million. This means we have had to reinvest only $32 million since
1972 to handle the modest physical growth – and somewhat immodest financial growth – of the business.
In the meantime pre-tax earnings have totaled $1.35 billion. All of that, except for the $32 million, has
been sent to Berkshire (or, in the early years, to Blue Chip). After paying corporate taxes on the profits, we
have used the rest to buy other attractive businesses. Just as Adam and Eve kick-started an activity that led
to six billion humans, See’s has given birth to multiple new streams of cash for us. (The biblical command
to “be fruitful and multiply” is one we take seriously at Berkshire.)
There aren’t many See’s in Corporate America. Typically, companies that increase their earnings
from $5 million to $82 million require, say, $400 million or so of capital investment to finance their
growth. That’s because growing businesses have both working capital needs that increase in proportion to
sales growth and significant requirements for fixed asset investments.
A company that needs large increases in capital to engender its growth may well prove to be a
satisfactory investment. There is, to follow through on our example, nothing shabby about earning $82
million pre-tax on $400 million of net tangible assets. But that equation for the owner is vastly different
from the See’s situation. It’s far better to have an ever-increasing stream of earnings with virtually no
major capital requirements. Ask Microsoft or Google.
One example of good, but far from sensational, business economics is our own FlightSafety. This
company delivers benefits to its customers that are the equal of those delivered by any business that I know
of. It also possesses a durable competitive advantage: Going to any other flight-training provider than the
best is like taking the low bid on a surgical procedure.
7
�
Nevertheless, this business requires a significant reinvestment of earnings if it is to grow. When
we purchased FlightSafety in 1996, its pre-tax operating earnings were $111 million, and its net investment
in fixed assets was $570 million. Since our purchase, depreciation charges have totaled $923 million. But
capital expenditures have totaled $1.635 billion, most of that for simulators to match the new airplane
models that are constantly being introduced. (A simulator can cost us more than $12 million, and we have
273 of them.) Our fixed assets, after depreciation, now amount to $1.079 billion. Pre-tax operating
earnings in 2007 were $270 million, a gain of $159 million since 1996. That gain gave us a good, but far
from See’s-like, return on our incremental investment of $509 million.
Consequently, if measured only by economic returns, FlightSafety is an excellent but not
extraordinary business. Its put-up-more-to-earn-more experience is that faced by most corporations. For
example, our large investment in regulated utilities falls squarely in this category. We will earn
considerably more money in this business ten years from now, but we will invest many billions to make it.
Now let’s move to the gruesome. The worst sort of business is one that grows rapidly, requires
significant capital to engender the growth, and then earns little or no money. Think airlines. Here a
durable competitive advantage has proven elusive ever since the days of the Wright Brothers. Indeed, if a
farsighted capitalist had been present at Kitty Hawk, he would have done his successors a huge favor by
shooting Orville down.
The airline industry’s demand for capital ever since that first flight has been insatiable. Investors
have poured money into a bottomless pit, attracted by growth when they should have been repelled by it.
And I, to my shame, participated in this foolishness when I had Berkshire buy U.S. Air preferred stock in
1989. As the ink was drying on our check, the company went into a tailspin, and before long our preferred
dividend was no longer being paid. But we then got very lucky. In one of the recurrent, but always
misguided, bursts of optimism for airlines, we were actually able to sell our shares in 1998 for a hefty gain.
In the decade following our sale, the company went bankrupt. Twice.
To sum up, think of three types of “savings accounts.” The great one pays an extraordinarily high
interest rate that will rise as the years pass. The good one pays an attractive rate of interest that will be
earned also on deposits that are added. Finally, the gruesome account both pays an inadequate interest rate
and requires you to keep adding money at those disappointing returns.
And now it’s confession time. It should be noted that no consultant, board of directors or
investment banker pushed me into the mistakes I will describe. In tennis parlance, they were all unforced
errors.
* * * * * * * * * * * *
To begin with, I almost blew the See’s purchase. The seller was asking $30 million, and I was
adamant about not going above $25 million. Fortunately, he caved. Otherwise I would have balked, and
that $1.35 billion would have gone to somebody else.
About the time of the See’s purchase, Tom Murphy, then running Capital Cities Broadcasting,
called and offered me the Dallas-Fort Worth NBC station for $35 million. The station came with the Fort
Worth paper that Capital Cities was buying, and under the “cross-ownership” rules Murph had to divest it.
I knew that TV stations were See’s-like businesses that required virtually no capital investment and had
excellent prospects for growth. They were simple to run and showered cash on their owners.
Moreover, Murph, then as now, was a close friend, a man I admired as an extraordinary manager
and outstanding human being. He knew the television business forward and backward and would not have
called me unless he felt a purchase was certain to work. In effect Murph whispered “buy” into my ear. But
I didn’t listen.
8
�
In 2006, the station earned $73 million pre-tax, bringing its total earnings since I turned down the
deal to at least $1 billion – almost all available to its owner for other purposes. Moreover, the property now
has a capital value of about $800 million. Why did I say “no”? The only explanation is that my brain had
gone on vacation and forgot to notify me. (My behavior resembled that of a politician Molly Ivins once
described: “If his I.Q. was any lower, you would have to water him twice a day.”)
Finally, I made an even worse mistake when I said “yes” to Dexter, a shoe business I bought in
1993 for $433 million in Berkshire stock (25,203 shares of A). What I had assessed as durable competitive
advantage vanished within a few years. But that’s just the beginning: By using Berkshire stock, I
compounded this error hugely. That move made the cost to Berkshire shareholders not $400 million, but
rather $3.5 billion. In essence, I gave away 1.6% of a wonderful business – one now valued at $220 billion
– to buy a worthless business.
To date, Dexter is the worst deal that I’ve made. But I’ll make more mistakes in the future – you
can bet on that. A line from Bobby Bare’s country song explains what too often happens with acquisitions:
“I’ve never gone to bed with an ugly woman, but I’ve sure woke up with a few.”
* * * * * * * * * * * *
Now, let’s examine the four major operating sectors of Berkshire. Each sector has vastly different
balance sheet and income account characteristics. Therefore, lumping them together impedes analysis. So
we’ll present them as four separate businesses, which is how Charlie and I view them.
Insurance
The best anecdote I’ve heard during the current presidential campaign came from Mitt Romney,
who asked his wife, Ann, “When we were young, did you ever in your wildest dreams think I might be
president?” To which she replied, “Honey, you weren’t in my wildest dreams.”
When we first entered the property/casualty insurance business in 1967, my wildest dreams did
not envision our current operation. Here’s how we did in the first five years after purchasing National
Indemnity:
Underwriting Profit (Loss)
Float
(in millions)
years:
To put it charitably, we were a slow starter. But things changed. Here’s the record of the last five
Year
1967
1968
1969
1970
1971
Year
2003
2004
2005
2006
2007
$ 0.4
0.6
0.1
(0.4)
1.4
$1,718
1,551
53
3,838
3,374
$18.5
21.3
25.4
39.4
65.6
Float
$44,220
46,094
49,287
50,887
58,698
Underwriting Profit (Loss)
(in millions)
each has achieved.
This metamorphosis has been accomplished by some extraordinary managers. Let’s look at what
9
�


 2025年软考高级信息系统项目管理师金色考点
 软考高项三色笔记
 镇安县双鑫矿业月河年处理15万吨尾渣综合加工利用项目水土保持报告表
  红杉资本:生成式AI最新市场格局.pdf
 wireshark 使用教程.pdf
 【2021年-贝佐斯致股东的信】.pdf
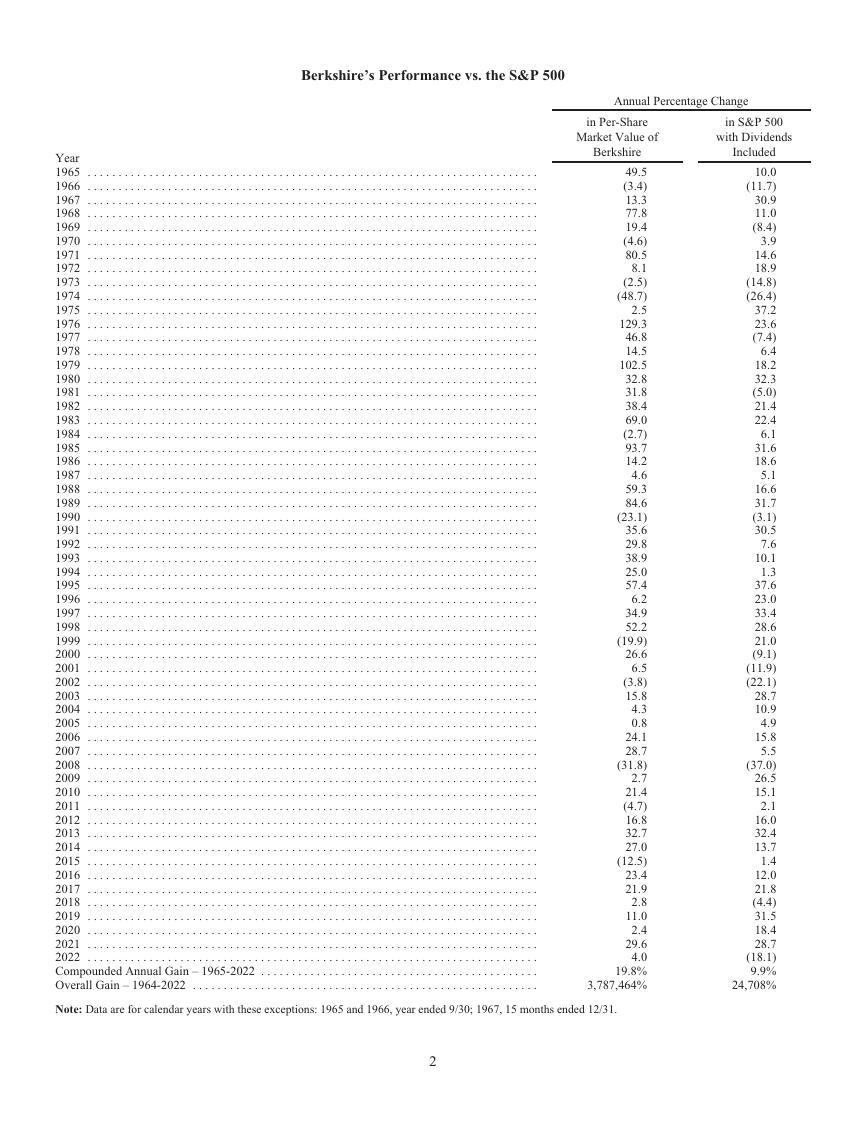 巴菲特致股东的公开信 - 2022.pdf
 MySQL 8.1 参考手册.pdf
 世界银行报告下载:激进政策缩紧浪潮不足遏制通胀 全球经济衰退迫在眉睫(Is a Global Recession Imminent?).pdf
 红杉资本报告:适应与忍耐(Adapting to Endure).pdf
 高保真音响系统设计制作-毕业论文.doc
 一种自适应互补滤波姿态估计算法.pdf