American Journal of Industrial and Business Management, 2019, 9, 2231-2249
https://www.scirp.org/journal/ajibm
ISSN Online: 2164-5175
ISSN Print: 2164-5167
The Impacts of Population Aging on Saving,
Capital Formation, and Economic Growth
Yuan-Ho Hsu1*, Huei-Chun Lo2
1Department of Economics, National Cheng Kung University, Taiwan
2National Open College of Continuing Education, Taichung University of Science and Technology, Taiwan
How to cite this paper: Hsu, Y.-H. and Lo,
H.-C. (2019) The Impacts of Population
Aging on Saving, Capital Formation, and
Economic Growth. American Journal of
Industrial and Business Management, 9,
2231-2249.
https://doi.org/10.4236/ajibm.2019.912148
Received: November 25, 2019
Accepted: December 21, 2019
Published: December 24, 2019
Copyright © 2019 by author(s) and
Scientific Research Publishing Inc.
This work is licensed under the Creative
Commons Attribution International
License (CC BY 4.0).
http://creativecommons.org/licenses/by/4.0/
Open Access
Abstract
The evolving population aging scenarios of the industrialized countries can
be attributed to two major demographic dynamics: the declining fertility and
fast aging population. The increasing old age dependency ratio, decreasing
young dependency ratio, and shrinking share of working-age population in
the aging economies generate substantial impacts on individual as well as ag-
gregate consumption, saving and employment. Because retired people save
less, an aging society with increasing proportion of retirees would experience
a decline in aggregate savings, which in turn leads to lower capital formation
and reduces economic growth. This paper focuses on the effect of population
aging on aggregate saving, physical capital formation, and economic growth
in Japan. The current study theorizes the effect of aging demographic dy-
namics on savings and capital formation. Taking into account the effects of
population dynamics, saving, and capital formation together, this paper steps
further in examining the implications of population aging for economic
growth and discusses policy implications for the aging economy.
Keywords
Population Aging, Saving, Capital Formation, Economic Growth
1. Introduction
The evolving population aging scenarios of the industrialized countries can be
attributed to two major demographic dynamics: the declining fertility and fast
aging population. The increasing old age dependency ratio, decreasing young
dependency ratio, and shrinking share of working-age population in the aging
economies generate substantial impacts on individual as well as aggregate con-
sumption, saving and employment. Since retired people save less, an aging so-
DOI: 10.4236/ajibm.2019.912148 Dec. 24, 2019
2231
American Journal of Industrial and Business Management
�
Y.-H. Hsu, H.-C. Lo
ciety with increasing proportion of retirees would experience a decline in aggre-
gate savings, which in turn leads to lower capital formation and reduced eco-
nomic growth. This paper focuses on the effect of population aging on aggregate
saving, physical capital formation, and economic growth in Japan.
The newborn population in Japan peaked at 2,091,983 in 1973 and then stea-
dily declined to 1,071,304 in 2010. In 2017, the number of newborn population
further declined to 946,065. On the other hand, the proportion of people aged 65
and over has reached 23% in 2010 and is expected to reach 32% by 2030. In or-
der to analyze the effect of this demographic development on aggregate eco-
nomic performance, this paper adopts Japanese population statistics published
by the Statistics Bureau, Ministry of Internal Affairs and Communications, to-
gether with the latest population projection made by National Institute of Popu-
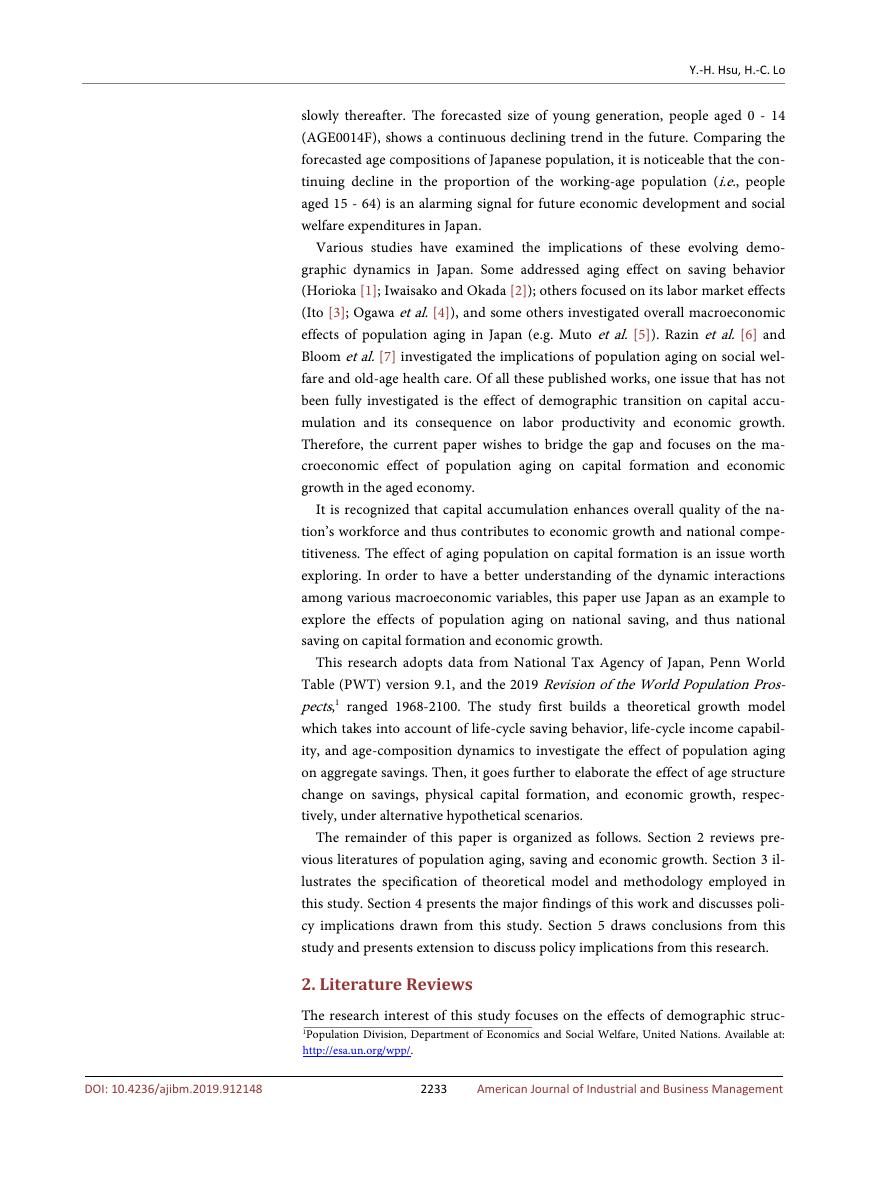
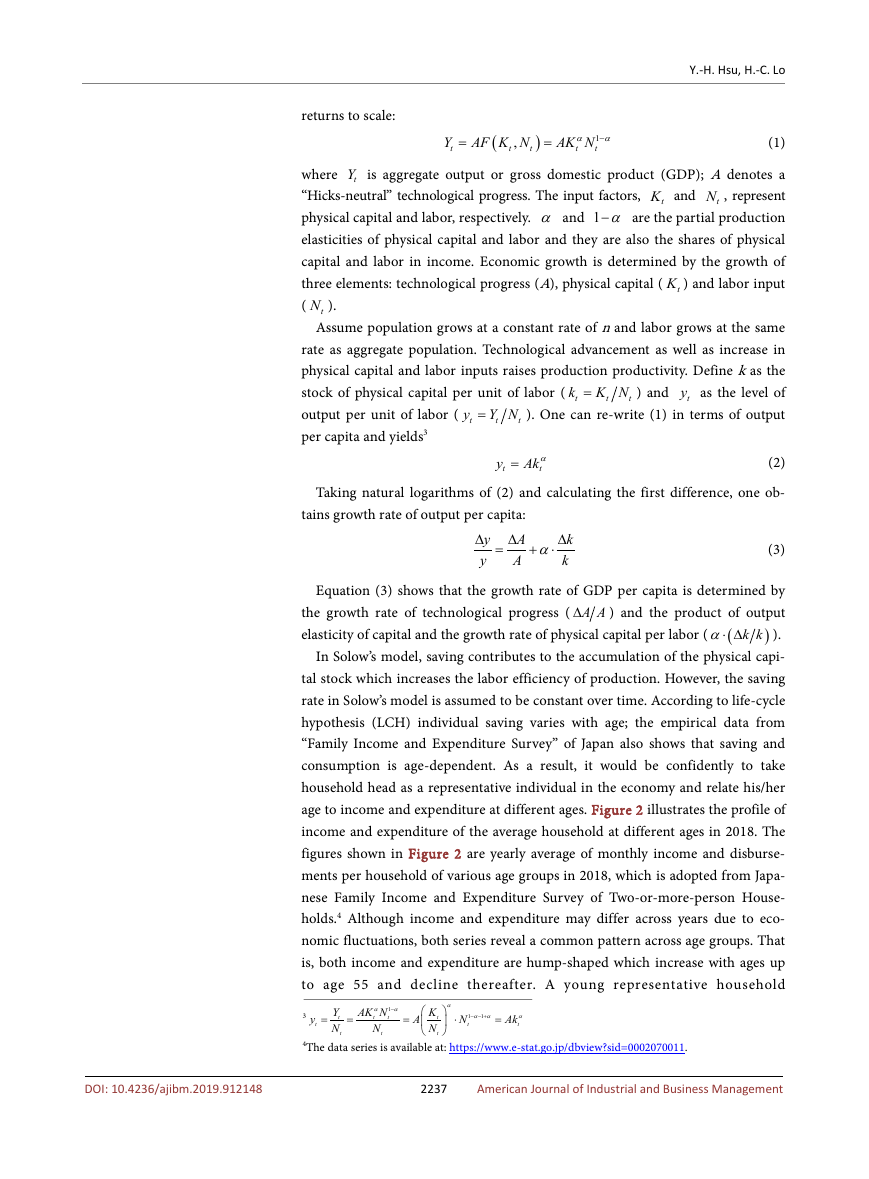
lation and Social Security Research (IPSS), Japan. Figure 1 illustrates the age
compositions of historical and forecasted Japanese population from 1946 to
2065. A vertical line drawn on year 2016 in Figure 1 divides the Japanese popu-
lation scenarios into historical and forecasted parts; to the left of this vertical line
is the historical data adopted from Statistical Bureau of Japan and to its right is
the forecasted series taken from National Institute of Population and Social Se-
curity Research, Japan. In this graph, a data labeled with suffix “H” signifies his-
torical data (e.g., POPH) and data labeled with suffix “F” represents forecasted
series.
The left panel of Figure 1 indicates that Japanese aggregate population had
reached its climax around 2010. However, the working age population, people
with age 16 to age 64, had already reached its peak circa 1995 (see AGE1564H in
the right panel). The right panel of Figure 1 also shows that the number of
young-age population (AGE0014) has been shrinking rapidly while the old-age
people (AGE65up) has increased rapidly between 1950 and 2010. The size of
old-age population will continue to increase up to the time circa 2050 and decline
130,000
120,000
110,000
100,000
90,000
80,000
1970
1980
1990
2000
2010
2020
2030
2040
2050
2060
Total Population
POPH
POPF
90,000
80,000
70,000
60,000
50,000
40,000
30,000
20,000
10,000
0
1950
1960
1970
1980
1990
2000
2010
2020
2030
2040
2050
2060
Figure 1. Total population and the size of three age-groups. Data Source: Population Estimates of Japan, 1920-2015, Statistics
Bureau Japan; Population Projections for Japan (2016-2065), National Institute of Population and Social Security Research, Japan.
DOI: 10.4236/ajibm.2019.912148
American Journal of Industrial and Business Management
2232
AGE0014H
AGE0014F
AGE1564H
AGE1564F
AGE65UPH
AGE65UPF
�
Y.-H. Hsu, H.-C. Lo
slowly thereafter. The forecasted size of young generation, people aged 0 - 14
(AGE0014F), shows a continuous declining trend in the future. Comparing the
forecasted age compositions of Japanese population, it is noticeable that the con-
tinuing decline in the proportion of the working-age population (i.e., people
aged 15 - 64) is an alarming signal for future economic development and social
welfare expenditures in Japan.
Various studies have examined the implications of these evolving demo-
graphic dynamics in Japan. Some addressed aging effect on saving behavior
(Horioka [1]; Iwaisako and Okada [2]); others focused on its labor market effects
(Ito [3]; Ogawa et al. [4]), and some others investigated overall macroeconomic
effects of population aging in Japan (e.g. Muto et al. [5]). Razin et al. [6] and
Bloom et al. [7] investigated the implications of population aging on social wel-
fare and old-age health care. Of all these published works, one issue that has not
been fully investigated is the effect of demographic transition on capital accu-
mulation and its consequence on labor productivity and economic growth.
Therefore, the current paper wishes to bridge the gap and focuses on the ma-
croeconomic effect of population aging on capital formation and economic
growth in the aged economy.
It is recognized that capital accumulation enhances overall quality of the na-
tion’s workforce and thus contributes to economic growth and national compe-
titiveness. The effect of aging population on capital formation is an issue worth
exploring. In order to have a better understanding of the dynamic interactions
among various macroeconomic variables, this paper use Japan as an example to
explore the effects of population aging on national saving, and thus national
saving on capital formation and economic growth.
This research adopts data from National Tax Agency of Japan, Penn World
Table (PWT) version 9.1, and the 2019 Revision of the World Population Pros-
pects,1 ranged 1968-2100. The study first builds a theoretical growth model
which takes into account of life-cycle saving behavior, life-cycle income capabil-
ity, and age-composition dynamics to investigate the effect of population aging
on aggregate savings. Then, it goes further to elaborate the effect of age structure
change on savings, physical capital formation, and economic growth, respec-
tively, under alternative hypothetical scenarios.
The remainder of this paper is organized as follows. Section 2 reviews pre-
vious literatures of population aging, saving and economic growth. Section 3 il-
lustrates the specification of theoretical model and methodology employed in
this study. Section 4 presents the major findings of this work and discusses poli-
cy implications drawn from this study. Section 5 draws conclusions from this
study and presents extension to discuss policy implications from this research.
2. Literature Reviews
The research interest of this study focuses on the effects of demographic struc-
1Population Division, Department of Economics and Social Welfare, United Nations. Available at:
http://esa.un.org/wpp/.
2233
American Journal of Industrial and Business Management
DOI: 10.4236/ajibm.2019.912148
�
Y.-H. Hsu, H.-C. Lo
DOI: 10.4236/ajibm.2019.912148
ture change on national saving and economic growth in Japan. The existing
knowledge doesn’t have consensus on the effects of population change on eco-
nomic performances; some argue that population has positive effect on econom-
ic growth whereas others maintain opposite argument. Furthermore, most ex-
isting literatures in economic development studies relate population growth to
economic growth, not on the correlation between population aging and eco-
nomic growth. This section first reviews existing literatures on the relationship
between aging and saving, and then on the relationship between saving and
economic growth.
The canonical work of Modigliani and Brumberg [8] developed a theory of
consumer expenditure based on life-cycle income and consumption of house-
holds, which is known as the life-cycle hypothesis (LCH). Based on the
well-known life-cycle consumption and savings, households accumulate their
wealth in the middle-age when they are at the peak of earnings capability and
make precautionary saving for the needs after retirement. On the retirement
ages they de-cumulate their asset holdings for consumption. According to the
LCH, the age-saving profile is hump-shaped which represents worker’s saving
capability across life span. That is, people save less at young and old age, com-
paring to their savings in the working ages. Population aging signifies a relative
increase in the size of low saving old-age group, which naturally leads to a
downward pressure on aggregate saving.
Ando and Modigliani [9] examined the Modigliani & Brumberg [8] life-cycle
hypothesis in the United States for the period of 1929-1959 and found evidences
to support that hypothesis. Higgins [10] found that youth dependency ratio and
old dependency ratio are significant determinants of saving rate in a sample of
100 countries. Higgins’ investigation coincided with much of the prior litera-
tures surveyed in Ando and Modigliani [9] and Horioka [1] in which demo-
graphic transition has substantial effects on national savings rates in Japan and
United States, so that it predicted that Japan’s saving rate would decline sharply
in the coming decades due to rapid population aging. However, Iwaisako and
Okada [2] argued the monotonic trend of population aging alone can’t explain
the nonlinear movement in Japanese household saving rate, though household
saving rate showed accelerated decline after the economic crisis in 1997-1998 as
predicted yet the same rate decelerated around 2004-2005 and thereafter. They
maintained that the scenario of sharp saving rate decline are due to decline in
household income growth, not population aging. Li et al. [11] investigated the
effects of China’s demographic changes on labor supply and the effects of hu-
man capital improvement on savings and investment. They found that the in-
creasing savings and investment rates of Chinese aging population fostered eco-
nomic growth in China. Wong and Tang [12] examined the effect of population
aging on private saving in a panel data of 22 OECD countries from 1961 to 2010
and concluded that longevity has a significant positive impact on savings, while
the effect of old-aged dependency rate is not obvious.
2234
American Journal of Industrial and Business Management
�
Y.-H. Hsu, H.-C. Lo
We have reviewed the literature on the effects of population aging on national
saving; we proceed to review literatures exploring the correlation between saving
and economic growth. The acknowledged theoretical investigation of the effect
of saving on economic growth dated back to Harrod [13], Domar [14] [15], and
Solow [16]. Given that aggregate output is the function of physical capital and
labor inputs, these models proposed that economic growth depends on saving
rate and that higher saving rate contributes to higher economic growth. In the
exploration of source of economic growth, the extended model incorporated one
demographic variable, population growth rate, and investigated the effect of
population growth on economic growth. However, in these growth models pop-
ulation growth rate is assumed to be positive and constant. Neither a negative
growth rate of the population, nor a shift in the age structure is considered in
these models. Over the later decades, studies of economic growth model have
extended previous works by taking into account additional factors, such as
technology, human capital, urbanization, institutions, openness to international
trade, and geographic factors, in the determination of economic growth.2
Most recent development in growth theory, the endogenous growth theory
whose pioneer studies are Romer [24], Lucas [25], and Rebelo [26], considers
saving rate as one of the key determinants of economic growth. It predicts that
an increase in the saving rate will lead to a permanently higher growth rate.
However, these empirical studies on the relationship between economic growth
and savings have not reached unanimous conclusion, due to their difference in
the methods, periods of study, and countries being selected for studied. Miller
[27] found the cointegrated relation between national saving and domestic in-
vestment rate in the US only existed prior to 1971. Kim and Lee [28] used panel
Vector-Auto Regressive (VAR) model and found negative effects of population
aging on national saving and current account balances in East Asia. Kumar Na-
rayan [29] used the bound testing approach of cointegration analysis to investi-
gate the correlation between saving and investment for Japan over the period
1960-1999; the empirical results indicated that saving and investment are coin-
tegrated with bidirectional causality. Andrei and Huidumac-Petrescu [30] ex-
amined the long-run relationship between saving and the real economic growth
for Euro area countries. Their empirical results showed the existence of a unidi-
rectional causality from real GDP growth rate to gross national saving rate.
Bayar [31] used panel cointegration tests and vector error correction model in
the study and found that domestic savings, domestic investment and foreign di-
rect investment had positive effect on economic growth in emerging Asian
economies for the period 1982-2012.
Many empirical studies address the effect of demographic transition on
household savings behavior and economic growth. Most findings support the
predictions of the LCH and OLG models, particularly with respect to the posi-
tive influence of the proportion of working-age population on national saving
2For example, see Becker et al. [17], Romer [18], Barro [19], Barro and Lee [20]; Mankiw et al. [21],
Jones [22], and Bloom et al. [23].
2235
American Journal of Industrial and Business Management
DOI: 10.4236/ajibm.2019.912148
�
Y.-H. Hsu, H.-C. Lo
rates, while the effect of old-age population on saving is less conclusive. For ex-
ample, Braun et al. [32] found the Japanese demographic factors account for the
decline in Japan’s national saving rate in the 1990s. Bloom et al. [33] demon-
strated the demographic dividends of the working-age population for economic
growth. Li et al. [11] examined the effects of demographic structure on economic
growth by using 29 provincial panel dataset in China and found that the old age
dependency ratio has a positive effect on savings, investment, and economic
growth rate. Bloom et al. [7] argued population aging will lower labor force par-
ticipation and savings rates, which leads to decline in economic growth.
3. Model Specification and Methodology
According to Harrod [13], Domar [14] and Solow [16], saving is a key driver to
economic growth. The current study investigates the effects of population aging
on economic growth based on the idea of the life-cycle hypothesis of Modigliani
and Brumberg [8] and the saving-growth connection of Harrod-Domar-Solow
schema. Since saving varies with individual’s age-specific position in his/her life
span and working-age population are the major savers of the economy, it is fore-
seeable that population aging alters relative share of working-age cohort and
hence the economy’s aggregate savings. As a result, the current study assumes
that changes in demographic structure exert potentially effects on national saving.
The current study theorizes the effect of demographic dynamics on savings
and capital formation in an aging economy. Taking into account the effects of
population dynamics, saving, and capital formation together, this effort allows
us to go one step further in examining the implications of population aging for
economic growth. With this endeavor, the current study modifies Solow’s growth
model and allows saving rate to vary with change in age structure of population,
which is in accordance to the life-cycle hypothesis of saving. This revision of
age-related saving behavior would allow us to analyze the effect of population
aging on aggregate savings and per capita income.
t
t
t
=
Y C I
t
Consider a simple closed economy with no government that all output ( tY ) is
either used for consumption (
tC ) or investment ( tI ). The national income iden-
tity is
+ . Investment ( tI ) is used to create new units of physical capital
(
tC from both sides
1tKδ − ). Subtracting
tK ) or to replace old, worn-out capital (
of the national income identity, one obtains national saving:
. In
S
equilibrium, the amount saved equals to the amount invested. Investment makes
new injection to existing capital stock whereas depreciation wipes out a certain
portion of existing capital. Assume that the capital stock wears out at a constant
depreciation rate δ. Savings finance investment projects so that the amount of
capital accumulation is determined by proportion of income saved; that is, the
saving rate s. At any given level of income, higher saving rate implies higher sav-
ing and investment.
≡
Y C
t
t
−
=
I
t
DOI: 10.4236/ajibm.2019.912148
Assume that aggregate output is a function of technology, physical capital, and
labor with a standard Cobb-Douglas aggregate production function of constant
2236
American Journal of Industrial and Business Management
�
returns to scale:
Y
t
=
AF K N
,
t
(
Y.-H. Hsu, H.-C. Lo
)
t
=
AK Nα
t
1
α−
t
(1)
tK and
tY is aggregate output or gross domestic product (GDP); A denotes a
where
“Hicks-neutral” technological progress. The input factors,
tN , represent
physical capital and labor, respectively. α and 1 α− are the partial production
elasticities of physical capital and labor and they are also the shares of physical
capital and labor in income. Economic growth is determined by the growth of
three elements: technological progress (A), physical capital (
tK ) and labor input
(
tN ).
Assume population grows at a constant rate of n and labor grows at the same
rate as aggregate population. Technological advancement as well as increase in
physical capital and labor inputs raises production productivity. Define k as the
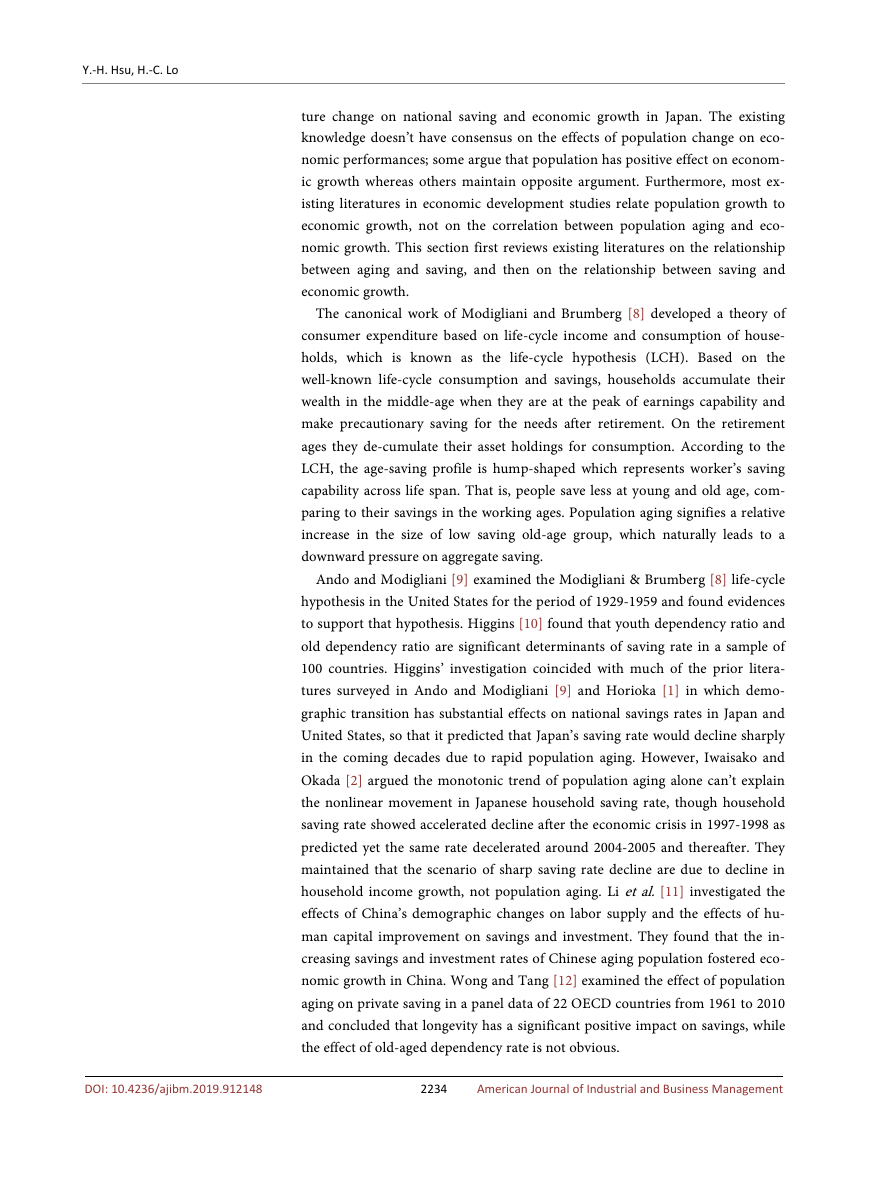
stock of physical capital per unit of labor ( t
ty as the level of
k
output per unit of labor (
). One can re-write (1) in terms of output
per capita and yields3
) and
K N
Y N
t
y
t
=
=
t
t
t
Taking natural logarithms of (2) and calculating the first difference, one ob-
y
t
=
Akα
t
(2)
tains growth rate of output per capita:
A
∆
A
y
∆
y
=
+ ⋅
α
k
∆
k
(3)
)
k k
(
α⋅ ∆
the growth rate of technological progress ( A A∆
elasticity of capital and the growth rate of physical capital per labor (
Equation (3) shows that the growth rate of GDP per capita is determined by
) and the product of output
).
In Solow’s model, saving contributes to the accumulation of the physical capi-
tal stock which increases the labor efficiency of production. However, the saving
rate in Solow’s model is assumed to be constant over time. According to life-cycle
hypothesis (LCH) individual saving varies with age; the empirical data from
“Family Income and Expenditure Survey” of Japan also shows that saving and
consumption is age-dependent. As a result, it would be confidently to take
household head as a representative individual in the economy and relate his/her
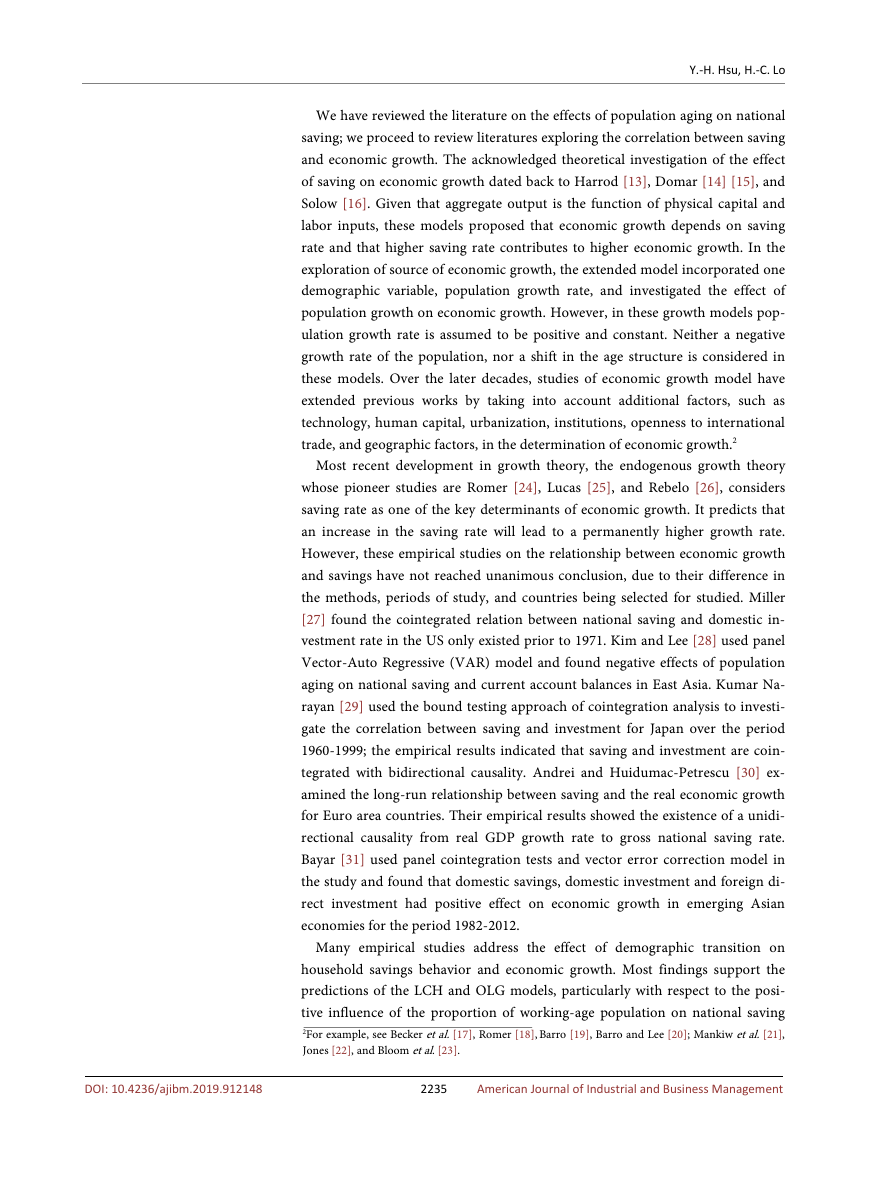
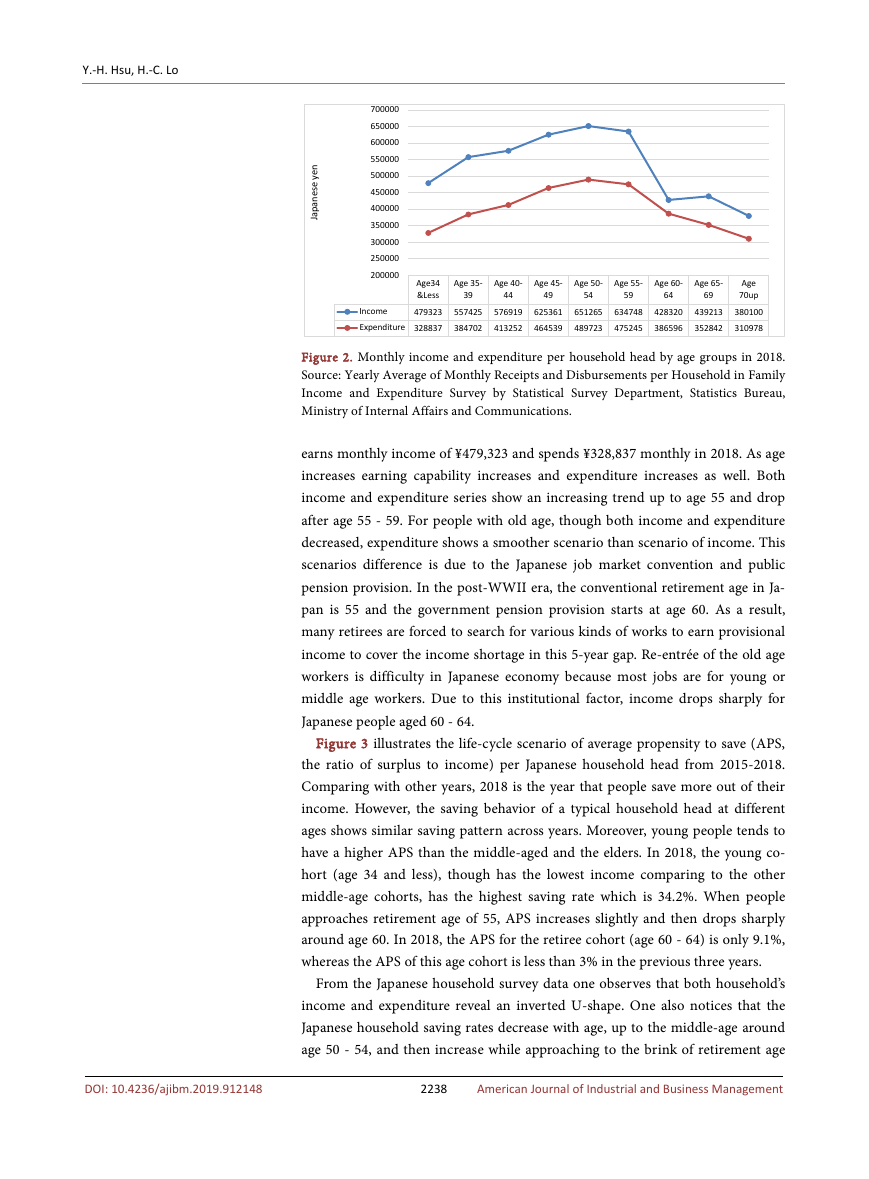
age to income and expenditure at different ages. Figure 2 illustrates the profile of
income and expenditure of the average household at different ages in 2018. The
figures shown in Figure 2 are yearly average of monthly income and disburse-
ments per household of various age groups in 2018, which is adopted from Japa-
nese Family Income and Expenditure Survey of Two-or-more-person House-
holds.4 Although income and expenditure may differ across years due to eco-
nomic fluctuations, both series reveal a common pattern across age groups. That
is, both income and expenditure are hump-shaped which increase with ages up
to age 55 and decline thereafter. A young representative household
3
y
t
=
t
Y
N
t
=
α
t
AK N
N
t
1
−
α
t
=
A
K
N
t
t
α
⋅
N
1
1
− − +
α α
t
=
Ak
α
t
DOI: 10.4236/ajibm.2019.912148
4The data series is available at: https://www.e-stat.go.jp/dbview?sid=0002070011.
2237
American Journal of Industrial and Business Management
�
Y.-H. Hsu, H.-C. Lo
n
e
y
e
s
e
n
a
p
a
J
700000
650000
600000
550000
500000
450000
400000
350000
300000
250000
200000
Age34
&Less
Income
479323
Expenditure 328837
Age 35-
39
Age 40-
44
Age 45-
49
Age 50-
54
Age 55-
59
Age 60-
64
Age 65-
69
557425
384702
576919
413252
625361
464539
651265
489723
634748
475245
428320
386596
439213
352842
Age
70up
380100
310978
Figure 2. Monthly income and expenditure per household head by age groups in 2018.
Source: Yearly Average of Monthly Receipts and Disbursements per Household in Family
Income and Expenditure Survey by Statistical Survey Department, Statistics Bureau,
Ministry of Internal Affairs and Communications.
earns monthly income of ¥479,323 and spends ¥328,837 monthly in 2018. As age
increases earning capability increases and expenditure increases as well. Both
income and expenditure series show an increasing trend up to age 55 and drop
after age 55 - 59. For people with old age, though both income and expenditure
decreased, expenditure shows a smoother scenario than scenario of income. This
scenarios difference is due to the Japanese job market convention and public
pension provision. In the post-WWII era, the conventional retirement age in Ja-
pan is 55 and the government pension provision starts at age 60. As a result,
many retirees are forced to search for various kinds of works to earn provisional
income to cover the income shortage in this 5-year gap. Re-entrée of the old age
workers is difficulty in Japanese economy because most jobs are for young or
middle age workers. Due to this institutional factor, income drops sharply for
Japanese people aged 60 - 64.
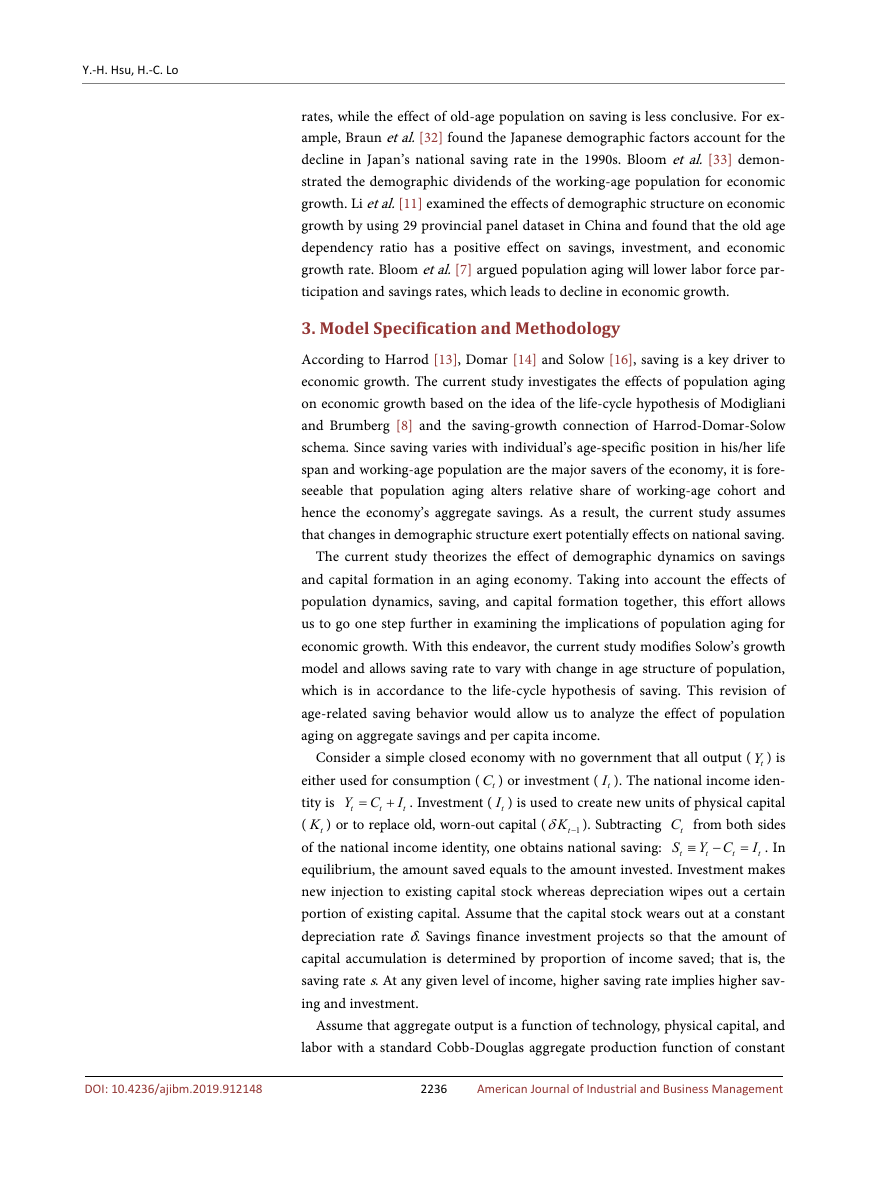
Figure 3 illustrates the life-cycle scenario of average propensity to save (APS,
the ratio of surplus to income) per Japanese household head from 2015-2018.
Comparing with other years, 2018 is the year that people save more out of their
income. However, the saving behavior of a typical household head at different
ages shows similar saving pattern across years. Moreover, young people tends to
have a higher APS than the middle-aged and the elders. In 2018, the young co-
hort (age 34 and less), though has the lowest income comparing to the other
middle-age cohorts, has the highest saving rate which is 34.2%. When people
approaches retirement age of 55, APS increases slightly and then drops sharply
around age 60. In 2018, the APS for the retiree cohort (age 60 - 64) is only 9.1%,
whereas the APS of this age cohort is less than 3% in the previous three years.
From the Japanese household survey data one observes that both household’s
income and expenditure reveal an inverted U-shape. One also notices that the
Japanese household saving rates decrease with age, up to the middle-age around
age 50 - 54, and then increase while approaching to the brink of retirement age
2238
American Journal of Industrial and Business Management
DOI: 10.4236/ajibm.2019.912148
�




 2023年江西萍乡中考道德与法治真题及答案.doc
 2012年重庆南川中考生物真题及答案.doc
 2013年江西师范大学地理学综合及文艺理论基础考研真题.doc
 2020年四川甘孜小升初语文真题及答案I卷.doc
 2020年注册岩土工程师专业基础考试真题及答案.doc
 2023-2024学年福建省厦门市九年级上学期数学月考试题及答案.doc
 2021-2022学年辽宁省沈阳市大东区九年级上学期语文期末试题及答案.doc
 2022-2023学年北京东城区初三第一学期物理期末试卷及答案.doc
 2018上半年江西教师资格初中地理学科知识与教学能力真题及答案.doc
 2012年河北国家公务员申论考试真题及答案-省级.doc
 2020-2021学年江苏省扬州市江都区邵樊片九年级上学期数学第一次质量检测试题及答案.doc
 2022下半年黑龙江教师资格证中学综合素质真题及答案.doc