Global Contrast based Salient Region Detection ∗
Ming-Ming Cheng1 Guo-Xin Zhang1 Niloy J. Mitra2 Xiaolei Huang3
1 TNList, Tsinghua University
Shi-Min Hu1
3 Lehigh University
2 KAUST
chengmingvictor@gmail.com
Abstract
Reliable estimation of visual saliency allows appropriate processing of images without
prior knowledge of their contents, and thus remains an important step in many computer vi-
sion tasks including image segmentation, object recognition, and adaptive compression. We
propose a regional contrast based saliency extraction algorithm, which simultaneously eval-
uates global contrast differences and spatial coherence. The proposed algorithm is simple,
efficient, and yields full resolution saliency maps. Our algorithm consistently outperformed
existing saliency detection methods, yielding higher precision and better recall rates, when
evaluated using one of the largest publicly available data sets. We also demonstrate how the
extracted saliency map can be used to create high quality segmentation masks for subsequent
image processing.
Keywords: Saliency detection, global contrast, early and biologically-inspired Vision.
The documents contained in these pages are included to ensure timely dissemina-
Disclaimer:
tion of scholarly and technical work on a non-commercial basis. Copyright and all rights therein
are maintained by the authors or by other copyright holders, notwithstanding that they have
offered their works here electronically. It is understood that all persons copying this information
will adhere to the terms and constraints invoked by each author’s copyright. These works may
not be reposted without the explicit permission of the copyright holder.
@conference{11cvpr/Cheng_Saliency,
title={Global Contrast based Salient Region Detection},
author={Ming-Ming Cheng and Guo-Xin Zhang and Niloy J. Mitra and Xiaolei Huang and Shi-Min Hu},
booktitle={IEEE CVPR},
pages={409--416},
year={2011},
}
∗Project page: http://cg.cs.tsinghua.edu.cn/people/∼cmm/saliency/
1
�
Global Contrast based Salient Region Detection
Ming-Ming Cheng1 Guo-Xin Zhang1 Niloy J. Mitra2 Xiaolei Huang3
Shi-Min Hu1
3 Lehigh University
1 TNList, Tsinghua University
2 KAUST
chengmingvictor@gmail.com
Abstract
Reliable estimation of visual saliency allows appropriate
processing of images without prior knowledge of their con-
tents, and thus remains an important step in many computer
vision tasks including image segmentation, object recog-
nition, and adaptive compression. We propose a regional
contrast based saliency extraction algorithm, which simul-
taneously evaluates global contrast differences and spatial
coherence. The proposed algorithm is simple, efficient, and
yields full resolution saliency maps. Our algorithm con-
sistently outperformed existing saliency detection methods,
yielding higher precision and better recall rates, when eval-
uated using one of the largest publicly available data sets.
We also demonstrate how the extracted saliency map can
be used to create high quality segmentation masks for sub-
sequent image processing.
1. Introduction
Humans routinely and effortlessly judge the importance
of image regions, and focus attention on important parts.
Computationally detecting such salient image regions re-
mains a significant goal, as it allows preferential allocation
of computational resources in subsequent image analysis
and synthesis. Extracted saliency maps are widely used
in many computer vision applications including object-
of-interest image segmentation [13, 18], object recogni-
tion [25], adaptive compression of images [6], content-
aware image editing [28, 33, 30, 9], and image retrieval [4].
Saliency originates from visual uniqueness, unpre-
dictability, rarity, or surprise, and is often attributed to vari-
ations in image attributes like color, gradient, edges, and
boundaries. Visual saliency, being closely related to how we
perceive and process visual stimuli, is investigated by mul-
tiple disciplines including cognitive psychology [26, 29],
neurobiology [8, 22], and computer vision [17, 2]. Theo-
ries of human attention hypothesize that the human vision
system only processes parts of an image in detail, while
leaving others nearly unprocessed. Early work by Treis-
man and Gelade [27], Koch and Ullman [19], and subse-
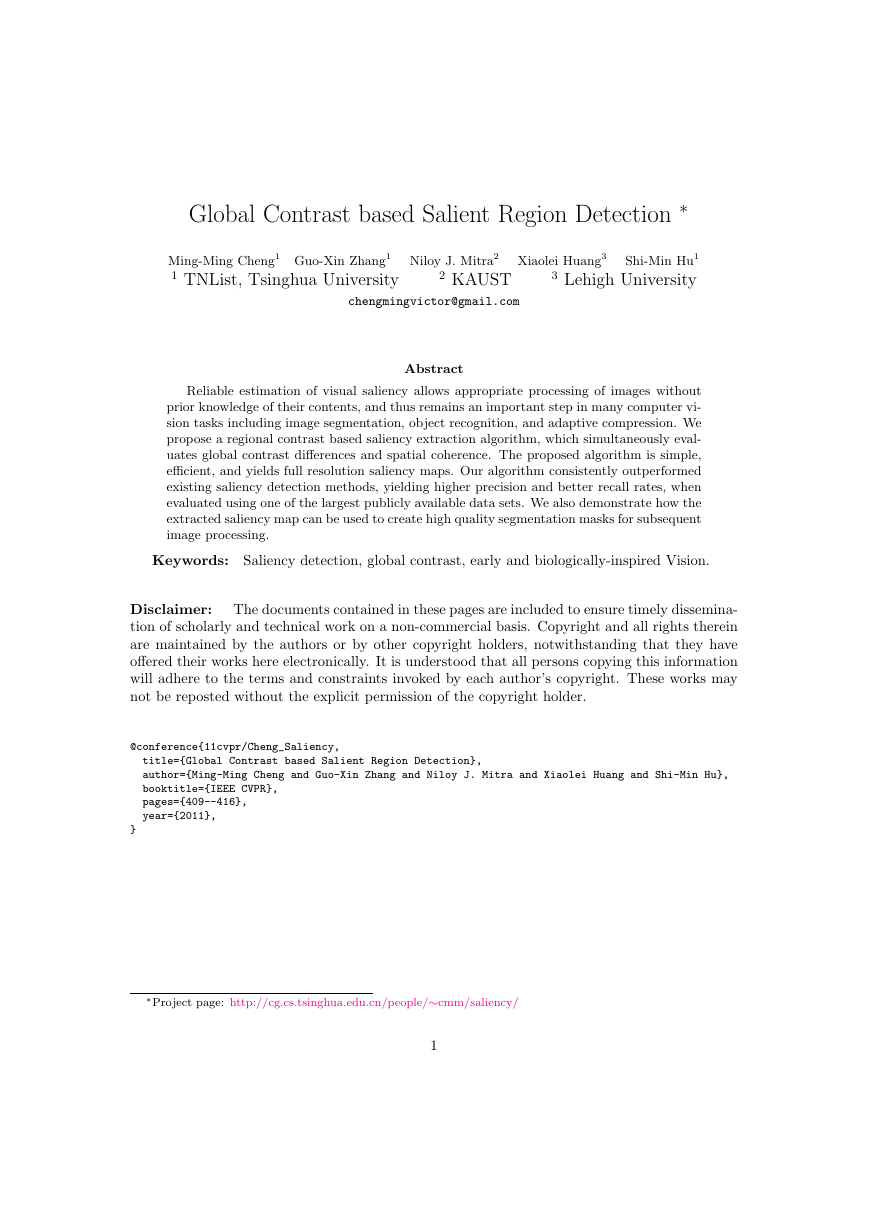
Figure 1. Given input images (top), a global contrast analysis is
used to compute high resolution saliency maps (middle), which
can be used to produce masks (bottom) around regions of interest.
quent attention theories proposed by Itti, Wolfe and others,
suggest two stages of visual attention: fast, pre-attentive,
bottom-up, data driven saliency extraction; and slower, task
dependent, top-down, goal driven saliency extraction.
We focus on bottom-up data driven saliency detection
using image contrast. It is widely believed that human cor-
tical cells may be hard wired to preferentially respond to
high contrast stimulus in their receptive fields [23]. We pro-
pose contrast analysis for extracting high-resolution, full-
field saliency maps based on the following observations:
A global contrast based method, which separates a
large-scale object from its surroundings, is preferred
over local contrast based methods producing high
saliency values at or near object edges.
Global considerations enable assignment of compara-
ble saliency values to similar image regions, and can
uniformly highlight entire objects.
Saliency of a region depends mainly on its contrast to
the nearby regions, while contrasts to distant regions
are less significant.
Saliency maps should be fast and easy to generate to
allow processing of large image collections, and facil-
itate efficient image classification and retrieval.
We propose a histogram-based contrast method (HC) to
measure saliency. HC-maps assign pixel-wise saliency val-
409
�
(b) IT[17] (c) MZ[21] (d) GB[14]
(a) original
Figure 2. Saliency maps computed by different state-of-the-art methods (b-i), and with our proposed HC (j) and RC methods (k). Most
results highlight edges, or are of low resolution. See also Figure 6 (and our project webpage).
(e) SR[15]
(f) AC[1]
(k) RC
(g) CA[12]
(h) FT[2]
(i) LC[32]
(j) HC
ues based simply on color separation from all other image
pixels to produce full resolution saliency maps. We use
a histogram-based approach for efficient processing, while
employing a smoothing procedure to control quantization
artifacts. Note that our algorithm is targeted towards natu-
ral scenes, and maybe suboptimal for extracting saliency of
highly textured scenes (see Figure 12).
As an improvement over HC-maps, we incorporate spa-
tial relations to produce region-based contrast (RC) maps
where we first segment the input image into regions, and
then assign saliency values to them. The saliency value of a
region is now calculated using a global contrast score, mea-
sured by the region’s contrast and spatial distances to other
regions in the image.
We have extensively evaluated our methods on publicly
available benchmark data sets, and compared our methods
with (eight) state-of-the-art saliency methods [17, 21, 32,
14, 15, 1, 2, 12] as well as with manually produced ground
truth annotations1. The experiments show significant im-
provements over previous methods both in precision and re-
call rates. Overall, compared with HC-maps, RC-maps pro-
duce better precision and recall rates, but at the cost of in-
creased computations. Encouragingly, we observe that the
saliency cuts extracted using our saliency maps are, in most
cases, comparable to manual annotations. We also present
application of the extracted saliency maps to segmentation,
context aware resizing, and non-photo realistic rendering.
2. Related Work
We focus on relevant literature targeting pre-attentive
bottom-up saliency detection, which may be biologically
motivated, or purely computational, or involve both as-
pects. Such methods utilize low-level processing to deter-
mine the contrast of image regions to their surroundings, us-
ing feature attributes such as intensity, color, and edges [2].
We broadly classify the algorithms into local and global
schemes.
Local contrast based methods investigate the rarity of
image regions with respect
to (small) local neighbor-
hoods. Based on the highly influential biologically inspired
early representation model introduced by Koch and Ull-
man [19], Itti et al. [17] define image saliency using central-
surrounded differences across multi-scale image features.
1Results for 1000 images and prototype software are available at the
project webpage: http://cg.cs.tsinghua.edu.cn/people/%7Ecmm/saliency/
Ma and Zhang [21] propose an alternative local contrast
analysis for generating saliency maps, which is then ex-
tended using a fuzzy growth model. Harel et al. [14] nor-
malize the feature maps of Itti et al., to highlight conspic-
uous parts and permit combination with other importance
maps. Liu et al. [20] find multi-scale contrast by linearly
combining contrast in a Gaussian image pyramid. More
recently, Goferman et al. [12] simultaneously model local
low-level clues, global considerations, visual organization
rules, and high-level features to highlight salient objects
along with their contexts. Such methods using local contrast
tend to produce higher saliency values near edges instead of
uniformly highlighting salient objects (see Figure 2).
Global contrast based methods evaluate saliency of an
image region using its contrast with respect to the entire
image. Zhai and Shah [32] define pixel-level saliency based
on a pixel’s contrast to all other pixels. However, for effi-
ciency they use only luminance information, thus ignoring
distinctiveness clues in other channels. Achanta et al. [2]
propose a frequency tuned method that directly defines pixel
saliency using a pixel’s color difference from the average
image color. The elegant approach, however, only consid-
ers first order average color, which can be insufficient to
analyze complex variations common in natural images. In
Figures 6 and 7, we show qualitative and quantitative weak-
nesses of such approaches. Furthermore, these methods ig-
nore spatial relationships across image parts, which can be
critical for reliable and coherent saliency detection (see Sec-
tion 5).
3. Histogram Based Contrast
Based on the observation from biological vision that the
vision system is sensitive to contrast in visual signal, we
propose a histogram-based contrast (HC) method to define
saliency values for image pixels using color statistics of the
input image. Specifically, the saliency of a pixel is defined
using its color contrast to all other pixels in the image, i.e.,
the saliency value of a pixel Ik in image I is defined as,
S(Ik) =
∀Ii∈I
D(Ik, Ii),
(1)
where D(Ik, Ii) is the color distance metric between pixels
Ik and Ii in the L∗a∗b∗space (see also [32]). Equation 1
can be expanded by pixel order to have the following form,
S(Ik) = D(Ik, I1) + D(Ik, I2) + + D(Ik, IN ),
(2)
410
�
n
y
c
n
e
u
q
e
r
f
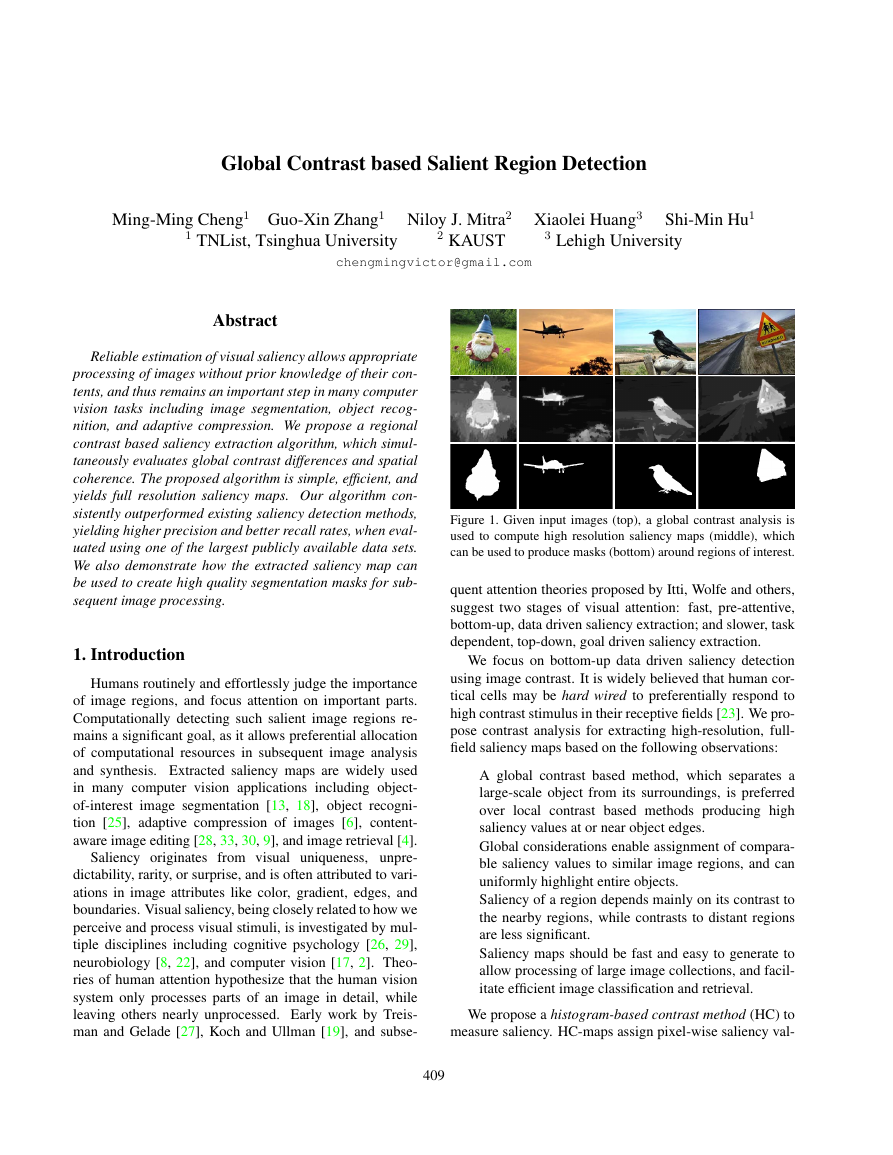
Figure 3. Given an input image (left), we compute its color his-
togram (middle). Corresponding histogram bin colors are shown
in the lower bar. The quantized image (right) uses only 43 his-
togram bin colors and still retains sufficient visual quality for
saliency detection.
where N is the number of pixels in image I. It is easy to see
that pixels with the same color value have the same saliency
value under this definition, since the measure is oblivious to
spatial relations. Hence, rearranging Equation 2 such that
the terms with the same color value cj are grouped together,
we get saliency value for each color as,
S(Ik) = S(cl) =
fjD(cl, cj),
(3)
j=1
where cl is the color value of pixel Ik, n is the number of
distinct pixel colors, and fj is the probability of pixel color
cj in image I. Note that in order to prevent salient region
color statistics from being corrupted by similar colors from
other regions, one can develop a similar scheme using vary-
ing window masks. However, given the strict efficiency re-
quirement, we take the simple global approach.
Histogram based speed up. Naively evaluating the
saliency value for each image pixel using Equation 1 takes
O(N 2) time, which is computationally too expensive even
for medium sized images. The equivalent representation in
Equation 3, however, takes O(N) + O(n2) time, implying
that computational efficiency can be improved to O(N) if
O(n2) O(N). Thus, the key to speed up is to reduce
the number of pixel colors in the image. However, the true-
color space contains 2563 possible colors, which is typically
larger than the number of image pixels.
Zhai and Shah [32] reduce the number of colors, n, by
only using luminance. In this way, n2 = 2562 (typically
2562 N). However, their method has the disadvantage
that the distinctiveness of color information is ignored. In
this work, we use the full color space instead of luminance
only. To reduce the number of colors needed to consider, we
first quantize each color channel to have 12 different values,
which reduces the number of colors to 123 = 1728. Con-
sidering that color in a natural image typically covers only
a small portion of the full color space, we further reduce
the number of colors by ignoring less frequently occurring
colors. By choosing more frequently occurring colors and
ensuring these colors cover the colors of more than 95% of
the image pixels, we typically are left with around n = 85
colors (see Section 5 for experimental details). The colors
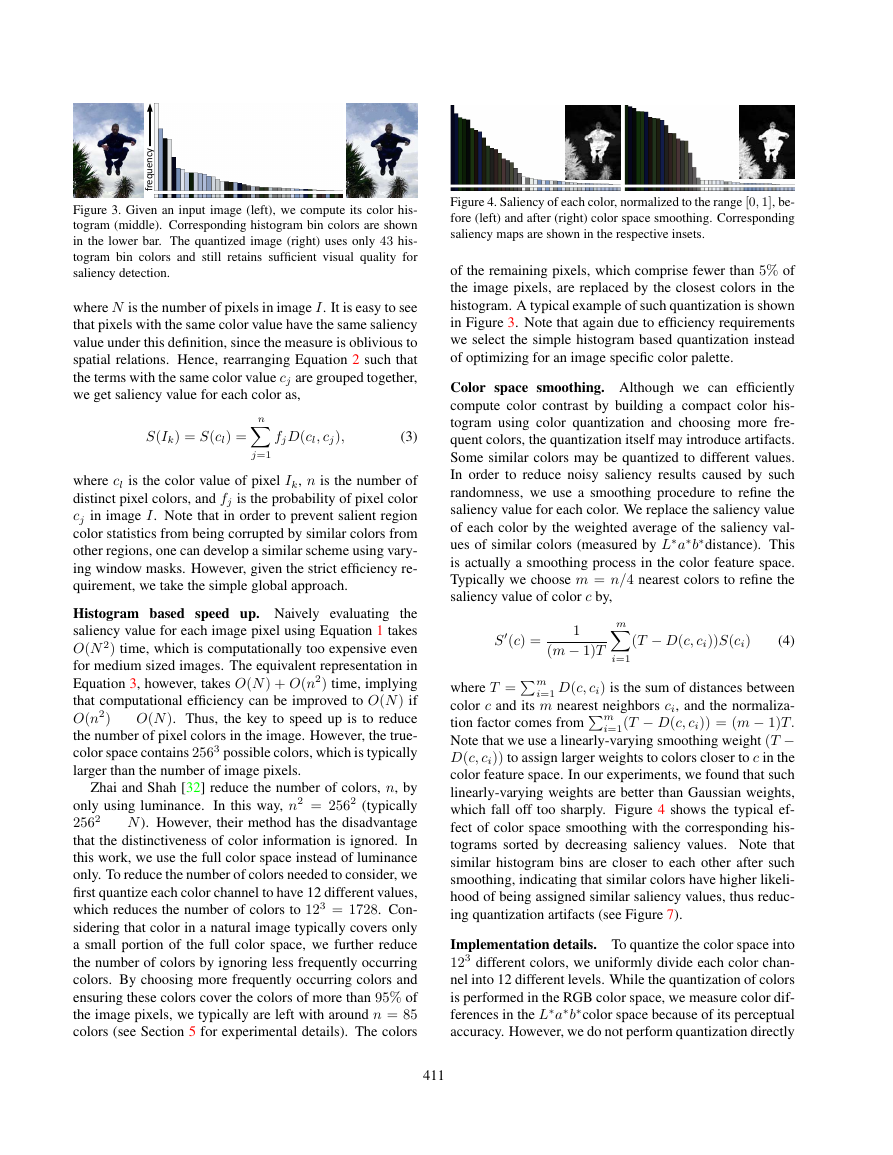
Figure 4. Saliency of each color, normalized to the range [0, 1], be-
fore (left) and after (right) color space smoothing. Corresponding
saliency maps are shown in the respective insets.
of the remaining pixels, which comprise fewer than 5% of
the image pixels, are replaced by the closest colors in the
histogram. A typical example of such quantization is shown
in Figure 3. Note that again due to efficiency requirements
we select the simple histogram based quantization instead
of optimizing for an image specific color palette.
Color space smoothing. Although we can efficiently
compute color contrast by building a compact color his-
togram using color quantization and choosing more fre-
quent colors, the quantization itself may introduce artifacts.
Some similar colors may be quantized to different values.
In order to reduce noisy saliency results caused by such
randomness, we use a smoothing procedure to refine the
saliency value for each color. We replace the saliency value
of each color by the weighted average of the saliency val-
ues of similar colors (measured by L∗a∗b∗distance). This
is actually a smoothing process in the color feature space.
Typically we choose m = n/4 nearest colors to refine the
saliency value of color c by,
S(c) =
1
(4)
(T − D(c, ci))S(ci)
(m − 1)T
where T =m
tion factor comes fromm
i=1 D(c, ci) is the sum of distances between
color c and its m nearest neighbors ci, and the normaliza-
i=1(T − D(c, ci)) = (m − 1)T.
Note that we use a linearly-varying smoothing weight (T −
D(c, ci)) to assign larger weights to colors closer to c in the
color feature space. In our experiments, we found that such
linearly-varying weights are better than Gaussian weights,
which fall off too sharply. Figure 4 shows the typical ef-
fect of color space smoothing with the corresponding his-
tograms sorted by decreasing saliency values. Note that
similar histogram bins are closer to each other after such
smoothing, indicating that similar colors have higher likeli-
hood of being assigned similar saliency values, thus reduc-
ing quantization artifacts (see Figure 7).
m
i=1
Implementation details. To quantize the color space into
123 different colors, we uniformly divide each color chan-
nel into 12 different levels. While the quantization of colors
is performed in the RGB color space, we measure color dif-
ferences in the L∗a∗b∗color space because of its perceptual
accuracy. However, we do not perform quantization directly
411
�
use the number of pixels in ri as w(ri) to emphasize color
contrast to bigger regions. The color distance between two
regions r1 and r2 is defined as,
n1
n2
Dr(r1, r2) =
f(c1,i)f(c2,j)D(c1,i, c2,j)
(6)
i=1
j=1
where f(ck,i) is the probability of the i-th color ck,i among
all nk colors in the k-th region rk, k = f1, 2g. Note that
we use the probability of a color in the probability density
function (i.e. normalized color histogram) of the region as
the weight for this color to emphasize more the color differ-
ences between dominant colors.
Storing and calculating the regular matrix format his-
togram for each region is inefficient since each region typ-
ically contains a small number of colors in the color his-
togram of the whole image. Instead, we use a sparse his-
togram representation for efficient storage and computation.
Spatially weighted region contrast. We further incorpo-
rate spatial information by introducing a spatial weighting
term in Equation 5 to increase the effects of closer regions
and decrease the effects of farther regions. Specifically, for
any region rk, the spatially weighted region contrast based
saliency is defined as:
exp(Ds(rk, ri)/σ2
s)w(ri)Dr(rk, ri) (7)
S(rk) =
rk=ri
where Ds(rk, ri) is the spatial distance between regions rk
and ri, and σs controls the strength of spatial weighting.
Larger values of σs reduce the effect of spatial weighting so
that contrast to farther regions would contribute more to the
saliency of the current region. The spatial distance between
two regions is defined as the Euclidean distance between
s = 0.4
their centroids. In our implementation, we use σ2
with pixel coordinates normalized to [0, 1].
5. Experimental Comparisons
We have evaluated the results of our approach on the
publicly available database provided by Achanta et al. [2].
To the best of our knowledge, the database is the largest
of its kind, and has ground truth in the form of accu-
rate human-marked labels for salient regions. We com-
pared the proposed global contrast based methods with 8
state-of-the-art saliency detection methods. Following [2],
we selected these methods according to: number of cita-
tions (IT[17] and SR[15]), recency (GB[14], SR, AC[1],
FT[2] and CA[12]), variety (IT is biologically-motivated,
MZ[21] is purely computational, GB is hybrid, SR works
in the frequency domain, AC and FT output full resolution
saliency maps), and being related to our approach (LC[32]).
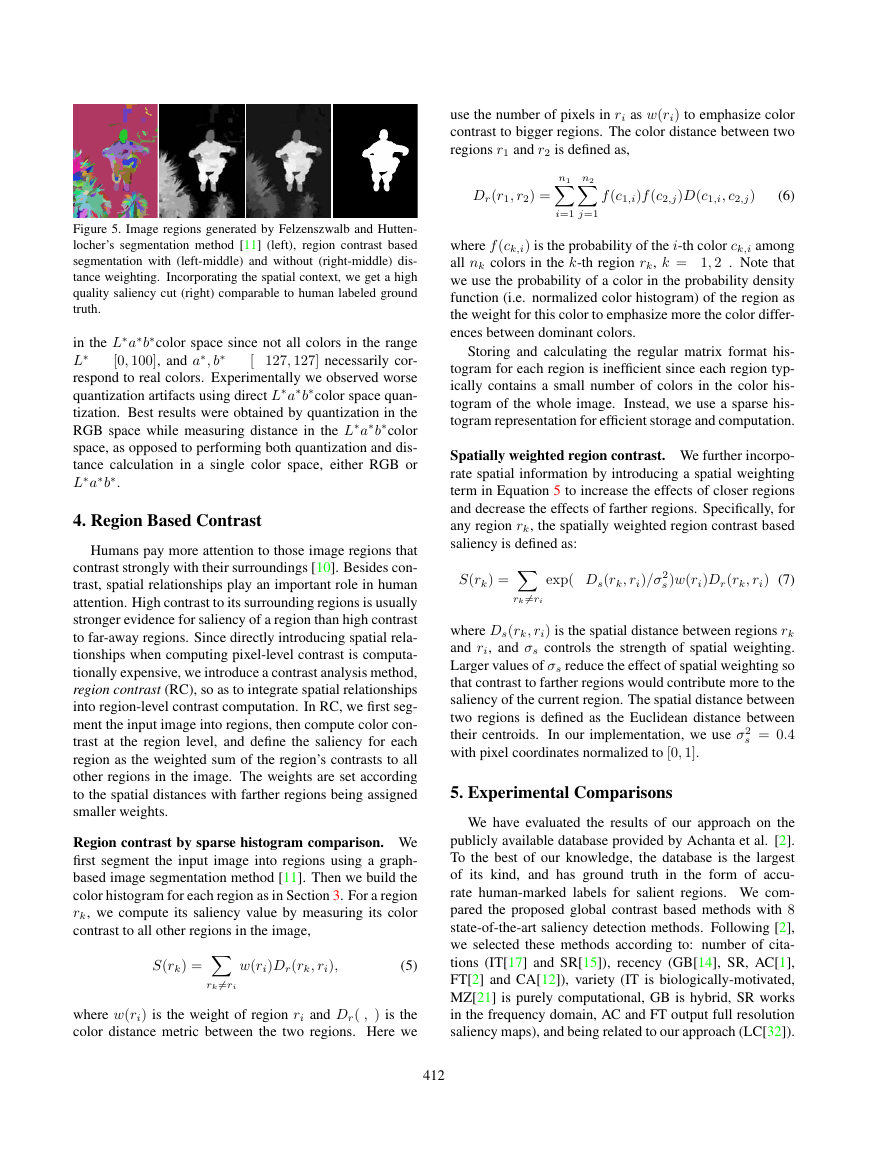
Figure 5. Image regions generated by Felzenszwalb and Hutten-
locher’s segmentation method [11] (left), region contrast based
segmentation with (left-middle) and without (right-middle) dis-
tance weighting. Incorporating the spatial context, we get a high
quality saliency cut (right) comparable to human labeled ground
truth.
in the L∗a∗b∗color space since not all colors in the range
L∗ 2 [0, 100], and a∗, b∗ 2 [127, 127] necessarily cor-
respond to real colors. Experimentally we observed worse
quantization artifacts using direct L∗a∗b∗color space quan-
tization. Best results were obtained by quantization in the
RGB space while measuring distance in the L∗a∗b∗color
space, as opposed to performing both quantization and dis-
tance calculation in a single color space, either RGB or
L∗a∗b∗.
4. Region Based Contrast
Humans pay more attention to those image regions that
contrast strongly with their surroundings [10]. Besides con-
trast, spatial relationships play an important role in human
attention. High contrast to its surrounding regions is usually
stronger evidence for saliency of a region than high contrast
to far-away regions. Since directly introducing spatial rela-
tionships when computing pixel-level contrast is computa-
tionally expensive, we introduce a contrast analysis method,
region contrast (RC), so as to integrate spatial relationships
into region-level contrast computation. In RC, we first seg-
ment the input image into regions, then compute color con-
trast at the region level, and define the saliency for each
region as the weighted sum of the region’s contrasts to all
other regions in the image. The weights are set according
to the spatial distances with farther regions being assigned
smaller weights.
Region contrast by sparse histogram comparison. We
first segment the input image into regions using a graph-
based image segmentation method [11]. Then we build the
color histogram for each region as in Section 3. For a region
rk, we compute its saliency value by measuring its color
contrast to all other regions in the image,
w(ri)Dr(rk, ri),
(5)
S(rk) =
rk=ri
where w(ri) is the weight of region ri and Dr(,) is the
color distance metric between the two regions. Here we
412
�
(a) original
(b) LC
(c) CA
(d) FT
(e) HC-maps
(f) RC-maps
(g) RCC
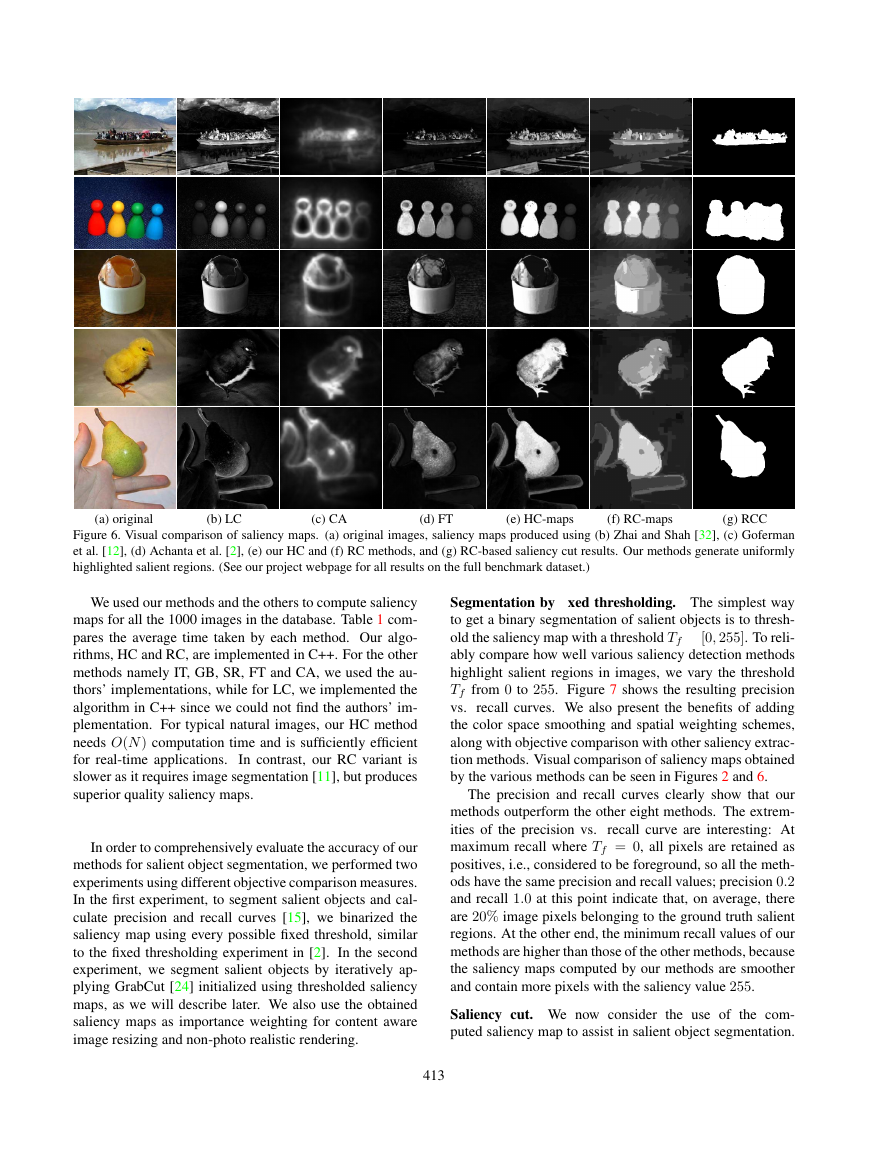
Figure 6. Visual comparison of saliency maps. (a) original images, saliency maps produced using (b) Zhai and Shah [32], (c) Goferman
et al. [12], (d) Achanta et al. [2], (e) our HC and (f) RC methods, and (g) RC-based saliency cut results. Our methods generate uniformly
highlighted salient regions. (See our project webpage for all results on the full benchmark dataset.)
We used our methods and the others to compute saliency
maps for all the 1000 images in the database. Table 1 com-
pares the average time taken by each method. Our algo-
rithms, HC and RC, are implemented in C++. For the other
methods namely IT, GB, SR, FT and CA, we used the au-
thors’ implementations, while for LC, we implemented the
algorithm in C++ since we could not find the authors’ im-
plementation. For typical natural images, our HC method
needs O(N) computation time and is sufficiently efficient
for real-time applications.
In contrast, our RC variant is
slower as it requires image segmentation [11], but produces
superior quality saliency maps.
In order to comprehensively evaluate the accuracy of our
methods for salient object segmentation, we performed two
experiments using different objective comparison measures.
In the first experiment, to segment salient objects and cal-
culate precision and recall curves [15], we binarized the
saliency map using every possible fixed threshold, similar
to the fixed thresholding experiment in [2]. In the second
experiment, we segment salient objects by iteratively ap-
plying GrabCut [24] initialized using thresholded saliency
maps, as we will describe later. We also use the obtained
saliency maps as importance weighting for content aware
image resizing and non-photo realistic rendering.
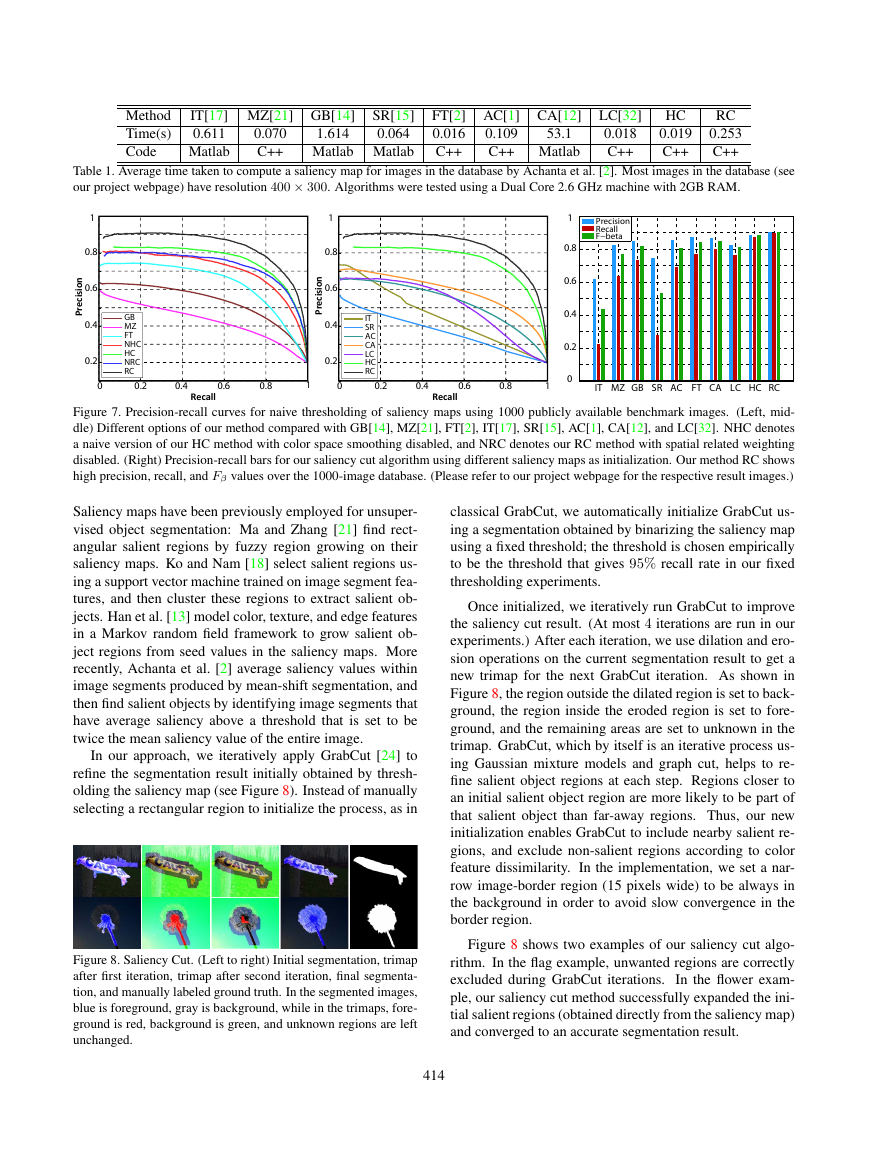
Segmentation by xed thresholding. The simplest way
to get a binary segmentation of salient objects is to thresh-
old the saliency map with a threshold Tf 2 [0, 255]. To reli-
ably compare how well various saliency detection methods
highlight salient regions in images, we vary the threshold
Tf from 0 to 255. Figure 7 shows the resulting precision
vs. recall curves. We also present the benefits of adding
the color space smoothing and spatial weighting schemes,
along with objective comparison with other saliency extrac-
tion methods. Visual comparison of saliency maps obtained
by the various methods can be seen in Figures 2 and 6.
The precision and recall curves clearly show that our
methods outperform the other eight methods. The extrem-
ities of the precision vs.
recall curve are interesting: At
maximum recall where Tf = 0, all pixels are retained as
positives, i.e., considered to be foreground, so all the meth-
ods have the same precision and recall values; precision 0.2
and recall 1.0 at this point indicate that, on average, there
are 20% image pixels belonging to the ground truth salient
regions. At the other end, the minimum recall values of our
methods are higher than those of the other methods, because
the saliency maps computed by our methods are smoother
and contain more pixels with the saliency value 255.
Saliency cut. We now consider the use of the com-
puted saliency map to assist in salient object segmentation.
413
�
Method
Time(s)
Code
SR[15]
IT[17] MZ[21] GB[14]
1.614
0.611
0.064
Matlab Matlab
Matlab
0.070
C++
FT[2] AC[1] CA[12] LC[32]
0.018
0.016
C++
C++
0.109
53.1
C++ Matlab
HC
0.019
C++
RC
0.253
C++
Table 1. Average time taken to compute a saliency map for images in the database by Achanta et al. [2]. Most images in the database (see
our project webpage) have resolution 400 × 300. Algorithms were tested using a Dual Core 2.6 GHz machine with 2GB RAM.
1
0.8
0.6
n
o
i
s
i
c
e
r
P
0.4
0.2
0
GB
MZ
FT
NHC
HC
NRC
RC
0.2
0.4
1
0.8
0.6
n
o
i
s
i
c
e
r
P
0.4
0.2
0.6
0.8
1
0
IT
SR
AC
CA
LC
HC
RC
0.2
0.4
Precision
Recall
F−beta
1
0.8
0.6
0.4
0.2
0.6
0.8
0
1
IT MZ GB SR AC FT CA LC HC RC
Recall
Recall
Figure 7. Precision-recall curves for naive thresholding of saliency maps using 1000 publicly available benchmark images. (Left, mid-
dle) Different options of our method compared with GB[14], MZ[21], FT[2], IT[17], SR[15], AC[1], CA[12], and LC[32]. NHC denotes
a naive version of our HC method with color space smoothing disabled, and NRC denotes our RC method with spatial related weighting
disabled. (Right) Precision-recall bars for our saliency cut algorithm using different saliency maps as initialization. Our method RC shows
high precision, recall, and Fβ values over the 1000-image database. (Please refer to our project webpage for the respective result images.)
Saliency maps have been previously employed for unsuper-
vised object segmentation: Ma and Zhang [21] find rect-
angular salient regions by fuzzy region growing on their
saliency maps. Ko and Nam [18] select salient regions us-
ing a support vector machine trained on image segment fea-
tures, and then cluster these regions to extract salient ob-
jects. Han et al. [13] model color, texture, and edge features
in a Markov random field framework to grow salient ob-
ject regions from seed values in the saliency maps. More
recently, Achanta et al. [2] average saliency values within
image segments produced by mean-shift segmentation, and
then find salient objects by identifying image segments that
have average saliency above a threshold that is set to be
twice the mean saliency value of the entire image.
In our approach, we iteratively apply GrabCut [24] to
refine the segmentation result initially obtained by thresh-
olding the saliency map (see Figure 8). Instead of manually
selecting a rectangular region to initialize the process, as in
Figure 8. Saliency Cut. (Left to right) Initial segmentation, trimap
after first iteration, trimap after second iteration, final segmenta-
tion, and manually labeled ground truth. In the segmented images,
blue is foreground, gray is background, while in the trimaps, fore-
ground is red, background is green, and unknown regions are left
unchanged.
414
classical GrabCut, we automatically initialize GrabCut us-
ing a segmentation obtained by binarizing the saliency map
using a fixed threshold; the threshold is chosen empirically
to be the threshold that gives 95% recall rate in our fixed
thresholding experiments.
Once initialized, we iteratively run GrabCut to improve
the saliency cut result. (At most 4 iterations are run in our
experiments.) After each iteration, we use dilation and ero-
sion operations on the current segmentation result to get a
new trimap for the next GrabCut iteration. As shown in
Figure 8, the region outside the dilated region is set to back-
ground, the region inside the eroded region is set to fore-
ground, and the remaining areas are set to unknown in the
trimap. GrabCut, which by itself is an iterative process us-
ing Gaussian mixture models and graph cut, helps to re-
fine salient object regions at each step. Regions closer to
an initial salient object region are more likely to be part of
that salient object than far-away regions. Thus, our new
initialization enables GrabCut to include nearby salient re-
gions, and exclude non-salient regions according to color
feature dissimilarity. In the implementation, we set a nar-
row image-border region (15 pixels wide) to be always in
the background in order to avoid slow convergence in the
border region.
Figure 8 shows two examples of our saliency cut algo-
rithm. In the flag example, unwanted regions are correctly
excluded during GrabCut iterations.
In the flower exam-
ple, our saliency cut method successfully expanded the ini-
tial salient regions (obtained directly from the saliency map)
and converged to an accurate segmentation result.
�
(a) original
(b) LC[32]
(c) CA[12]
(d) FT[2]
(e) HC-maps
(f) RC-maps
(g) ground truth
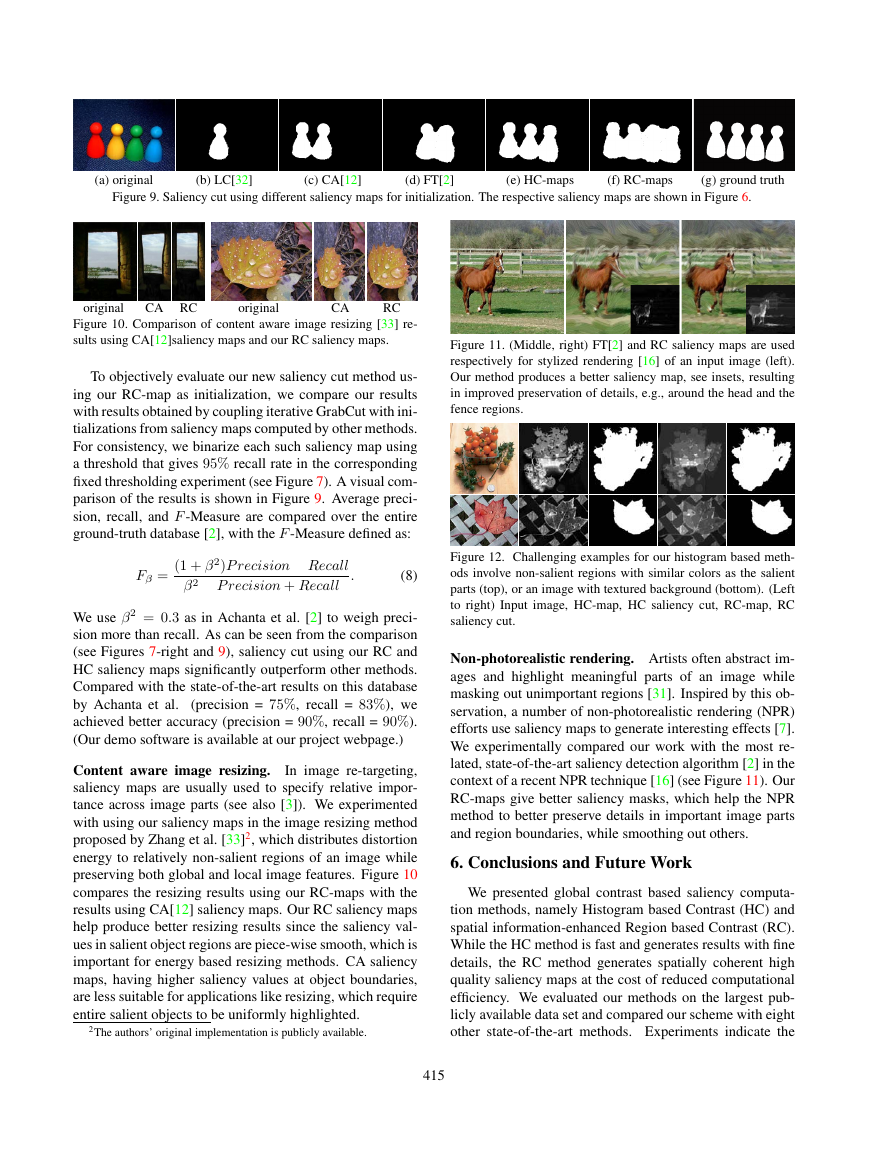
Figure 9. Saliency cut using different saliency maps for initialization. The respective saliency maps are shown in Figure 6.
original
CA RC
original
CA
RC
Figure 10. Comparison of content aware image resizing [33] re-
sults using CA[12]saliency maps and our RC saliency maps.
To objectively evaluate our new saliency cut method us-
ing our RC-map as initialization, we compare our results
with results obtained by coupling iterative GrabCut with ini-
tializations from saliency maps computed by other methods.
For consistency, we binarize each such saliency map using
a threshold that gives 95% recall rate in the corresponding
fixed thresholding experiment (see Figure 7). A visual com-
parison of the results is shown in Figure 9. Average preci-
sion, recall, and F -Measure are compared over the entire
ground-truth database [2], with the F -Measure defined as:
Fβ =
(1 + β2)P recision Recall
β2 P recision + Recall
.
(8)
We use β2 = 0.3 as in Achanta et al. [2] to weigh preci-
sion more than recall. As can be seen from the comparison
(see Figures 7-right and 9), saliency cut using our RC and
HC saliency maps significantly outperform other methods.
Compared with the state-of-the-art results on this database
(precision = 75%, recall = 83%), we
by Achanta et al.
achieved better accuracy (precision = 90%, recall = 90%).
(Our demo software is available at our project webpage.)
Content aware image resizing.
In image re-targeting,
saliency maps are usually used to specify relative impor-
tance across image parts (see also [3]). We experimented
with using our saliency maps in the image resizing method
proposed by Zhang et al. [33]2, which distributes distortion
energy to relatively non-salient regions of an image while
preserving both global and local image features. Figure 10
compares the resizing results using our RC-maps with the
results using CA[12] saliency maps. Our RC saliency maps
help produce better resizing results since the saliency val-
ues in salient object regions are piece-wise smooth, which is
important for energy based resizing methods. CA saliency
maps, having higher saliency values at object boundaries,
are less suitable for applications like resizing, which require
entire salient objects to be uniformly highlighted.
2The authors’ original implementation is publicly available.
Figure 11. (Middle, right) FT[2] and RC saliency maps are used
respectively for stylized rendering [16] of an input image (left).
Our method produces a better saliency map, see insets, resulting
in improved preservation of details, e.g., around the head and the
fence regions.
Figure 12. Challenging examples for our histogram based meth-
ods involve non-salient regions with similar colors as the salient
parts (top), or an image with textured background (bottom). (Left
to right) Input image, HC-map, HC saliency cut, RC-map, RC
saliency cut.
Non-photorealistic rendering. Artists often abstract im-
ages and highlight meaningful parts of an image while
masking out unimportant regions [31]. Inspired by this ob-
servation, a number of non-photorealistic rendering (NPR)
efforts use saliency maps to generate interesting effects [7].
We experimentally compared our work with the most re-
lated, state-of-the-art saliency detection algorithm [2] in the
context of a recent NPR technique [16] (see Figure 11). Our
RC-maps give better saliency masks, which help the NPR
method to better preserve details in important image parts
and region boundaries, while smoothing out others.
6. Conclusions and Future Work
We presented global contrast based saliency computa-
tion methods, namely Histogram based Contrast (HC) and
spatial information-enhanced Region based Contrast (RC).
While the HC method is fast and generates results with fine
details, the RC method generates spatially coherent high
quality saliency maps at the cost of reduced computational
efficiency. We evaluated our methods on the largest pub-
licly available data set and compared our scheme with eight
other state-of-the-art methods. Experiments indicate the
415
�



 2023年江西萍乡中考道德与法治真题及答案.doc
 2012年重庆南川中考生物真题及答案.doc
 2013年江西师范大学地理学综合及文艺理论基础考研真题.doc
 2020年四川甘孜小升初语文真题及答案I卷.doc
 2020年注册岩土工程师专业基础考试真题及答案.doc
 2023-2024学年福建省厦门市九年级上学期数学月考试题及答案.doc
 2021-2022学年辽宁省沈阳市大东区九年级上学期语文期末试题及答案.doc
 2022-2023学年北京东城区初三第一学期物理期末试卷及答案.doc
 2018上半年江西教师资格初中地理学科知识与教学能力真题及答案.doc
 2012年河北国家公务员申论考试真题及答案-省级.doc
 2020-2021学年江苏省扬州市江都区邵樊片九年级上学期数学第一次质量检测试题及答案.doc
 2022下半年黑龙江教师资格证中学综合素质真题及答案.doc