利用 MATLAB 实现图像的空域滤波。
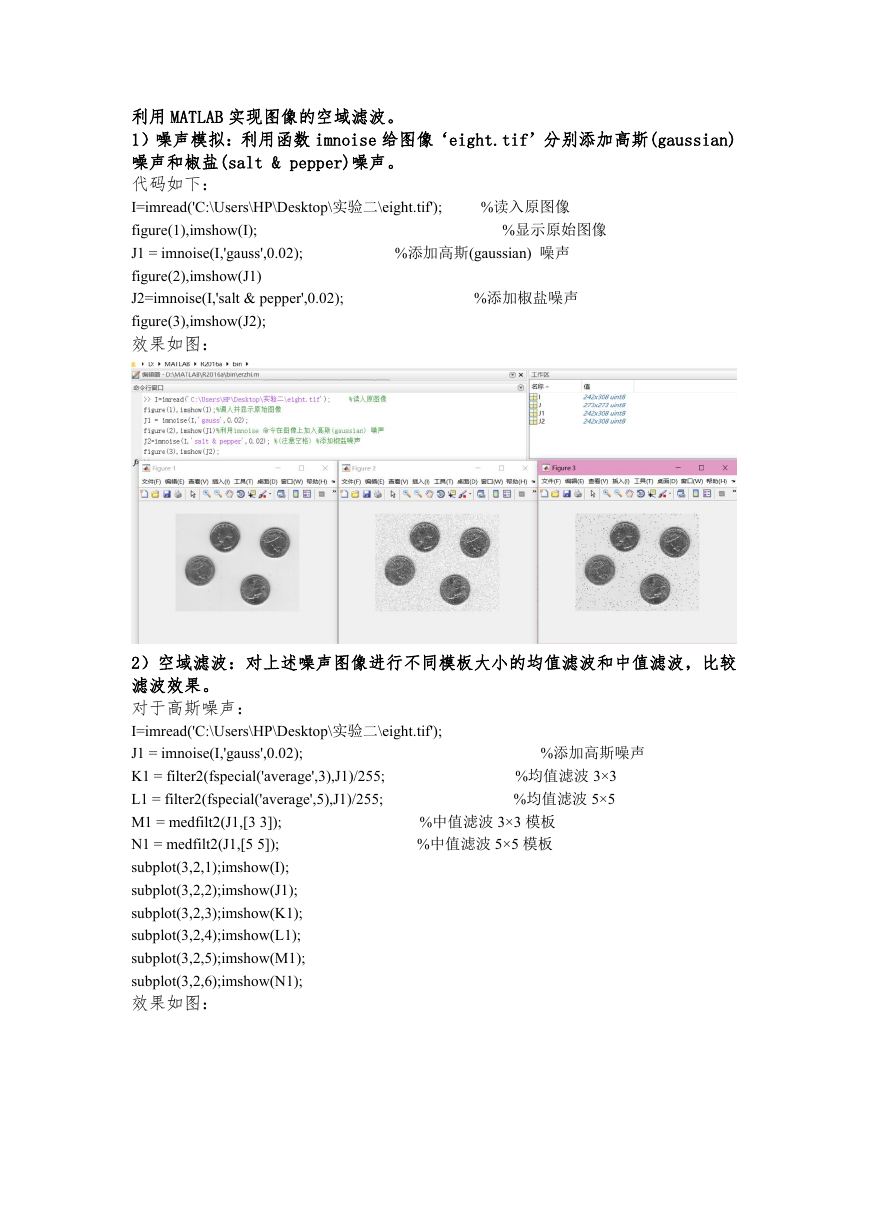
1)噪声模拟:利用函数 imnoise 给图像‘eight.tif’分别添加高斯(gaussian)
噪声和椒盐(salt & pepper)噪声。
代码如下:
I=imread('C:\Users\HP\Desktop\实验二\eight.tif');
figure(1),imshow(I);
J1 = imnoise(I,'gauss',0.02);
figure(2),imshow(J1)
J2=imnoise(I,'salt & pepper',0.02);
figure(3),imshow(J2);
效果如图:
%添加高斯(gaussian) 噪声
%显示原始图像
%读入原图像
%添加椒盐噪声
%添加高斯噪声
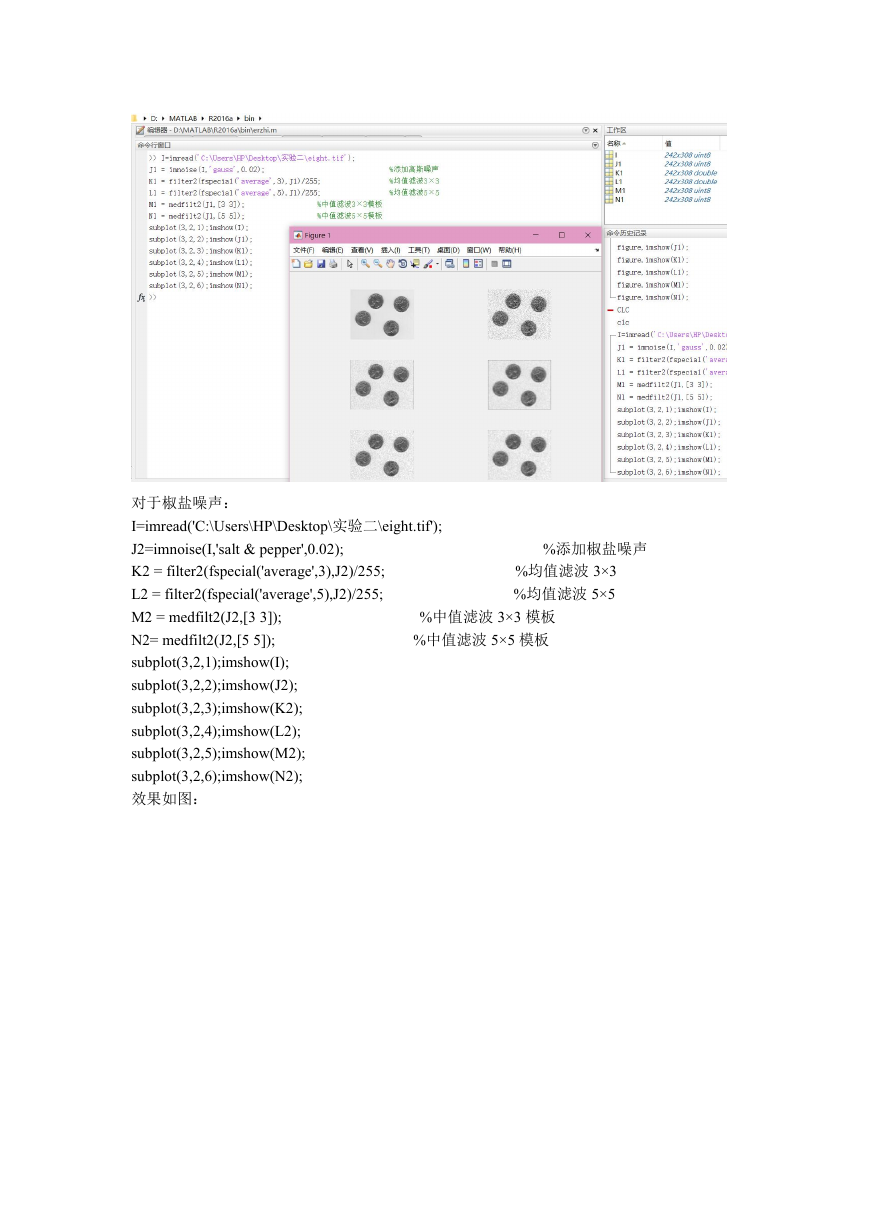
2)空域滤波:对上述噪声图像进行不同模板大小的均值滤波和中值滤波,比较
滤波效果。
对于高斯噪声:
I=imread('C:\Users\HP\Desktop\实验二\eight.tif');
J1 = imnoise(I,'gauss',0.02);
K1 = filter2(fspecial('average',3),J1)/255;
L1 = filter2(fspecial('average',5),J1)/255;
M1 = medfilt2(J1,[3 3]);
N1 = medfilt2(J1,[5 5]);
subplot(3,2,1);imshow(I);
subplot(3,2,2);imshow(J1);
subplot(3,2,3);imshow(K1);
subplot(3,2,4);imshow(L1);
subplot(3,2,5);imshow(M1);
subplot(3,2,6);imshow(N1);
效果如图:
%中值滤波 3×3 模板
%中值滤波 5×5 模板
%均值滤波 3×3
%均值滤波 5×5
�
%添加椒盐噪声
%均值滤波 3×3
%均值滤波 5×5
%中值滤波 3×3 模板
%中值滤波 5×5 模板
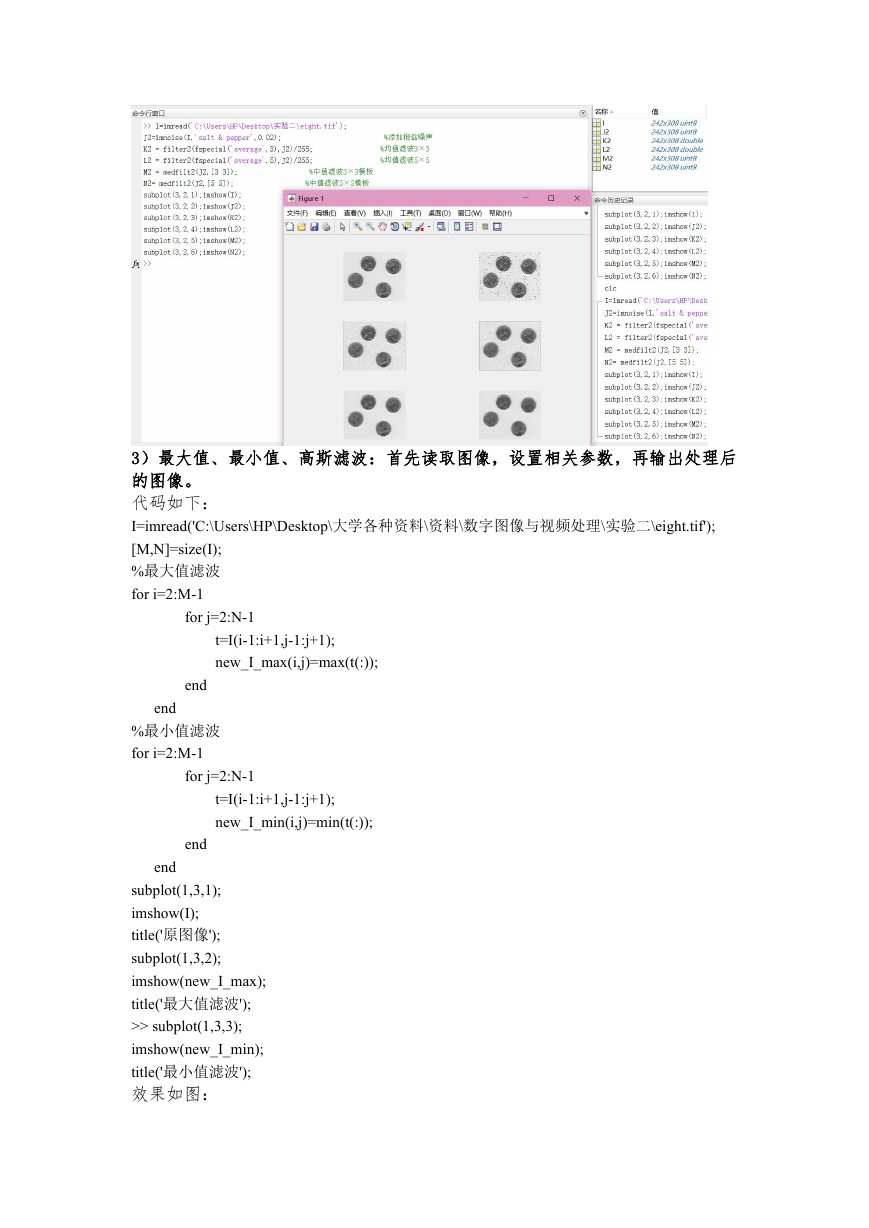
对于椒盐噪声:
I=imread('C:\Users\HP\Desktop\实验二\eight.tif');
J2=imnoise(I,'salt & pepper',0.02);
K2 = filter2(fspecial('average',3),J2)/255;
L2 = filter2(fspecial('average',5),J2)/255;
M2 = medfilt2(J2,[3 3]);
N2= medfilt2(J2,[5 5]);
subplot(3,2,1);imshow(I);
subplot(3,2,2);imshow(J2);
subplot(3,2,3);imshow(K2);
subplot(3,2,4);imshow(L2);
subplot(3,2,5);imshow(M2);
subplot(3,2,6);imshow(N2);
效果如图:
�
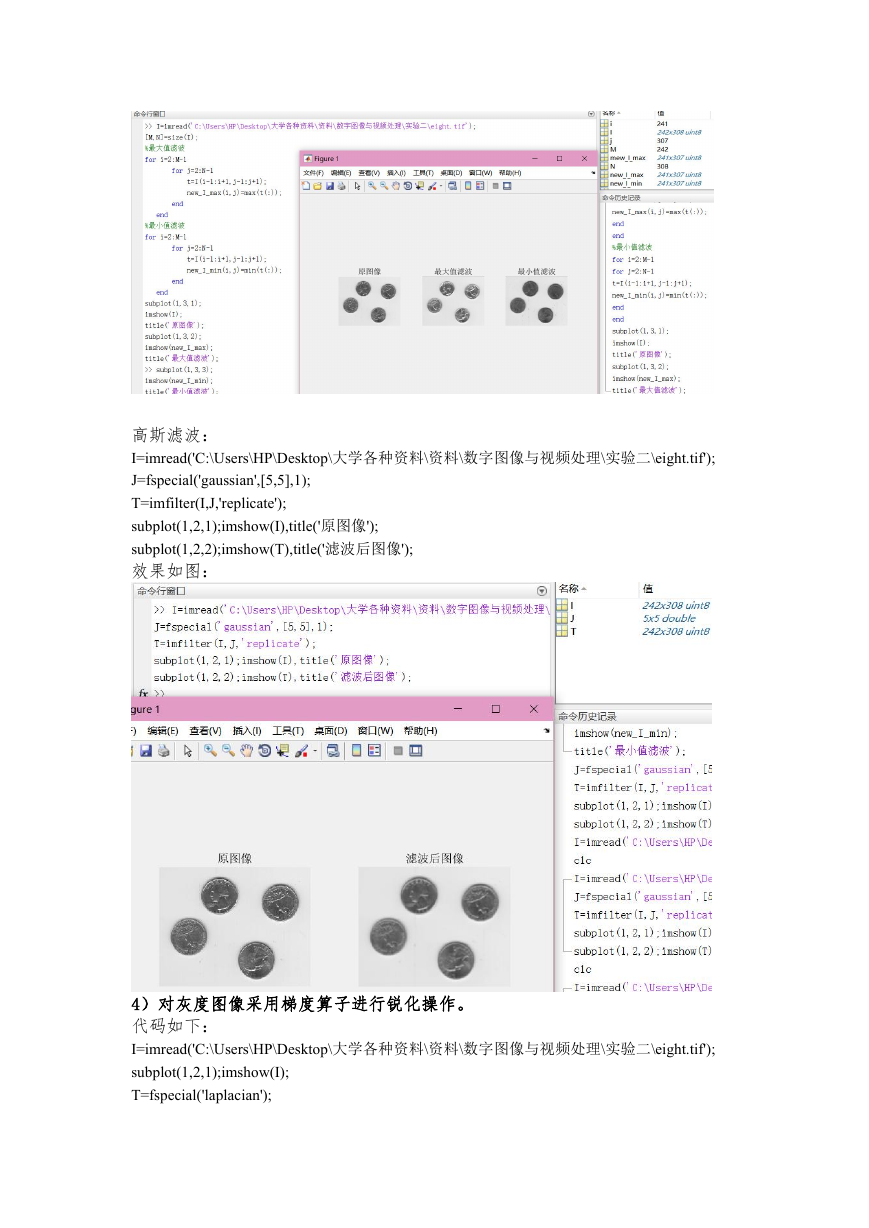
3)最大值、最小值、高斯滤波:首先读取图像,设置相关参数,再输出处理后
的图像。
代码如下:
I=imread('C:\Users\HP\Desktop\大学各种资料\资料\数字图像与视频处理\实验二\eight.tif');
[M,N]=size(I);
%最大值滤波
for i=2:M-1
for j=2:N-1
t=I(i-1:i+1,j-1:j+1);
new_I_max(i,j)=max(t(:));
end
end
%最小值滤波
for i=2:M-1
for j=2:N-1
t=I(i-1:i+1,j-1:j+1);
new_I_min(i,j)=min(t(:));
end
end
subplot(1,3,1);
imshow(I);
title('原图像');
subplot(1,3,2);
imshow(new_I_max);
title('最大值滤波');
>> subplot(1,3,3);
imshow(new_I_min);
title('最小值滤波');
效果如图:
�
高斯滤波:
I=imread('C:\Users\HP\Desktop\大学各种资料\资料\数字图像与视频处理\实验二\eight.tif');
J=fspecial('gaussian',[5,5],1);
T=imfilter(I,J,'replicate');
subplot(1,2,1);imshow(I),title('原图像');
subplot(1,2,2);imshow(T),title('滤波后图像');
效果如图:
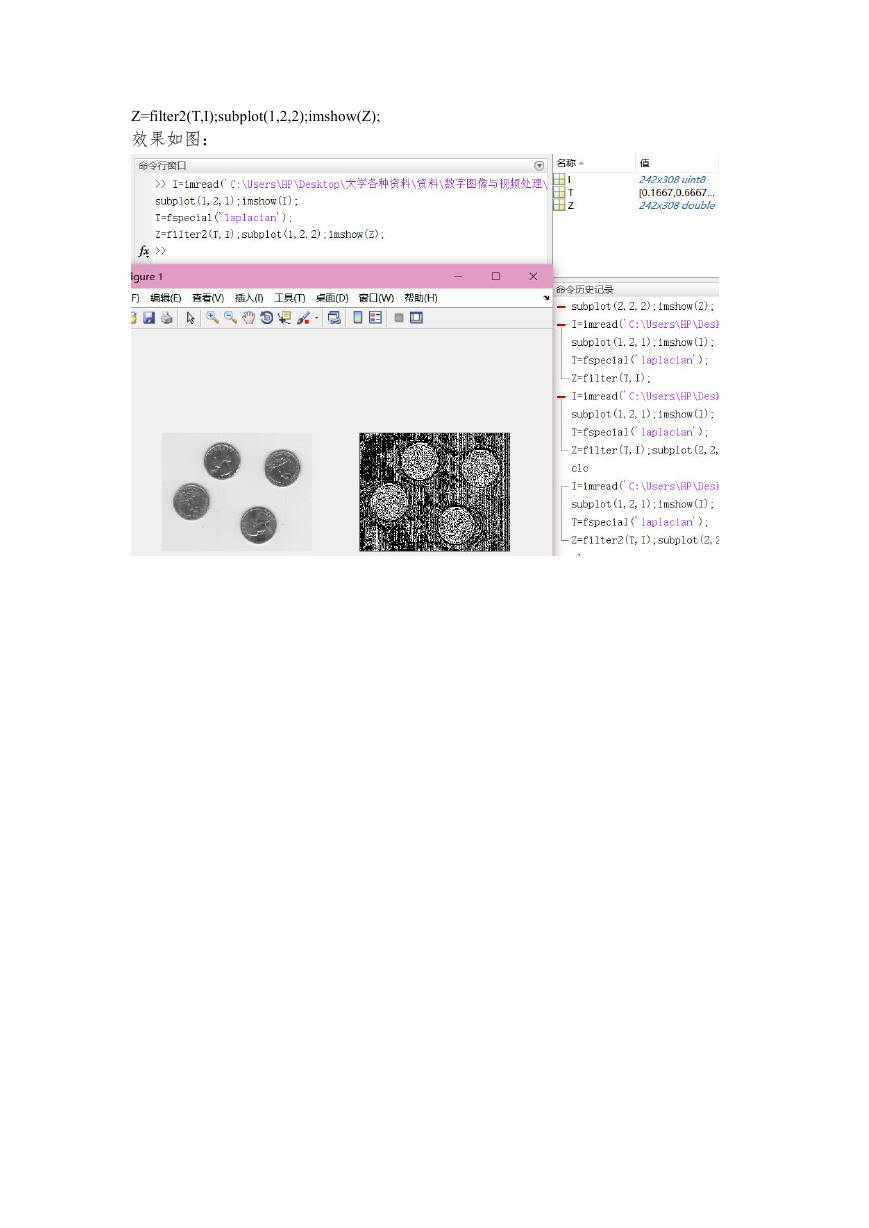
4)对灰度图像采用梯度算子进行锐化操作。
代码如下:
I=imread('C:\Users\HP\Desktop\大学各种资料\资料\数字图像与视频处理\实验二\eight.tif');
subplot(1,2,1);imshow(I);
T=fspecial('laplacian');
�
Z=filter2(T,I);subplot(1,2,2);imshow(Z);
效果如图:
�


 2023年江西萍乡中考道德与法治真题及答案.doc
 2012年重庆南川中考生物真题及答案.doc
 2013年江西师范大学地理学综合及文艺理论基础考研真题.doc
 2020年四川甘孜小升初语文真题及答案I卷.doc
 2020年注册岩土工程师专业基础考试真题及答案.doc
 2023-2024学年福建省厦门市九年级上学期数学月考试题及答案.doc
 2021-2022学年辽宁省沈阳市大东区九年级上学期语文期末试题及答案.doc
 2022-2023学年北京东城区初三第一学期物理期末试卷及答案.doc
 2018上半年江西教师资格初中地理学科知识与教学能力真题及答案.doc
 2012年河北国家公务员申论考试真题及答案-省级.doc
 2020-2021学年江苏省扬州市江都区邵樊片九年级上学期数学第一次质量检测试题及答案.doc
 2022下半年黑龙江教师资格证中学综合素质真题及答案.doc