Format of CLIGEN weather station statistics input files
for CLIGEN versions 4.1 - 5.1 as of 6/2001 (D.C. Flanagan).
updated 12/11/2008 - Jim Frankenberger
These files are also known as CLIGEN state files and may contain a
number of statistics for multiple stations in a state. The following
information was compiled by Dennis C. Flanagan, USDA-ARS National Soil
Erosion Research Lab, West Lafayette, IN with the help of Mark A.
Nearing, USDA-ARS National Soil Erosion Research Lab, West Lafayette,
IN, and Jeff G. Arnold, USDA-ARS Grassland, Soil/Water Research Lab,
Temple, TX.
12/11/2008 - The units for wind velocity and wind velocity standard
deviation were incorrect (mph) in the previous version of the documentation. The
correct units for wind velocity and wind velocity standard deviation are m/s.
--------------------------------------------------------------------------------
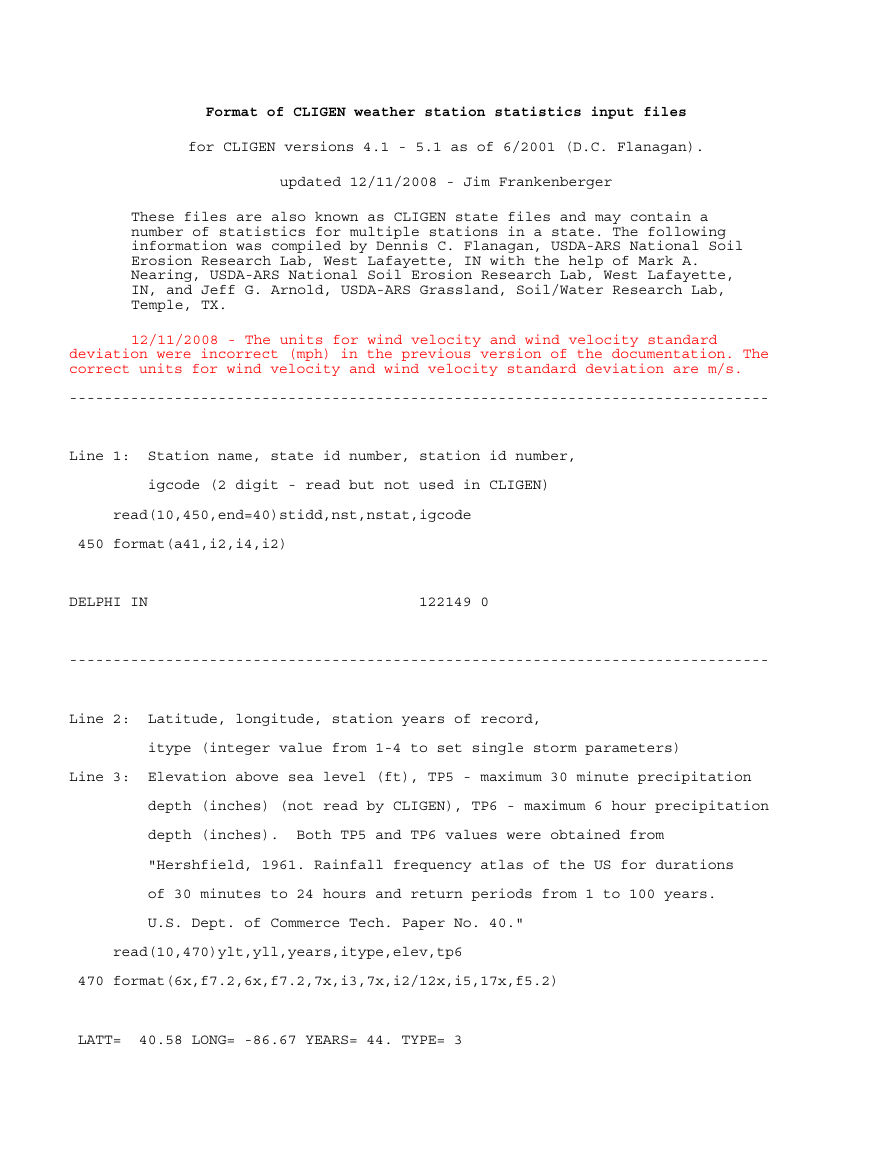
Line 1: Station name, state id number, station id number,
igcode (2 digit - read but not used in CLIGEN)
read(10,450,end=40)stidd,nst,nstat,igcode
450 format(a41,i2,i4,i2)
DELPHI IN 122149 0
--------------------------------------------------------------------------------
Line 2: Latitude, longitude, station years of record,
itype (integer value from 1-4 to set single storm parameters)
Line 3: Elevation above sea level (ft), TP5 - maximum 30 minute precipitation
depth (inches) (not read by CLIGEN), TP6 - maximum 6 hour precipitation
depth (inches). Both TP5 and TP6 values were obtained from
"Hershfield, 1961. Rainfall frequency atlas of the US for durations
of 30 minutes to 24 hours and return periods from 1 to 100 years.
U.S. Dept. of Commerce Tech. Paper No. 40."
read(10,470)ylt,yll,years,itype,elev,tp6
470 format(6x,f7.2,6x,f7.2,7x,i3,7x,i2/12x,i5,17x,f5.2)
LATT= 40.58 LONG= -86.67 YEARS= 44. TYPE= 3
�
ELEVATION = 670. TP5 = 2.17 TP6= 4.22
--------------------------------------------------------------------------------
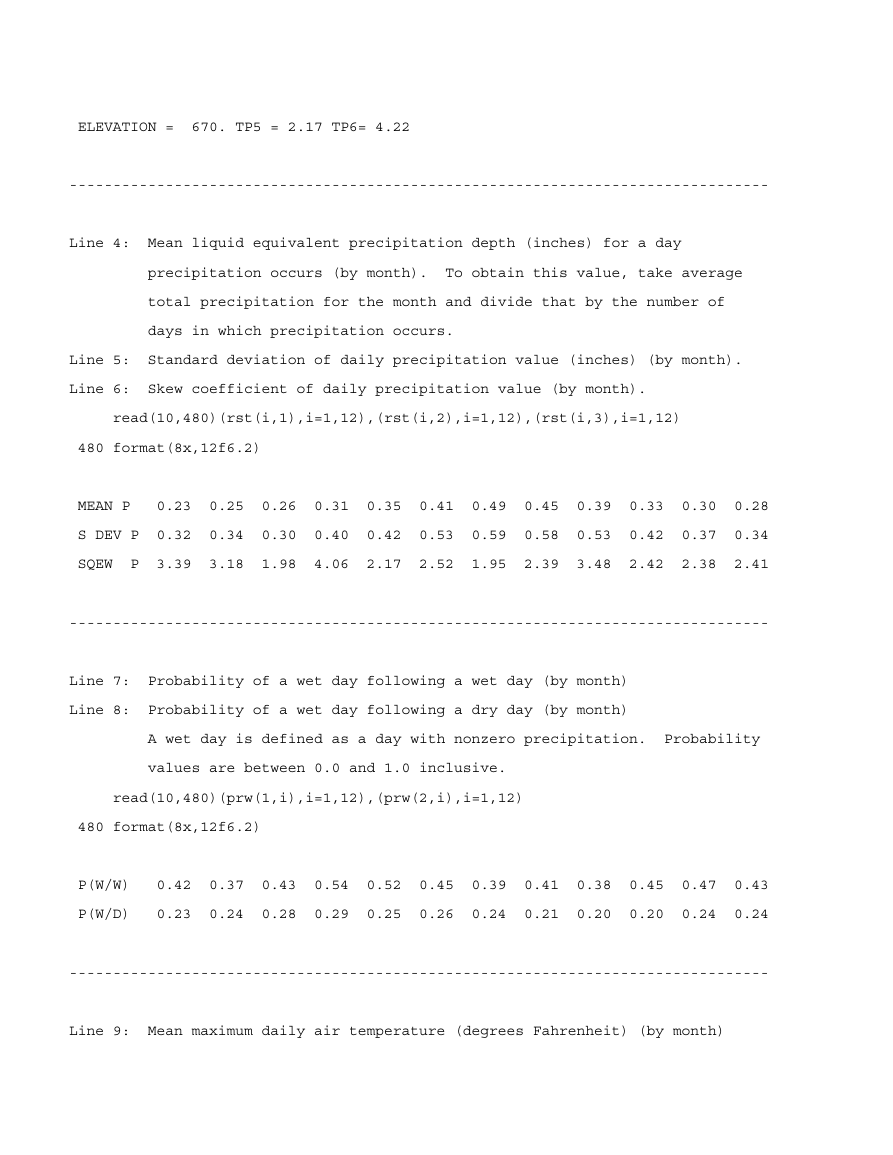
Line 4: Mean liquid equivalent precipitation depth (inches) for a day
precipitation occurs (by month). To obtain this value, take average
total precipitation for the month and divide that by the number of
days in which precipitation occurs.
Line 5: Standard deviation of daily precipitation value (inches) (by month).
Line 6: Skew coefficient of daily precipitation value (by month).
read(10,480)(rst(i,1),i=1,12),(rst(i,2),i=1,12),(rst(i,3),i=1,12)
480 format(8x,12f6.2)
MEAN P 0.23 0.25 0.26 0.31 0.35 0.41 0.49 0.45 0.39 0.33 0.30 0.28
S DEV P 0.32 0.34 0.30 0.40 0.42 0.53 0.59 0.58 0.53 0.42 0.37 0.34
SQEW P 3.39 3.18 1.98 4.06 2.17 2.52 1.95 2.39 3.48 2.42 2.38 2.41
--------------------------------------------------------------------------------
Line 7: Probability of a wet day following a wet day (by month)
Line 8: Probability of a wet day following a dry day (by month)
A wet day is defined as a day with nonzero precipitation. Probability
values are between 0.0 and 1.0 inclusive.
read(10,480)(prw(1,i),i=1,12),(prw(2,i),i=1,12)
480 format(8x,12f6.2)
P(W/W) 0.42 0.37 0.43 0.54 0.52 0.45 0.39 0.41 0.38 0.45 0.47 0.43
P(W/D) 0.23 0.24 0.28 0.29 0.25 0.26 0.24 0.21 0.20 0.20 0.24 0.24
--------------------------------------------------------------------------------
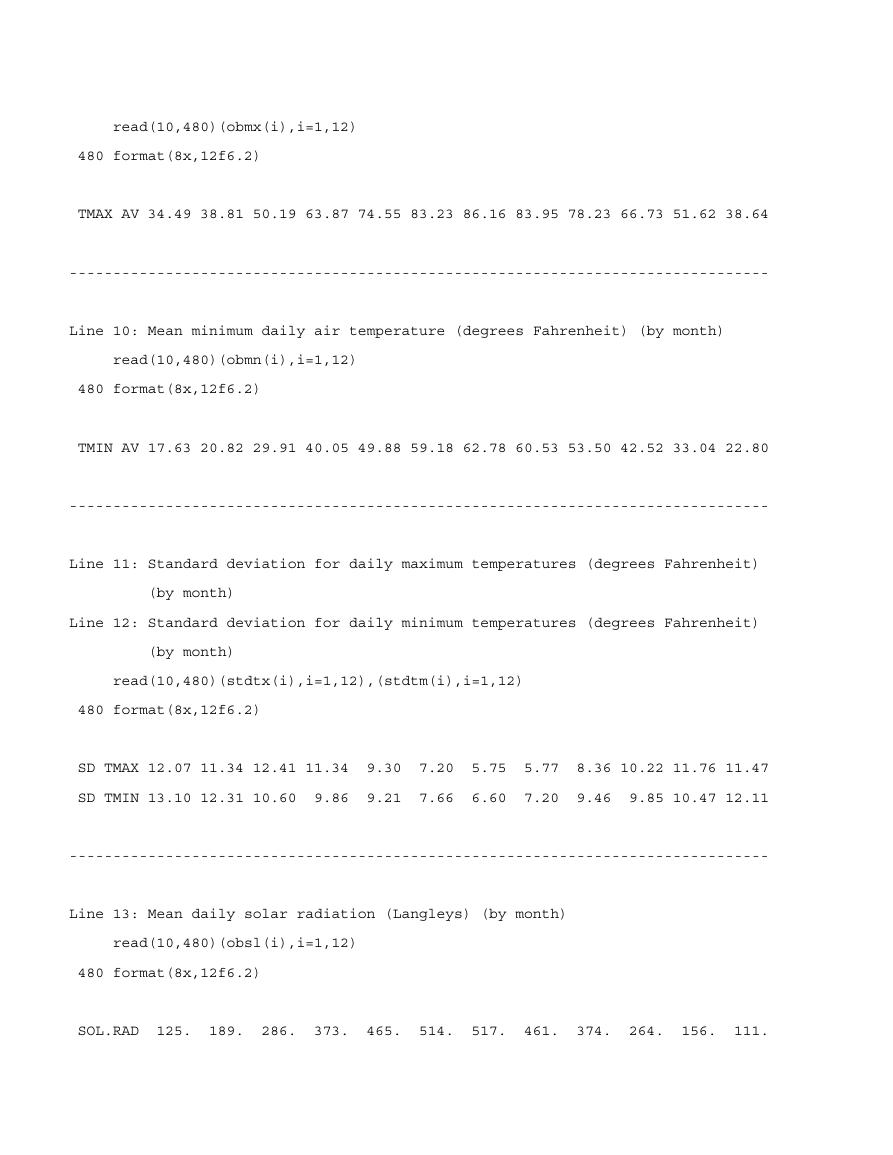
Line 9: Mean maximum daily air temperature (degrees Fahrenheit) (by month)
�
read(10,480)(obmx(i),i=1,12)
480 format(8x,12f6.2)
TMAX AV 34.49 38.81 50.19 63.87 74.55 83.23 86.16 83.95 78.23 66.73 51.62 38.64
--------------------------------------------------------------------------------
Line 10: Mean minimum daily air temperature (degrees Fahrenheit) (by month)
read(10,480)(obmn(i),i=1,12)
480 format(8x,12f6.2)
TMIN AV 17.63 20.82 29.91 40.05 49.88 59.18 62.78 60.53 53.50 42.52 33.04 22.80
--------------------------------------------------------------------------------
Line 11: Standard deviation for daily maximum temperatures (degrees Fahrenheit)
(by month)
Line 12: Standard deviation for daily minimum temperatures (degrees Fahrenheit)
(by month)
read(10,480)(stdtx(i),i=1,12),(stdtm(i),i=1,12)
480 format(8x,12f6.2)
SD TMAX 12.07 11.34 12.41 11.34 9.30 7.20 5.75 5.77 8.36 10.22 11.76 11.47
SD TMIN 13.10 12.31 10.60 9.86 9.21 7.66 6.60 7.20 9.46 9.85 10.47 12.11
--------------------------------------------------------------------------------
Line 13: Mean daily solar radiation (Langleys) (by month)
read(10,480)(obsl(i),i=1,12)
480 format(8x,12f6.2)
SOL.RAD 125. 189. 286. 373. 465. 514. 517. 461. 374. 264. 156. 111.
�
--------------------------------------------------------------------------------
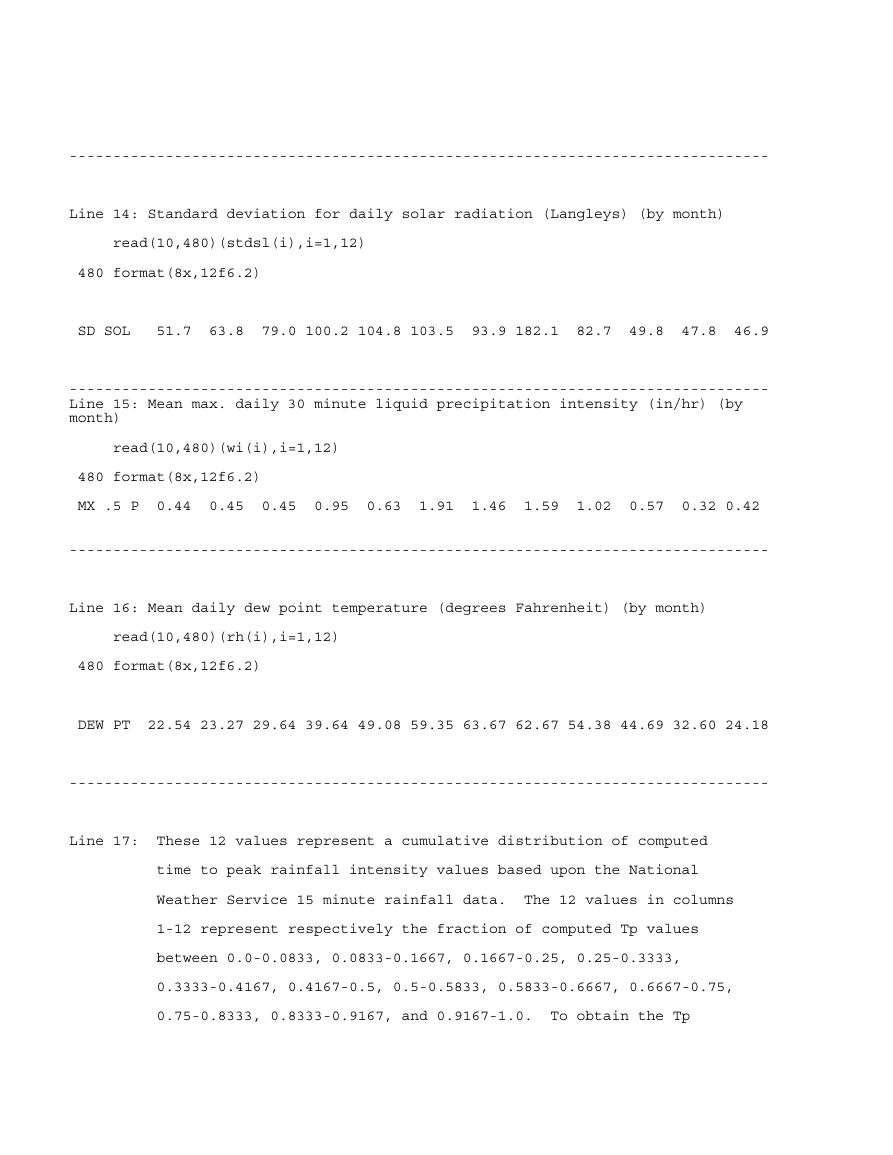
Line 14: Standard deviation for daily solar radiation (Langleys) (by month)
read(10,480)(stdsl(i),i=1,12)
480 format(8x,12f6.2)
SD SOL 51.7 63.8 79.0 100.2 104.8 103.5 93.9 182.1 82.7 49.8 47.8 46.9
--------------------------------------------------------------------------------
Line 15: Mean max. daily 30 minute liquid precipitation intensity (in/hr) (by
month)
read(10,480)(wi(i),i=1,12)
480 format(8x,12f6.2)
MX .5 P 0.44 0.45 0.45 0.95 0.63 1.91 1.46 1.59 1.02 0.57 0.32 0.42
--------------------------------------------------------------------------------
Line 16: Mean daily dew point temperature (degrees Fahrenheit) (by month)
read(10,480)(rh(i),i=1,12)
480 format(8x,12f6.2)
DEW PT 22.54 23.27 29.64 39.64 49.08 59.35 63.67 62.67 54.38 44.69 32.60 24.18
--------------------------------------------------------------------------------
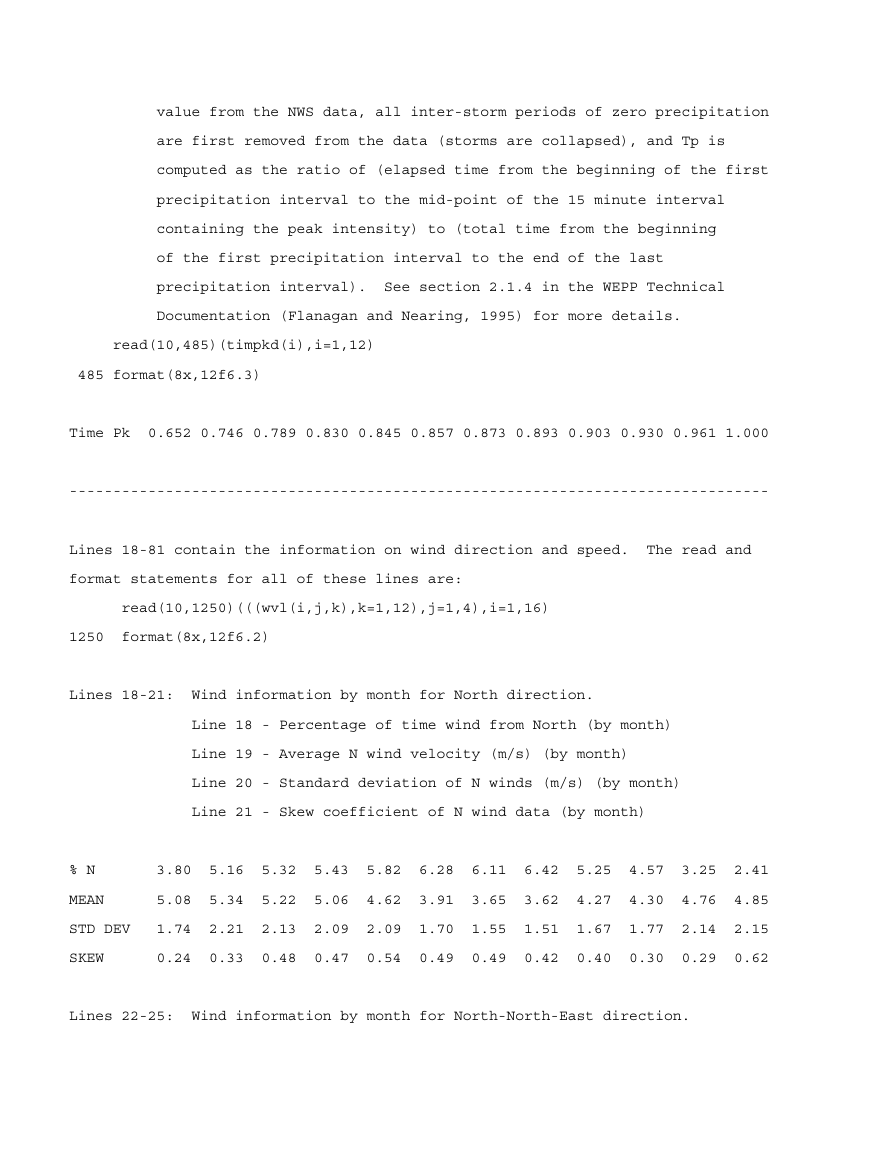
Line 17: These 12 values represent a cumulative distribution of computed
time to peak rainfall intensity values based upon the National
Weather Service 15 minute rainfall data. The 12 values in columns
1-12 represent respectively the fraction of computed Tp values
between 0.0-0.0833, 0.0833-0.1667, 0.1667-0.25, 0.25-0.3333,
0.3333-0.4167, 0.4167-0.5, 0.5-0.5833, 0.5833-0.6667, 0.6667-0.75,
0.75-0.8333, 0.8333-0.9167, and 0.9167-1.0. To obtain the Tp
�
value from the NWS data, all inter-storm periods of zero precipitation
are first removed from the data (storms are collapsed), and Tp is
computed as the ratio of (elapsed time from the beginning of the first
precipitation interval to the mid-point of the 15 minute interval
containing the peak intensity) to (total time from the beginning
of the first precipitation interval to the end of the last
precipitation interval). See section 2.1.4 in the WEPP Technical
Documentation (Flanagan and Nearing, 1995) for more details.
read(10,485)(timpkd(i),i=1,12)
485 format(8x,12f6.3)
Time Pk 0.652 0.746 0.789 0.830 0.845 0.857 0.873 0.893 0.903 0.930 0.961 1.000
--------------------------------------------------------------------------------
Lines 18-81 contain the information on wind direction and speed. The read and
format statements for all of these lines are:
read(10,1250)(((wvl(i,j,k),k=1,12),j=1,4),i=1,16)
1250 format(8x,12f6.2)
Lines 18-21: Wind information by month for North direction.
Line 18 - Percentage of time wind from North (by month)
Line 19 - Average N wind velocity (m/s) (by month)
Line 20 - Standard deviation of N winds (m/s) (by month)
Line 21 - Skew coefficient of N wind data (by month)
% N 3.80 5.16 5.32 5.43 5.82 6.28 6.11 6.42 5.25 4.57 3.25 2.41
MEAN 5.08 5.34 5.22 5.06 4.62 3.91 3.65 3.62 4.27 4.30 4.76 4.85
STD DEV 1.74 2.21 2.13 2.09 2.09 1.70 1.55 1.51 1.67 1.77 2.14 2.15
SKEW 0.24 0.33 0.48 0.47 0.54 0.49 0.49 0.42 0.40 0.30 0.29 0.62
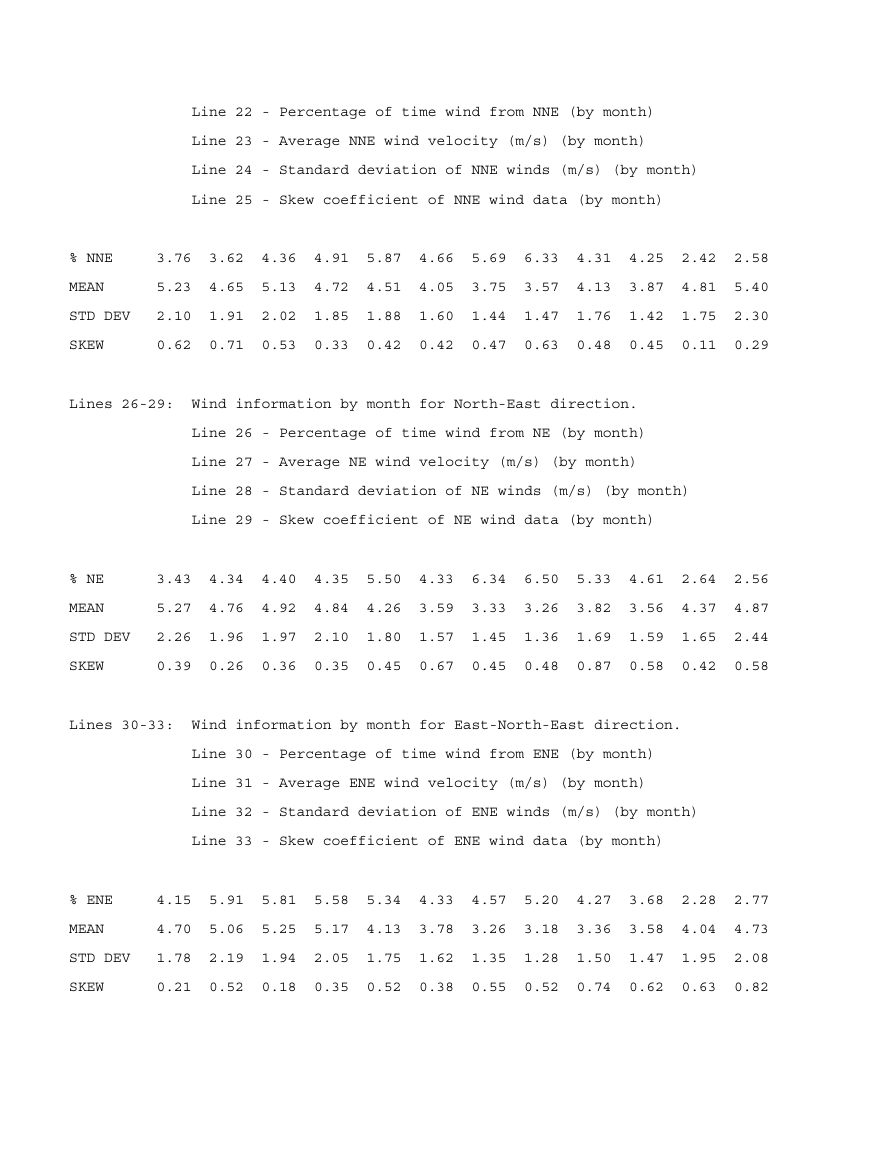
Lines 22-25: Wind information by month for North-North-East direction.
�
Line 22 - Percentage of time wind from NNE (by month)
Line 23 - Average NNE wind velocity (m/s) (by month)
Line 24 - Standard deviation of NNE winds (m/s) (by month)
Line 25 - Skew coefficient of NNE wind data (by month)
% NNE 3.76 3.62 4.36 4.91 5.87 4.66 5.69 6.33 4.31 4.25 2.42 2.58
MEAN 5.23 4.65 5.13 4.72 4.51 4.05 3.75 3.57 4.13 3.87 4.81 5.40
STD DEV 2.10 1.91 2.02 1.85 1.88 1.60 1.44 1.47 1.76 1.42 1.75 2.30
SKEW 0.62 0.71 0.53 0.33 0.42 0.42 0.47 0.63 0.48 0.45 0.11 0.29
Lines 26-29: Wind information by month for North-East direction.
Line 26 - Percentage of time wind from NE (by month)
Line 27 - Average NE wind velocity (m/s) (by month)
Line 28 - Standard deviation of NE winds (m/s) (by month)
Line 29 - Skew coefficient of NE wind data (by month)
% NE 3.43 4.34 4.40 4.35 5.50 4.33 6.34 6.50 5.33 4.61 2.64 2.56
MEAN 5.27 4.76 4.92 4.84 4.26 3.59 3.33 3.26 3.82 3.56 4.37 4.87
STD DEV 2.26 1.96 1.97 2.10 1.80 1.57 1.45 1.36 1.69 1.59 1.65 2.44
SKEW 0.39 0.26 0.36 0.35 0.45 0.67 0.45 0.48 0.87 0.58 0.42 0.58
Lines 30-33: Wind information by month for East-North-East direction.
Line 30 - Percentage of time wind from ENE (by month)
Line 31 - Average ENE wind velocity (m/s) (by month)
Line 32 - Standard deviation of ENE winds (m/s) (by month)
Line 33 - Skew coefficient of ENE wind data (by month)
% ENE 4.15 5.91 5.81 5.58 5.34 4.33 4.57 5.20 4.27 3.68 2.28 2.77
MEAN 4.70 5.06 5.25 5.17 4.13 3.78 3.26 3.18 3.36 3.58 4.04 4.73
STD DEV 1.78 2.19 1.94 2.05 1.75 1.62 1.35 1.28 1.50 1.47 1.95 2.08
SKEW 0.21 0.52 0.18 0.35 0.52 0.38 0.55 0.52 0.74 0.62 0.63 0.82
�
Lines 34-37: Wind information by month for East direction.
Line 34 - Percentage of time wind from E (by month)
Line 35 - Average E wind velocity (m/s) (by month)
Line 36 - Standard deviation of E winds (m/s) (by month)
Line 37 - Skew coefficient of E wind data (by month)
% E 2.89 4.34 5.78 5.25 5.50 3.90 4.00 4.08 4.57 3.62 2.26 2.81
MEAN 4.27 4.49 5.06 4.78 3.88 3.33 2.75 2.61 2.83 2.89 3.24 4.22
STD DEV 1.59 2.00 2.18 1.98 1.60 1.48 1.18 1.12 1.24 1.28 1.37 1.75
SKEW 0.15 0.48 0.42 0.31 0.26 0.52 0.61 0.77 0.74 0.45 0.19 0.42
Lines 38-41: Wind information by month for East-South-East direction.
Line 38 - Percentage of time wind from ESE (by month)
Line 39 - Average ESE wind velocity (m/s) (by month)
Line 40 - Standard deviation of ESE winds (m/s) (by month)
Line 41 - Skew coefficient of ESE wind data (by month)
% ESE 3.86 3.73 4.24 4.78 4.26 2.89 2.85 2.94 3.67 3.71 2.22 3.56
MEAN 4.30 4.49 5.01 4.82 4.03 3.52 2.90 2.92 3.09 3.29 3.65 4.31
STD DEV 1.56 1.74 1.99 1.96 1.59 1.41 1.17 1.24 1.22 1.37 1.39 1.46
SKEW 0.34 0.35 0.40 0.37 0.42 0.39 0.42 0.46 0.49 0.84 0.78 0.42
Lines 42-45: Wind information by month for South-East direction.
Line 42 - Percentage of time wind from SE (by month)
Line 43 - Average SE wind velocity (m/s) (by month)
Line 44 - Standard deviation of SE winds (m/s) (by month)
Line 45 - Skew coefficient of SE wind data (by month)
% SE 3.79 3.58 4.03 4.30 4.58 3.80 4.36 4.13 4.65 4.12 3.10 4.28
MEAN 4.19 4.44 4.45 4.51 3.94 3.04 2.90 2.74 3.20 3.26 3.59 4.39
STD DEV 1.80 1.75 1.83 2.03 1.71 1.43 1.23 1.10 1.43 1.54 1.54 1.98
SKEW 0.83 0.44 0.48 0.62 0.64 0.73 0.66 0.62 0.70 0.93 0.38 0.69
�
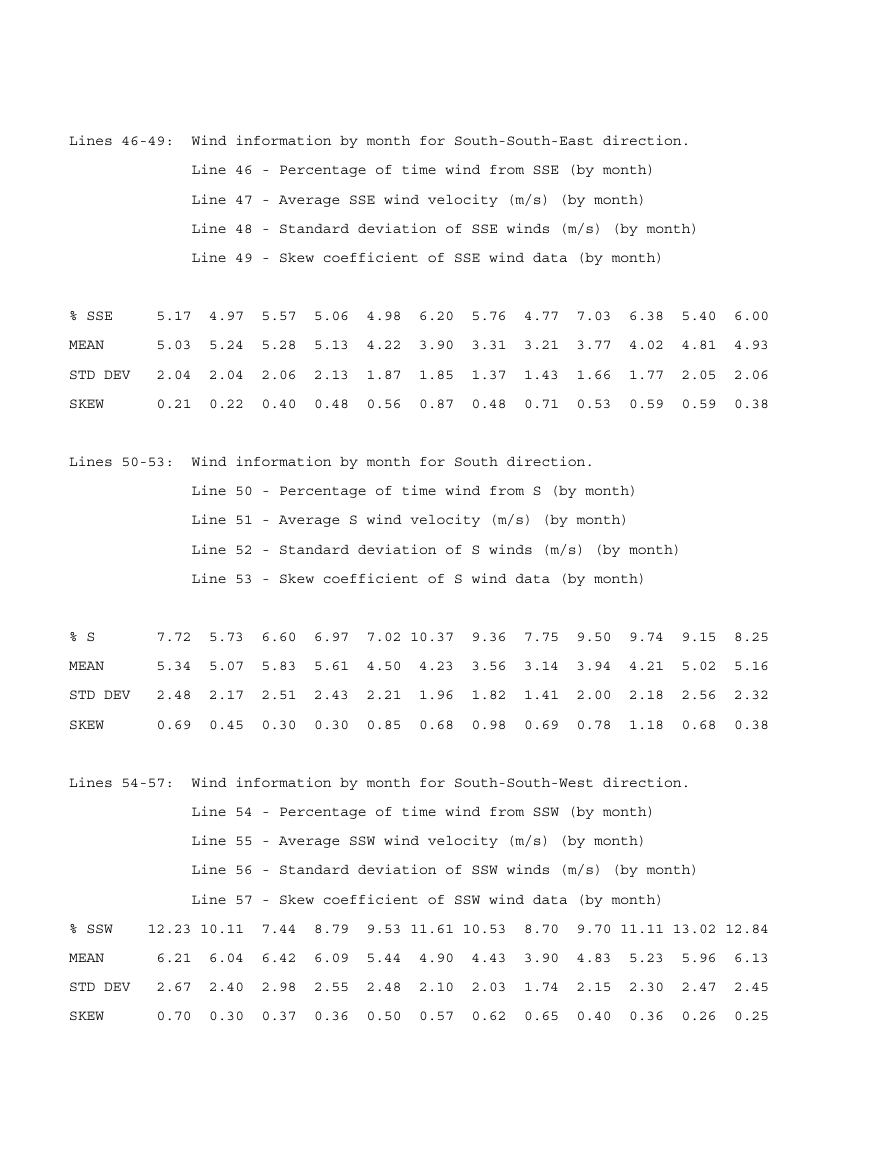
Lines 46-49: Wind information by month for South-South-East direction.
Line 46 - Percentage of time wind from SSE (by month)
Line 47 - Average SSE wind velocity (m/s) (by month)
Line 48 - Standard deviation of SSE winds (m/s) (by month)
Line 49 - Skew coefficient of SSE wind data (by month)
% SSE 5.17 4.97 5.57 5.06 4.98 6.20 5.76 4.77 7.03 6.38 5.40 6.00
MEAN 5.03 5.24 5.28 5.13 4.22 3.90 3.31 3.21 3.77 4.02 4.81 4.93
STD DEV 2.04 2.04 2.06 2.13 1.87 1.85 1.37 1.43 1.66 1.77 2.05 2.06
SKEW 0.21 0.22 0.40 0.48 0.56 0.87 0.48 0.71 0.53 0.59 0.59 0.38
Lines 50-53: Wind information by month for South direction.
Line 50 - Percentage of time wind from S (by month)
Line 51 - Average S wind velocity (m/s) (by month)
Line 52 - Standard deviation of S winds (m/s) (by month)
Line 53 - Skew coefficient of S wind data (by month)
% S 7.72 5.73 6.60 6.97 7.02 10.37 9.36 7.75 9.50 9.74 9.15 8.25
MEAN 5.34 5.07 5.83 5.61 4.50 4.23 3.56 3.14 3.94 4.21 5.02 5.16
STD DEV 2.48 2.17 2.51 2.43 2.21 1.96 1.82 1.41 2.00 2.18 2.56 2.32
SKEW 0.69 0.45 0.30 0.30 0.85 0.68 0.98 0.69 0.78 1.18 0.68 0.38
Lines 54-57: Wind information by month for South-South-West direction.
Line 54 - Percentage of time wind from SSW (by month)
Line 55 - Average SSW wind velocity (m/s) (by month)
Line 56 - Standard deviation of SSW winds (m/s) (by month)
Line 57 - Skew coefficient of SSW wind data (by month)
% SSW 12.23 10.11 7.44 8.79 9.53 11.61 10.53 8.70 9.70 11.11 13.02 12.84
MEAN 6.21 6.04 6.42 6.09 5.44 4.90 4.43 3.90 4.83 5.23 5.96 6.13
STD DEV 2.67 2.40 2.98 2.55 2.48 2.10 2.03 1.74 2.15 2.30 2.47 2.45
SKEW 0.70 0.30 0.37 0.36 0.50 0.57 0.62 0.65 0.40 0.36 0.26 0.25
�



 2023年江西萍乡中考道德与法治真题及答案.doc
 2012年重庆南川中考生物真题及答案.doc
 2013年江西师范大学地理学综合及文艺理论基础考研真题.doc
 2020年四川甘孜小升初语文真题及答案I卷.doc
 2020年注册岩土工程师专业基础考试真题及答案.doc
 2023-2024学年福建省厦门市九年级上学期数学月考试题及答案.doc
 2021-2022学年辽宁省沈阳市大东区九年级上学期语文期末试题及答案.doc
 2022-2023学年北京东城区初三第一学期物理期末试卷及答案.doc
 2018上半年江西教师资格初中地理学科知识与教学能力真题及答案.doc
 2012年河北国家公务员申论考试真题及答案-省级.doc
 2020-2021学年江苏省扬州市江都区邵樊片九年级上学期数学第一次质量检测试题及答案.doc
 2022下半年黑龙江教师资格证中学综合素质真题及答案.doc