Journal of Computer and Communications, 2018, 6, 106-118
http://www.scirp.org/journal/jcc
ISSN Online: 2327-5227
ISSN Print: 2327-5219
A New Method of Multi-Focus Image Fusion
Using Laplacian Operator and Region
Optimization
Chao Wang, Rui Yuan*, Yuqiu Sun, Yuanxiang Jiang, Changsheng Chen, Xiangliang Lin
School of Information and Mathematics, Yangtze University, Jingzhou, China
How to cite this paper: Wang, C., Yuan,
R., Sun, Y.Q., Jiang, Y.X., Chen, C.S. and
Lin, X.L. (2018) A New Method of Mul-
ti-Focus Image Fusion Using Laplacian
Operator and Region Optimization. Journal
of Computer and Communications, 6,
106-118.
https://doi.org/10.4236/jcc.2018.65009
Received: April 24, 2018
Accepted: May 27, 2108
Published: May 30, 2108
Copyright © 2018 by authors and
Scientific Research Publishing Inc.
This work is licensed under the Creative
Commons Attribution International
License (CC BY 4.0).
http://creativecommons.org/licenses/by/4.0/
Open Access
Abstract
Considering the continuous advancement in the field of imaging sensor, a
host of other new issues have emerged. A major problem is how to find focus
areas more accurately for multi-focus image fusion. The multi-focus image
fusion extracts the focused information from the source images to construct a
global in-focus image which includes more information than any of the source
images. In this paper, a novel multi-focus image fusion based on Laplacian
operator and region optimization is proposed. The evaluation of image sa-
liency based on Laplacian operator can easily distinguish the focus region and
out of focus region. And the decision map obtained by Laplacian operator
processing has less the residual information than other methods. For getting
precise decision map, focus area and edge optimization based on regional
connectivity and edge detection have been taken. Finally, the original images
are fused through the decision map. Experimental results indicate that the
proposed algorithm outperforms the other series of algorithms in terms of
both subjective and objective evaluations.
Keywords
Image Fusion, Laplacian Operator, Multi-Focus, Region Optimization
1. Introduction
Image fusion is one of the most important techniques used to extract and inte-
grate as much information as possible for image analysis, such as surveillance,
target tracking, target detection and face recognition [1] [2]. Image fusion is of-
ten applied to multi-focus image processing. Due to the limited focus range of
the optical lens, the optical lens will blur the object outside the focused region in
DOI: 10.4236/jcc.2018.65009 May 30, 2018
106
Journal of Computer and Communications
�
C. Wang et al.
the process of optical imaging [3]. To get the full focus image, multi-focus image
fusion is an effective technique to solve this problem. Multi-focus image fusion
is to integrate the focus area from images with different depth focus. So far,
many multi-focus image fusion algorithms have been proposed. All methods can
be divided into two categories: spatial domain fusion and transform domain fu-
sion [4].
In the transform domain, the multi-scale decomposition is very similar to the
human visual system and computer vision process from coarse to fine under-
standing of things, and no block effect in the fusion process [5]. In multi-focus
image fusion algorithm and the image fusion field, they are considered by re-
searchers. This class of algorithms is more widely in current research. At
present, the research on multiscale image fusion methods is mainly focused on
the image multiscale analysis tools and the fusion rules. In recent years, re-
searchers have proposed many tools for multiscale analysis of images, including
pyramid transform, wavelet transform and other multiscale geometric analysis
methods.
The method based on spatial domain mainly deals with the image fusion ac-
cording to the spatial feature information of image pixels [6]. As a single pixel
cannot represent the image space feature information, the block method is gen-
erally used. This method has a better effect on the area rich image. However, the
processing of the flat area is likely to cause misjudgment, the size of the block is
difficult to select, and the image edge will appear discontinuous small pieces, re-
sulting in serious block effect. In view of the shortcomings of the image fusion
algorithm based on block segmentation, some scholars have proposed an im-
proved scheme. Among them, V. Aslantas and R. Kurban proposed differential
evolution algorithm to determine the size of segmented image blocks, and
achieved some results [6]. To a certain extent, it solved the problem that the size
of image blocks was difficult to select. A. Goshtasby and others calculate the
corresponding blocks of the fused image by calculating the weighted sum of the
sub blocks, and introduce the weighting factors to each corresponding block in
the source image [7]; H. Hariharan et al. defined the focal connectivity of the
same focal plane, and segmented the fused source image according to the con-
nectivity [8]. In addition to the above several spatial domain fusion algorithms,
many scholars have proposed the fusion method based on the focus region de-
tection in recent years.
From a large number of literatures, one of the key problems of spatial image
fusion algorithm is how to measure the sharpness of blocks or regions or the sa-
liency level of regions. In order to solve these problems, new multi-focus image
fusion method, a spatial domain method, have been proposed based on Lapla-
cian operator and region optimization. The saliency level of regions is the main
part of the paper. The method of evaluating saliency level of image includes Te-
nengrad gradient function [9], Laplacian gradient [10] function, sum modulus
difference (SMD) [11] function, energy gradient [12] function, and so on. The
image was processed by the better method of evaluating saliency level of image,
107
Journal of Computer and Communications
DOI: 10.4236/jcc.2018.65009
�
C. Wang et al.
and then the general focusing region was obtained. Then, the focusing region is
optimized according to the focusing connectivity of the focal plane and the edge
detection. Finally, the multi-focus image fusion is finished by using the final de-
cision map.
2. Materials and Methology
2.1. Materials
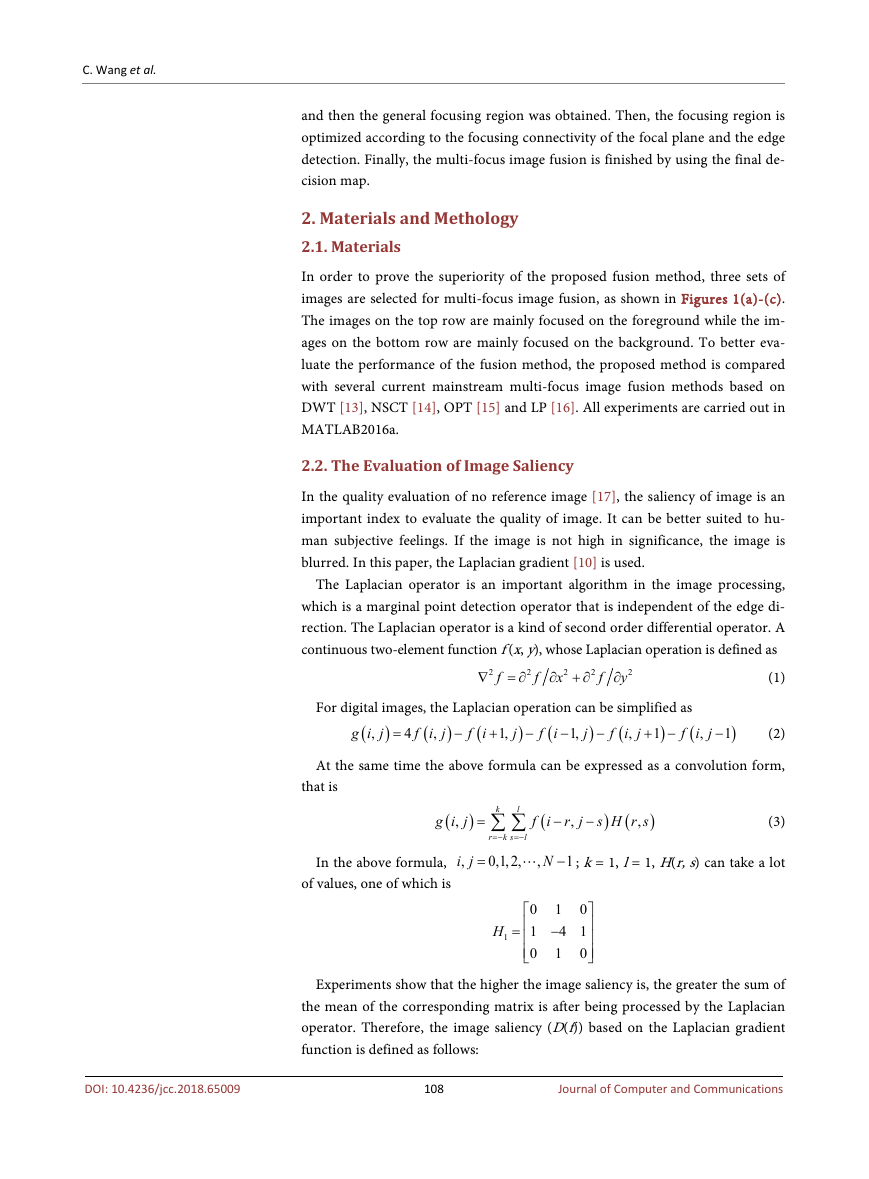
In order to prove the superiority of the proposed fusion method, three sets of
images are selected for multi-focus image fusion, as shown in Figures 1(a)-(c).
The images on the top row are mainly focused on the foreground while the im-
ages on the bottom row are mainly focused on the background. To better eva-
luate the performance of the fusion method, the proposed method is compared
with several current mainstream multi-focus image fusion methods based on
DWT [13], NSCT [14], OPT [15] and LP [16]. All experiments are carried out in
MATLAB2016a.
2.2. The Evaluation of Image Saliency
In the quality evaluation of no reference image [17], the saliency of image is an
important index to evaluate the quality of image. It can be better suited to hu-
man subjective feelings. If the image is not high in significance, the image is
blurred. In this paper, the Laplacian gradient [10] is used.
The Laplacian operator is an important algorithm in the image processing,
which is a marginal point detection operator that is independent of the edge di-
rection. The Laplacian operator is a kind of second order differential operator. A
continuous two-element function f (x, y), whose Laplacian operation is defined as
(1)
∇ = ∂
x
∂ + ∂
y
∂
f
f
f
2
2
2
2
2
For digital images, the Laplacian operation can be simplified as
(
i
)
1
+ −
(
g i
1,
1,
=
−
+
−
−
−
4
(
i
,
i
,
(
i
(
i
)
j
)
j
)
j
(
)
j
,
f
f
f
f
j
f
,
j
)
1
− (2)
At the same time the above formula can be expressed as a convolution form,
that is
(
g i
,
)
j
=
In the above formula,
of values, one of which is
i
,
j
=
l
k
∑ ∑
l
r
k s
=−
=−
0,1,2,
−
N
,
f
(
i
−
r j
,
−
)
s H r s
,
(
)
(3)
1
; k = 1, l = 1, H(r, s) can take a lot
H
1
=
0
1
0
1
0
4 1
−
0
1
Experiments show that the higher the image saliency is, the greater the sum of
the mean of the corresponding matrix is after being processed by the Laplacian
operator. Therefore, the image saliency (D(f)) based on the Laplacian gradient
function is defined as follows:
108
Journal of Computer and Communications
DOI: 10.4236/jcc.2018.65009
�
C. Wang et al.
(a) (b) (c)
Figure 1. Images for multi-focus image fusion. (a) Backgammon, the upper one is
foreground focus and the lower one is background focus; (b) Clock, the upper one is
foreground focus and the lower one is background focus; (c) Lab, the upper one is
foreground focus and the lower one is background focus.
(
(
g x y
,
)
>
T
)
(
D f
)
=
∑ ∑
y
x
(
g x y
,
)
(4)
Among them, g (x, y) is the convolution of Laplacian operators at pixel points
(x, y).
By using the value of D(f), it is easy to divide images with different clarity.
Next, it is applied to the saliency decision of different regions of images. Ac-
cording to the above, the region saliency of an image can be defined as:
(
ID i
,
)
j
=
(
D I i n i n j n j n
−
+
−
+
(
:
:
,
)
)
(5)
Among them, D is the function of saliency method based on Laplacian gra-
is
dient operator. DI is the matrix of saliency of image I. And (
the scale of processing template.
)
1
+ ×
)
1
+
n
n
2
2
(
In the multi-focus image processing, we can get significant matrices (DI1, DI2)
of different focus images, obtain a decision matrix (Mdecision) by comparing.
M
decision
=
(
D
I
1
≥
D
I
2
)
(6)
For various reasons, there are some noise and erroneous judgment in the de-
cision map. It will affect the quality of image fusion. As for erroneous judgment,
it will be mentioned later in the article.
2.3. Region Optimization
In the first obtained decision map, there are often some noise and misjudged
areas need to be corrected. In most methods, morphological processing is usual-
ly used to solve this problem. But this method often leads to the destruction of
the boundary. H. Hariharan et al. [18] defined the focusing connectivity of the
same focal plane. Most of the noise and misjudged areas can be corrected, ac-
cording to it.
109
Journal of Computer and Communications
DOI: 10.4236/jcc.2018.65009
�
C. Wang et al.
M
DF-decision
=
Delete
Larea
(
M
decision
(7)
)
As for DeleteLarea, it needs to be mentioned that its function is to delete smaller
connected areas which include most noise and misjudged areas.
At this stage, there is an important problem to be solved. The erroneous
judgment adhered to the focus edge is not removed by the above method. When
using the Laplacian method to deal with the edges of multi-focus images, there is
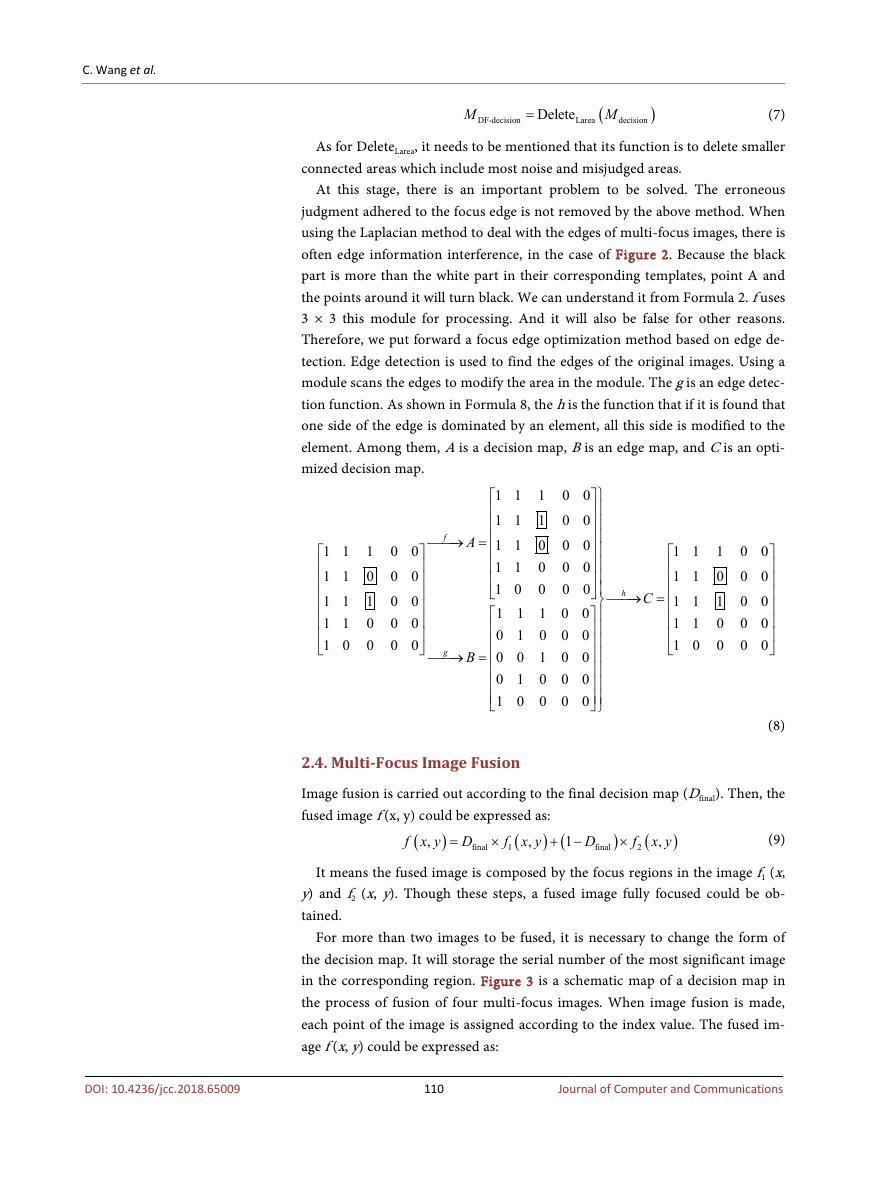
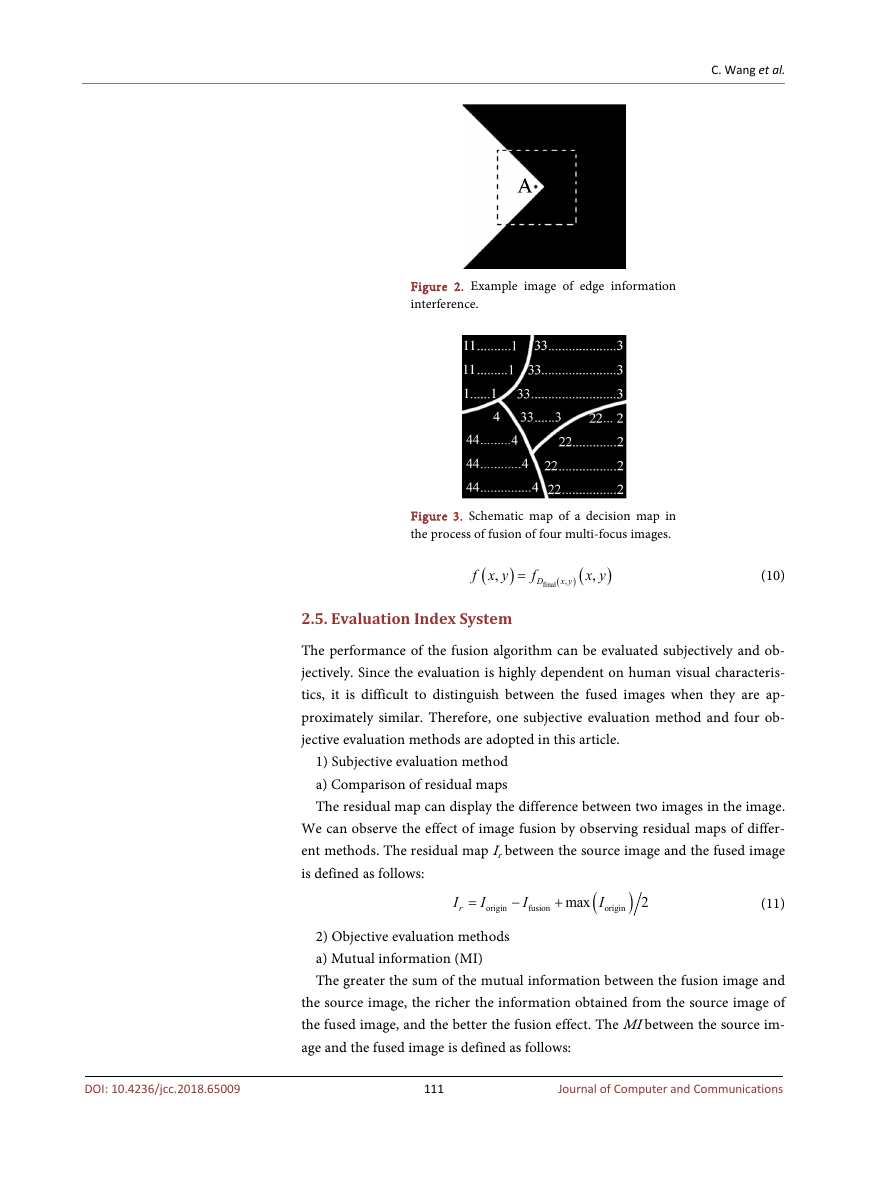
often edge information interference, in the case of Figure 2. Because the black
part is more than the white part in their corresponding templates, point A and
the points around it will turn black. We can understand it from Formula 2. f uses
3 × 3 this module for processing. And it will also be false for other reasons.
Therefore, we put forward a focus edge optimization method based on edge de-
tection. Edge detection is used to find the edges of the original images. Using a
module scans the edges to modify the area in the module. The g is an edge detec-
tion function. As shown in Formula 8, the h is the function that if it is found that
one side of the edge is dominated by an element, all this side is modified to the
element. Among them, A is a decision map, B is an edge map, and C is an opti-
mized decision map.
1 1
1 1
1 1
1 1
1 0
1
0
1
0
0
0 0
0 0
0 0
0 0
0 0
f
→ =
A
g
→ =
B
1 1
1 1
1 1
1 1
1 0
1 1
0 1
0 0
0 1
1 0
1
1
0
0
0
1
0
1
0
0
0 0
0 0
0 0
0 0
0 0
0 0
0 0
0 0
0 0
0 0
h
→ =
C
1 1
1 1
1 1
1 1
1 0
1
0
1
0
0
0 0
0 0
0 0
0 0
0 0
(8)
2.4. Multi-Focus Image Fusion
Image fusion is carried out according to the final decision map (Dfinal). Then, the
fused image f (x, y) could be expressed as:
)
(9)
(
f x y
,
(
1
+ −
x y
,
x y
,
D
)
×
D
×
)
(
f
2
)
=
final
(
f
1
final
It means the fused image is composed by the focus regions in the image f1 (x,
y) and f2 (x, y). Though these steps, a fused image fully focused could be ob-
tained.
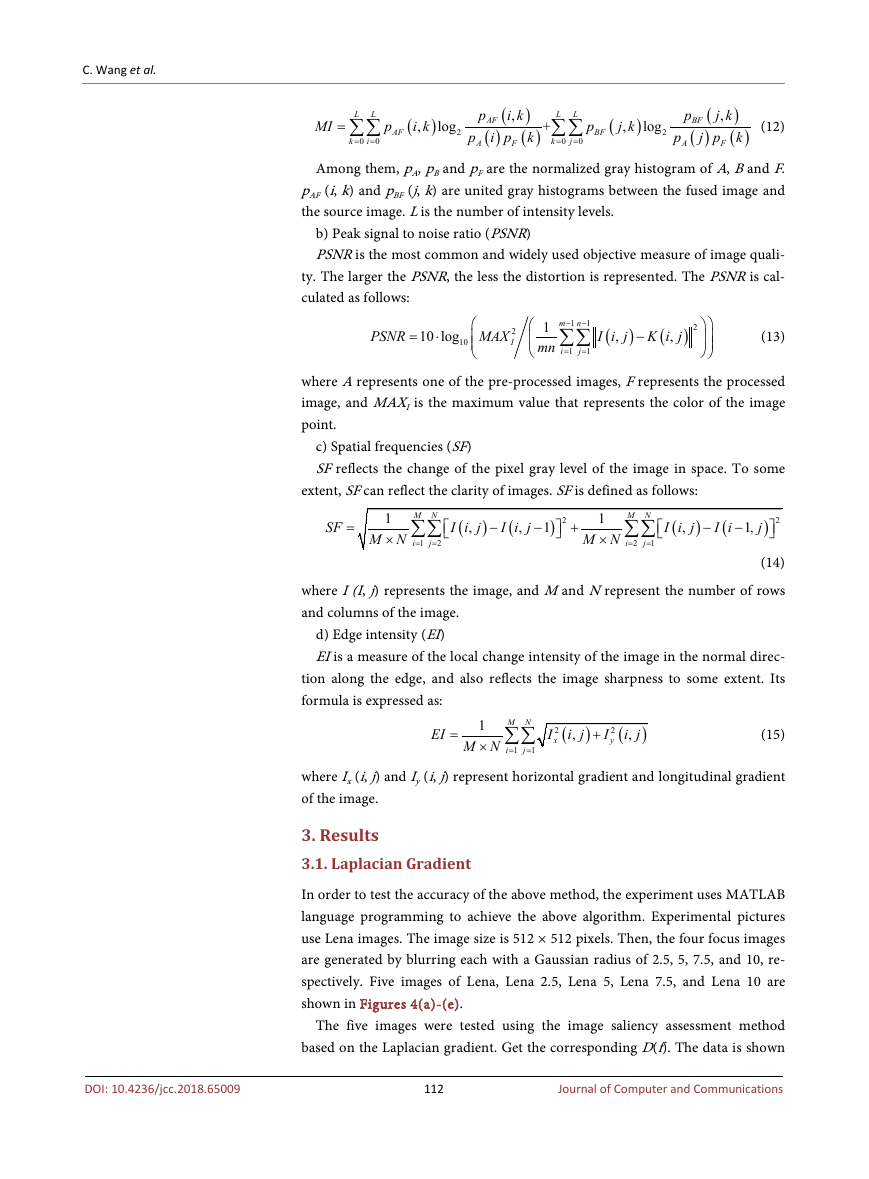
For more than two images to be fused, it is necessary to change the form of
the decision map. It will storage the serial number of the most significant image
in the corresponding region. Figure 3 is a schematic map of a decision map in
the process of fusion of four multi-focus images. When image fusion is made,
each point of the image is assigned according to the index value. The fused im-
age f (x, y) could be expressed as:
110
Journal of Computer and Communications
DOI: 10.4236/jcc.2018.65009
�
C. Wang et al.
Figure 2. Example image of edge information
interference.
Figure 3. Schematic map of a decision map in
the process of fusion of four multi-focus images.
(
f x y
,
)
=
f
D
final
(
x y
,
) (
x y
,
)
(10)
2.5. Evaluation Index System
The performance of the fusion algorithm can be evaluated subjectively and ob-
jectively. Since the evaluation is highly dependent on human visual characteris-
tics, it is difficult to distinguish between the fused images when they are ap-
proximately similar. Therefore, one subjective evaluation method and four ob-
jective evaluation methods are adopted in this article.
1) Subjective evaluation method
a) Comparison of residual maps
The residual map can display the difference between two images in the image.
We can observe the effect of image fusion by observing residual maps of differ-
ent methods. The residual map Ir between the source image and the fused image
is defined as follows:
rI
=
I
origin
−
I
fusion
+
max
(
I
origin
)
2
(11)
2) Objective evaluation methods
a) Mutual information (MI)
The greater the sum of the mutual information between the fusion image and
the source image, the richer the information obtained from the source image of
the fused image, and the better the fusion effect. The MI between the source im-
age and the fused image is defined as follows:
111
Journal of Computer and Communications
DOI: 10.4236/jcc.2018.65009
�
C. Wang et al.
MI
p
AF
(
i k
,
)
log
2
p
(
p
AF
( )
i p
)
i k
,
(
k
F
A
+
)
L
L
∑ ∑
k
=
0
j
=
0
p
BF
(
j k
,
)
log
2
p
)
(
j k
p
,
BF
( )
(
k
j p
F
A
(12)
)
L
L
= ∑∑
k
=
0
i
=
0
Among them, pA, pB and pF are the normalized gray histogram of A, B and F.
pAF (i, k) and pBF (j, k) are united gray histograms between the fused image and
the source image. L is the number of intensity levels.
b) Peak signal to noise ratio (PSNR)
PSNR is the most common and widely used objective measure of image quali-
ty. The larger the PSNR, the less the distortion is represented. The PSNR is cal-
culated as follows:
PSNR
=
10 log
10
⋅
MAX
2
I
1
mn
1
−
m n
1
−
∑∑
i
1
=
j
1
=
(
I i
,
)
j
−
(
K i
,
)
j
2
(13)
where A represents one of the pre-processed images, F represents the processed
image, and MAXI is the maximum value that represents the color of the image
point.
c) Spatial frequencies (SF)
SF reflects the change of the pixel gray level of the image in space. To some
extent, SF can reflect the clarity of images. SF is defined as follows:
SF
=
1
×
M N
M N
∑∑
i
1
=
j
=
2
(
I i
,
)
j
−
(
I i
,
−
)
1
j
2
+
1
×
M N
M N
∑∑
i
=
2
j
1
=
(
I i
,
)
j
−
(
I i
−
1,
2
j
)
(14)
where I (I, j) represents the image, and M and N represent the number of rows
and columns of the image.
d) Edge intensity (EI)
EI is a measure of the local change intensity of the image in the normal direc-
tion along the edge, and also reflects the image sharpness to some extent. Its
formula is expressed as:
EI
=
M N
1
× ∑∑
M N =
i
1
1
=
j
I
2
x
(
i
,
)
j
+
I
2
y
(
i
,
)
j
(15)
where Ix (i, j) and Iy (i, j) represent horizontal gradient and longitudinal gradient
of the image.
3. Results
3.1. Laplacian Gradient
In order to test the accuracy of the above method, the experiment uses MATLAB
language programming to achieve the above algorithm. Experimental pictures
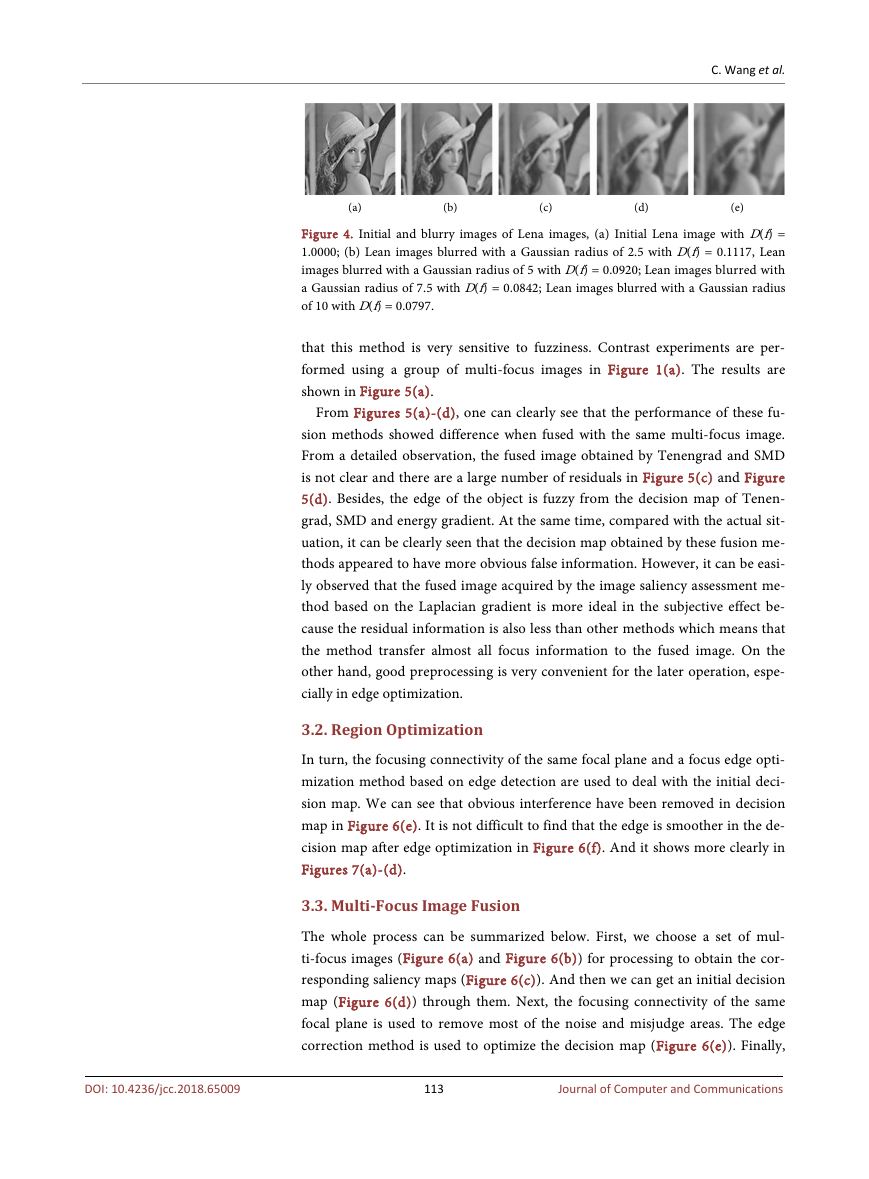
use Lena images. The image size is 512 × 512 pixels. Then, the four focus images
are generated by blurring each with a Gaussian radius of 2.5, 5, 7.5, and 10, re-
spectively. Five images of Lena, Lena 2.5, Lena 5, Lena 7.5, and Lena 10 are
shown in Figures 4(a)-(e).
The five images were tested using the image saliency assessment method
based on the Laplacian gradient. Get the corresponding D(f). The data is shown
112
Journal of Computer and Communications
DOI: 10.4236/jcc.2018.65009
�
C. Wang et al.
(a) (b) (c) (d) (e)
Figure 4. Initial and blurry images of Lena images, (a) Initial Lena image with D(f) =
1.0000; (b) Lean images blurred with a Gaussian radius of 2.5 with D(f) = 0.1117, Lean
images blurred with a Gaussian radius of 5 with D(f) = 0.0920; Lean images blurred with
a Gaussian radius of 7.5 with D(f) = 0.0842; Lean images blurred with a Gaussian radius
of 10 with D(f) = 0.0797.
that this method is very sensitive to fuzziness. Contrast experiments are per-
formed using a group of multi-focus images in Figure 1(a). The results are
shown in Figure 5(a).
From Figures 5(a)-(d), one can clearly see that the performance of these fu-
sion methods showed difference when fused with the same multi-focus image.
From a detailed observation, the fused image obtained by Tenengrad and SMD
is not clear and there are a large number of residuals in Figure 5(c) and Figure
5(d). Besides, the edge of the object is fuzzy from the decision map of Tenen-
grad, SMD and energy gradient. At the same time, compared with the actual sit-
uation, it can be clearly seen that the decision map obtained by these fusion me-
thods appeared to have more obvious false information. However, it can be easi-
ly observed that the fused image acquired by the image saliency assessment me-
thod based on the Laplacian gradient is more ideal in the subjective effect be-
cause the residual information is also less than other methods which means that
the method transfer almost all focus information to the fused image. On the
other hand, good preprocessing is very convenient for the later operation, espe-
cially in edge optimization.
3.2. Region Optimization
In turn, the focusing connectivity of the same focal plane and a focus edge opti-
mization method based on edge detection are used to deal with the initial deci-
sion map. We can see that obvious interference have been removed in decision
map in Figure 6(e). It is not difficult to find that the edge is smoother in the de-
cision map after edge optimization in Figure 6(f). And it shows more clearly in
Figures 7(a)-(d).
3.3. Multi-Focus Image Fusion
The whole process can be summarized below. First, we choose a set of mul-
ti-focus images (Figure 6(a) and Figure 6(b)) for processing to obtain the cor-
responding saliency maps (Figure 6(c)). And then we can get an initial decision
map (Figure 6(d)) through them. Next, the focusing connectivity of the same
focal plane is used to remove most of the noise and misjudge areas. The edge
correction method is used to optimize the decision map (Figure 6(e)). Finally,
113
Journal of Computer and Communications
DOI: 10.4236/jcc.2018.65009
�


 2023年江西萍乡中考道德与法治真题及答案.doc
 2012年重庆南川中考生物真题及答案.doc
 2013年江西师范大学地理学综合及文艺理论基础考研真题.doc
 2020年四川甘孜小升初语文真题及答案I卷.doc
 2020年注册岩土工程师专业基础考试真题及答案.doc
 2023-2024学年福建省厦门市九年级上学期数学月考试题及答案.doc
 2021-2022学年辽宁省沈阳市大东区九年级上学期语文期末试题及答案.doc
 2022-2023学年北京东城区初三第一学期物理期末试卷及答案.doc
 2018上半年江西教师资格初中地理学科知识与教学能力真题及答案.doc
 2012年河北国家公务员申论考试真题及答案-省级.doc
 2020-2021学年江苏省扬州市江都区邵樊片九年级上学期数学第一次质量检测试题及答案.doc
 2022下半年黑龙江教师资格证中学综合素质真题及答案.doc