logo资料库

Exam Ref 70-779 Analyzing and V - Chris Sorensen.pdf

第1页 / 共438页
第2页 / 共438页
第3页 / 共438页
第4页 / 共438页
第5页 / 共438页
第6页 / 共438页
第7页 / 共438页
第8页 / 共438页
资料共438页,剩余部分请下载后查看
Title Page
Copyright Page
Dedication Page
Contents at a Glance
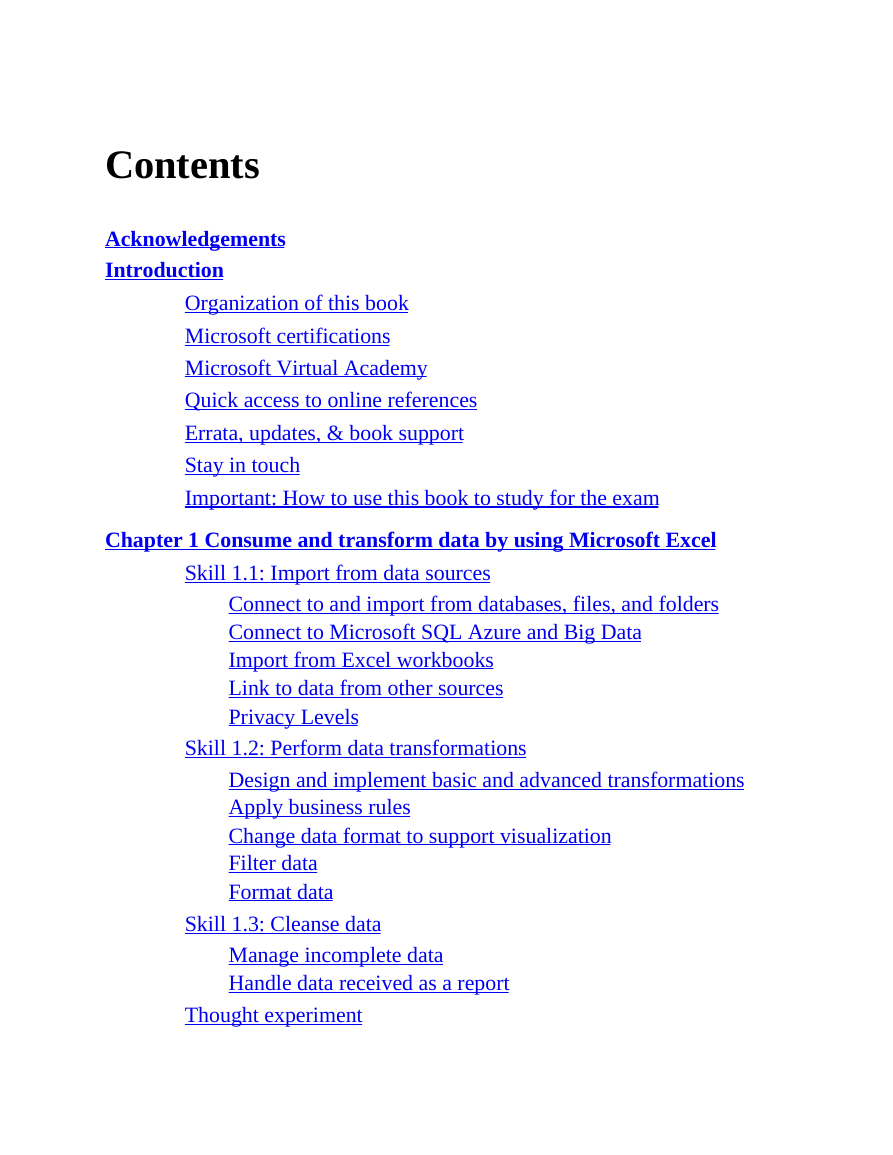
Contents
Acknowledgements
Introduction
Organization of this book
Microsoft certifications
Microsoft Virtual Academy
Quick access to online references
Errata, updates, & book support
Stay in touch
Important: How to use this book to study for the exam
Chapter 1 Consume and transform data by using Microsoft Excel
Skill 1.1: Import from data sources
Connect to and import from databases, files, and folders
Connect to Microsoft SQL Azure and Big Data
Import from Excel workbooks
Link to data from other sources
Privacy Levels
Skill 1.2: Perform data transformations
Design and implement basic and advanced transformations
Apply business rules
Change data format to support visualization
Filter data
Format data
Skill 1.3: Cleanse data
Manage incomplete data
Handle data received as a report
Thought experiment
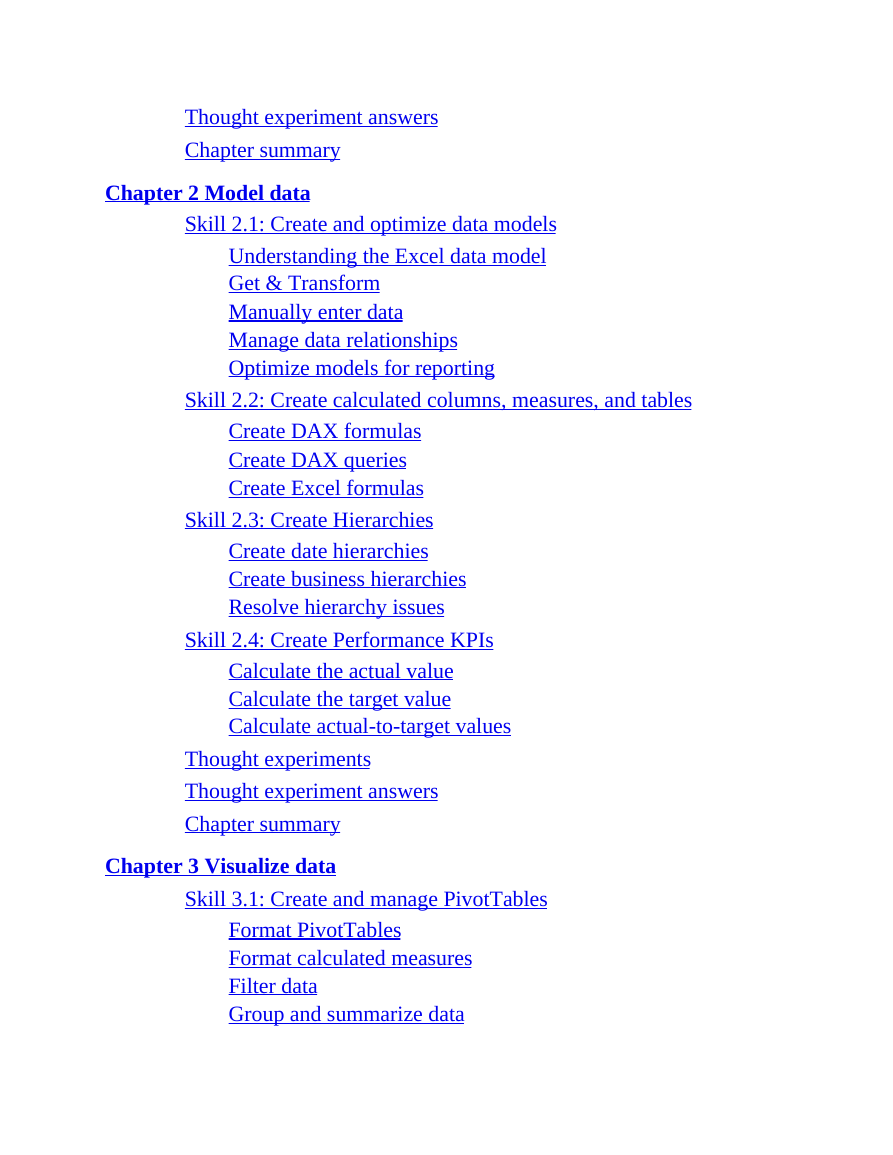
Thought experiment answers
Chapter summary
Chapter 2 Model data
Skill 2.1: Create and optimize data models
Understanding the Excel data model
Get & Transform
Manually enter data
Manage data relationships
Optimize models for reporting
Skill 2.2: Create calculated columns, measures, and tables
Create DAX formulas
Create DAX queries
Create Excel formulas
Skill 2.3: Create Hierarchies
Create date hierarchies
Create business hierarchies
Resolve hierarchy issues
Skill 2.4: Create Performance KPIs
Calculate the actual value
Calculate the target value
Calculate actual-to-target values
Thought experiments
Thought experiment answers
Chapter summary
Chapter 3 Visualize data
Skill 3.1: Create and manage PivotTables
Format PivotTables
Format calculated measures
Filter data
Group and summarize data
Skill 3.2: Create and manage PivotCharts
Select a chart type
Format PivotCharts
Filter data
Skill 3.3: Interact with Power BI
Power BI overview
Import Excel data from Power BI
Manipulate Excel data in Power BI
Thought experiment
Thought experiment answers
Chapter summary
Index
Code Snippets
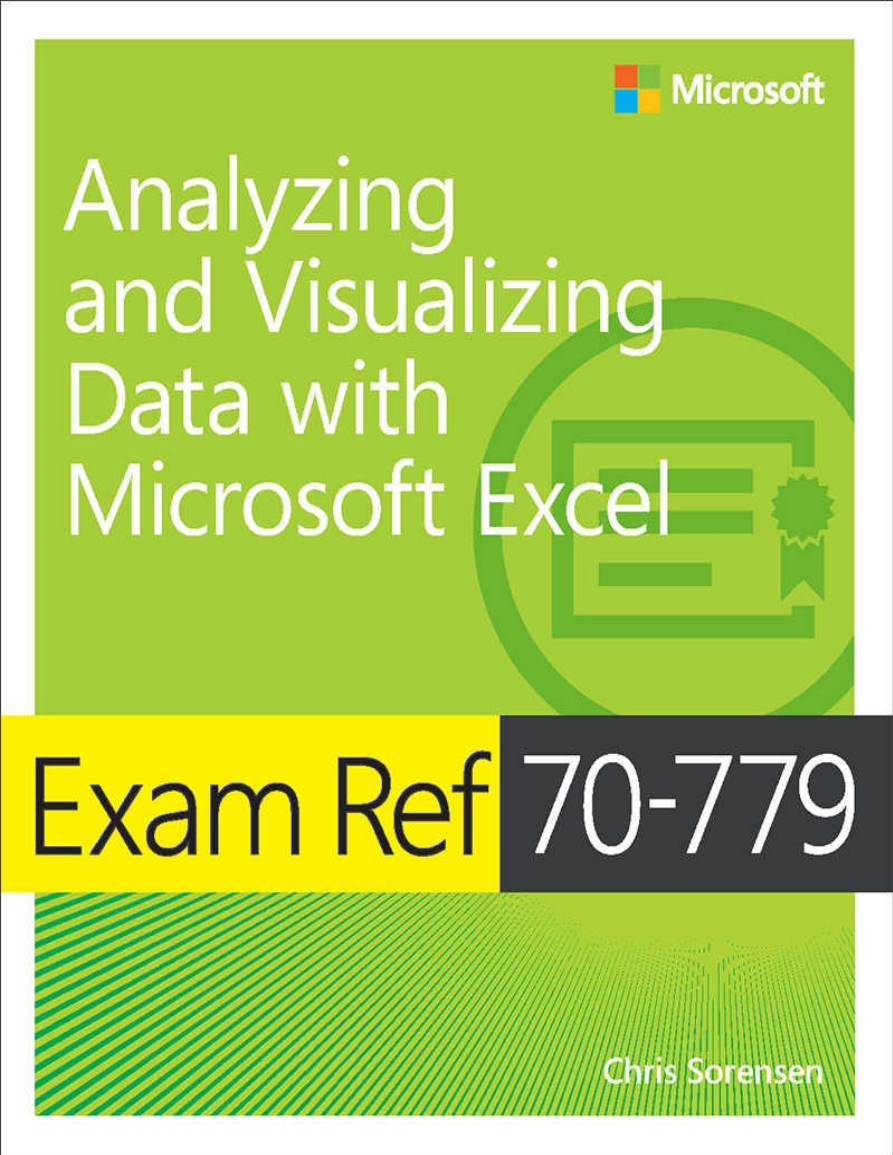
Exam Ref 70-779 Analyzing and Visualizing Data with Microsoft Excel Chris Sorensen
Exam Ref 70-779 Analyzing and Visualizing Data with Microsoft Excel Published with the authorization of Microsoft Corporation by: Pearson Education, Inc. Copyright © 2018 by Pearson Education All rights reserved. This publication is protected by copyright, and permission must be obtained from the publisher prior to any prohibited reproduction, storage in a retrieval system, or transmission in any form or by any means, electronic, mechanical, photocopying, recording, or likewise. For information regarding permissions, request forms, and the appropriate contacts within the Pearson Education Global Rights & Permissions Department, please visit www.pearsoned.com/permissions/. No patent liability is assumed with respect to the use of the information contained herein. Although every precaution has been taken in the preparation of this book, the publisher and author assume no responsibility for errors or omissions. Nor is any liability assumed for damages resulting from the use of the information contained herein. ISBN-13: 978-1-5093-0804-0 ISBN-10: 1-5093-0804-0 Library of Congress Control Number: 2018943933 1 18 Trademarks Microsoft and the trademarks listed at https://www.microsoft.com on the “Trademarks” webpage are trademarks of the Microsoft group of companies. All other marks are property of their respective owners. Warning and Disclaimer Every effort has been made to make this book as complete and as accurate as possible, but no warranty or fitness is implied. The information provided is on an “as is” basis. The authors, the publisher, and Microsoft Corporation shall have neither liability nor responsibility to any person or entity with respect to any loss or damages arising from the information contained in this book or programs accompanying it. Special Sales For information about buying this title in bulk quantities, or for special sales opportunities (which may include electronic versions; custom cover designs; and content particular to your business, training goals, marketing focus, or branding interests), please contact our corporate sales department at corpsales@pearsoned.com or (800) 382-3419. For government sales inquiries, please contact governmentsales@pearsoned.com. For questions about sales outside the U.S., please contact intlcs@pearson.com. Editor-in-Chief Brett Bartow Senior Editor Trina MacDonald
Development Editor Rick Kughen Managing Editor Sandra Schroeder Senior Project Editor Tracey Croom Editorial Production Backstop Media Copy Editor Liv Bainbridge Indexer Julie Grady Proofreader Katje Richstatter Technical Editor Daniil Maslyuk Cover Designer Twist Creative, Seattle
I dedicate this book to my wife, Joely, my daughter Camryn, and my son Murphy. Their love, support and encouragement had no bounds through what was one of the most challenging projects I have ever worked on. —CHRIS SORENSEN
Contents at a glance Acknowledgements Introduction Important: How to use this book to study for the exam CHAPTER 1 Consume and transform data by using Microsoft Excel CHAPTER 2 Model data CHAPTER 3 Visualize data Index
Contents Acknowledgements Introduction Organization of this book Microsoft certifications Microsoft Virtual Academy Quick access to online references Errata, updates, & book support Stay in touch Important: How to use this book to study for the exam Chapter 1 Consume and transform data by using Microsoft Excel Skill 1.1: Import from data sources Connect to and import from databases, files, and folders Connect to Microsoft SQL Azure and Big Data Import from Excel workbooks Link to data from other sources Privacy Levels Skill 1.2: Perform data transformations Design and implement basic and advanced transformations Apply business rules Change data format to support visualization Filter data Format data Skill 1.3: Cleanse data Manage incomplete data Handle data received as a report Thought experiment
Thought experiment answers Chapter summary Chapter 2 Model data Skill 2.1: Create and optimize data models Understanding the Excel data model Get & Transform Manually enter data Manage data relationships Optimize models for reporting Skill 2.2: Create calculated columns, measures, and tables Create DAX formulas Create DAX queries Create Excel formulas Skill 2.3: Create Hierarchies Create date hierarchies Create business hierarchies Resolve hierarchy issues Skill 2.4: Create Performance KPIs Calculate the actual value Calculate the target value Calculate actual-to-target values Thought experiments Thought experiment answers Chapter summary Chapter 3 Visualize data Skill 3.1: Create and manage PivotTables Format PivotTables Format calculated measures Filter data Group and summarize data
分享到:
收藏