What’sWhat’s NewNew
What sWhat s NewNew
May 2010
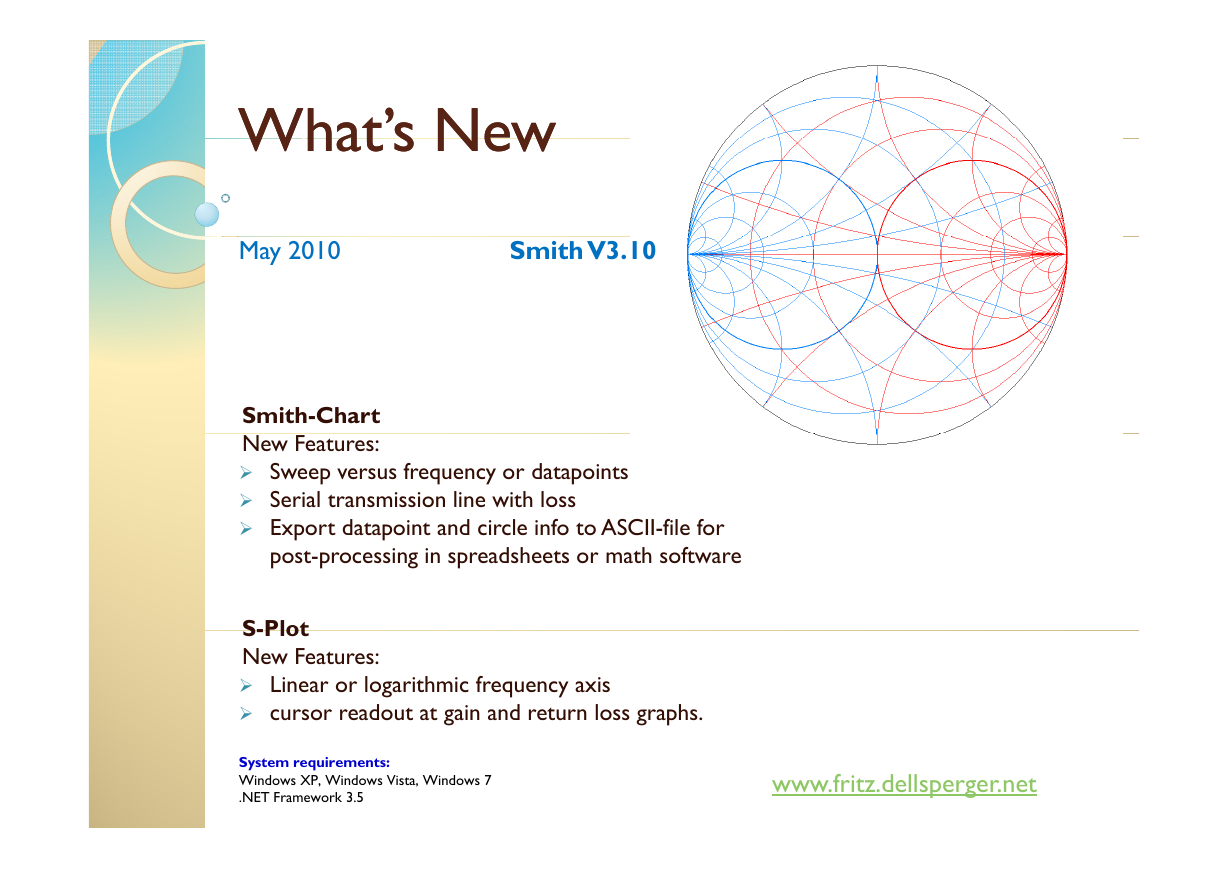
Smith V3.10
Smith-Chart
New Features:
Sweep versus frequency or datapoints
Serial transmission line with loss
Export datapoint and circle info to ASCII-file for
Export datapoint and circle info to ASCII file for
post-processing in spreadsheets or math software
S-Plot
S-Plot
New Features:
Linear or logarithmic frequency axis
cursor readout at gain and return loss graphs.
System requirements:
Windows XP, Windows Vista, Windows 7
.NET Framework 3.5
www.fritz.dellsperger.net
�
Sweeps
Sweeps
Sweeps
Sweeps
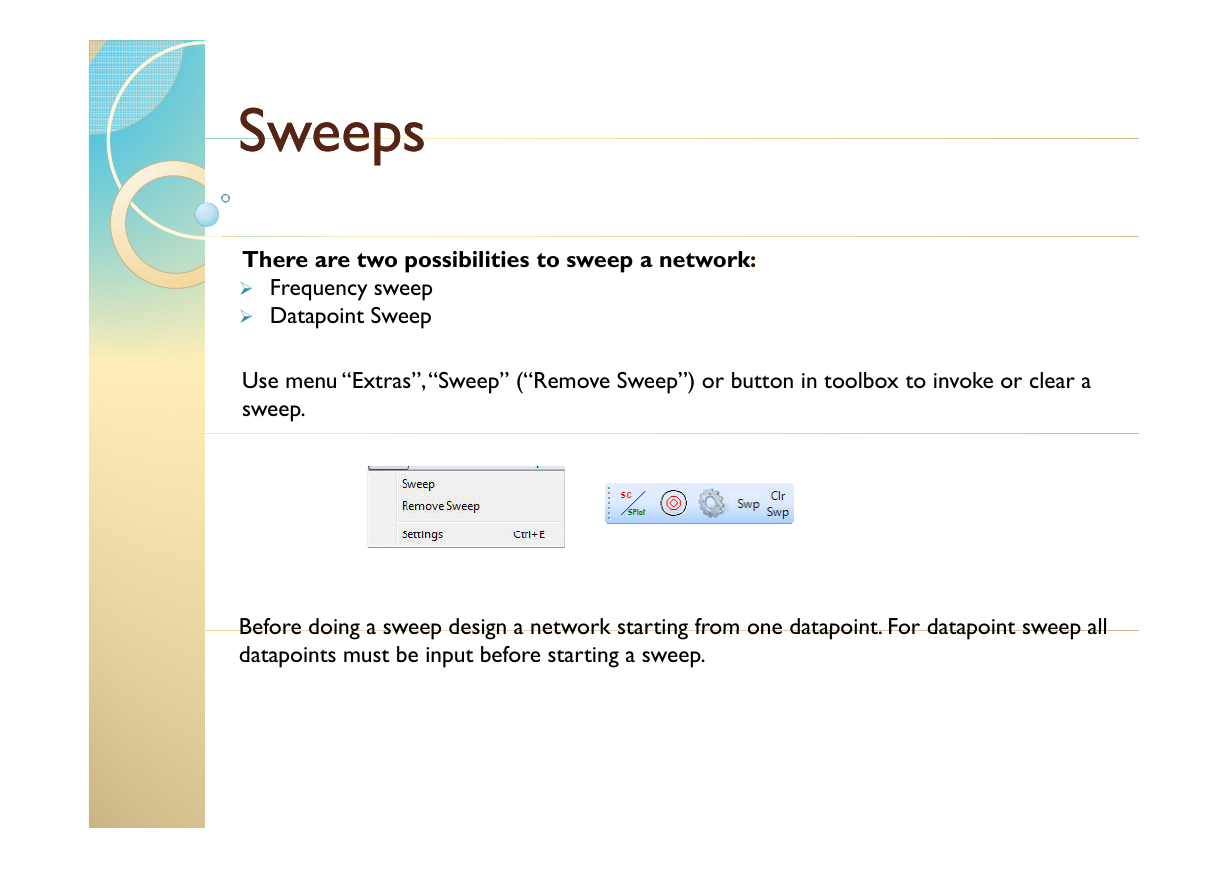
There are two possibilities to sweep a network:
Frequency sweep
Datapoint Sweep
Use menu “Extras”, “Sweep” (“Remove Sweep”) or button in toolbox to invoke or clear a
sweep.
Before doing a sweep design a network starting from one datapoint For datapoint sweep all
Before doing a sweep design a network starting from one datapoint. For datapoint sweep all
datapoints must be input before starting a sweep.
�
Frequency sweep
Frequency
Frequency
Frequency sweep
sweep
sweep
h
hi
f
Example:
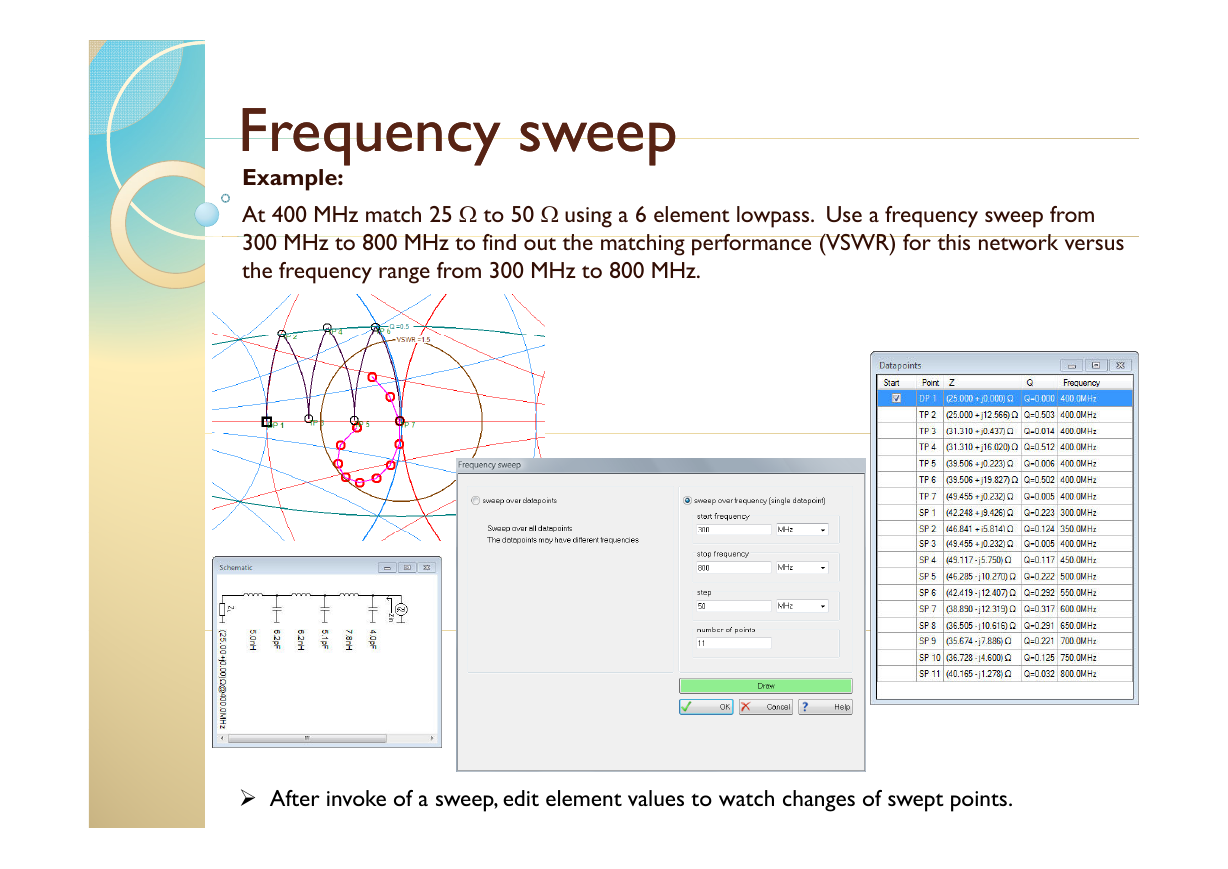
At 400 MHz match 25 to 50 using a 6 element lowpass. Use a frequency sweep from
300 MH
300 MHz to 800 MHz to find out the matching performance (VSWR) for this network versus
the frequency range from 300 MHz to 800 MHz.
800 MH
fi d
(VSWR) f
hi
k
After invoke of a sweep, edit element values to watch changes of swept points.
�
Datapoint sweep
Datapoint
Datapoint
Datapoint sweep
sweep
sweep
Example:
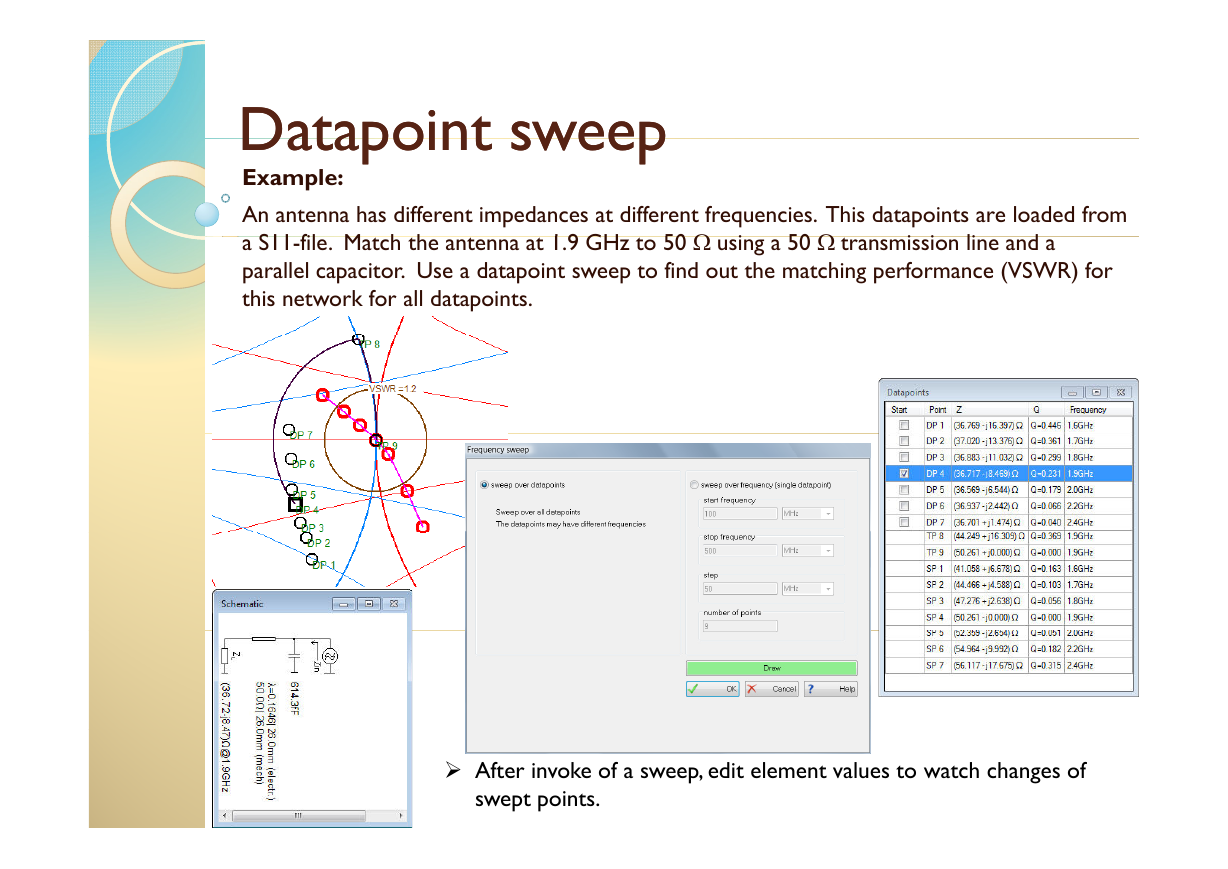
An antenna has different impedances at different frequencies. This datapoints are loaded from
a S11-file. Match the antenna at 1.9 GHz to 50 using a 50 transmission line and a
S11 fil
d
parallel capacitor. Use a datapoint sweep to find out the matching performance (VSWR) for
this network for all datapoints.
M h h
50
1 9 GH
i
i
50
i
li
After invoke of a sweep, edit element values to watch changes of
swept points.
�
Serial
Serial transmission
Serial
Serial transmission
transmission line
transmission line
line withwith loss
line withwith loss
loss
loss
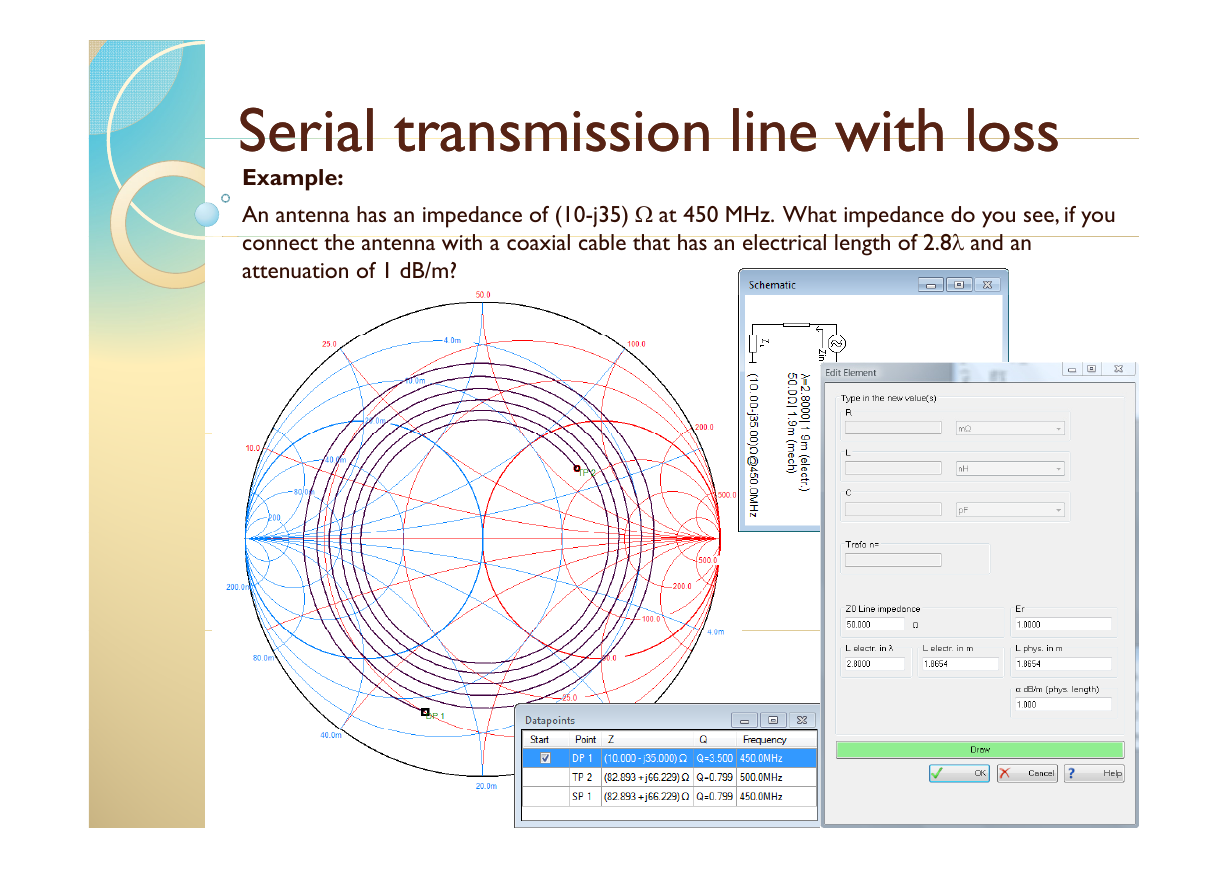
Example:
An antenna has an impedance of (10-j35) at 450 MHz. What impedance do you see, if you
connect the antenna with a coaxial cable that has an electrical length of 2.8and an
attenuation of 1 dB/m?
i l bl h h
h f 2 8 d
h
i h
l
i
l l
�
Export
Export datadata
Export
Export datadata
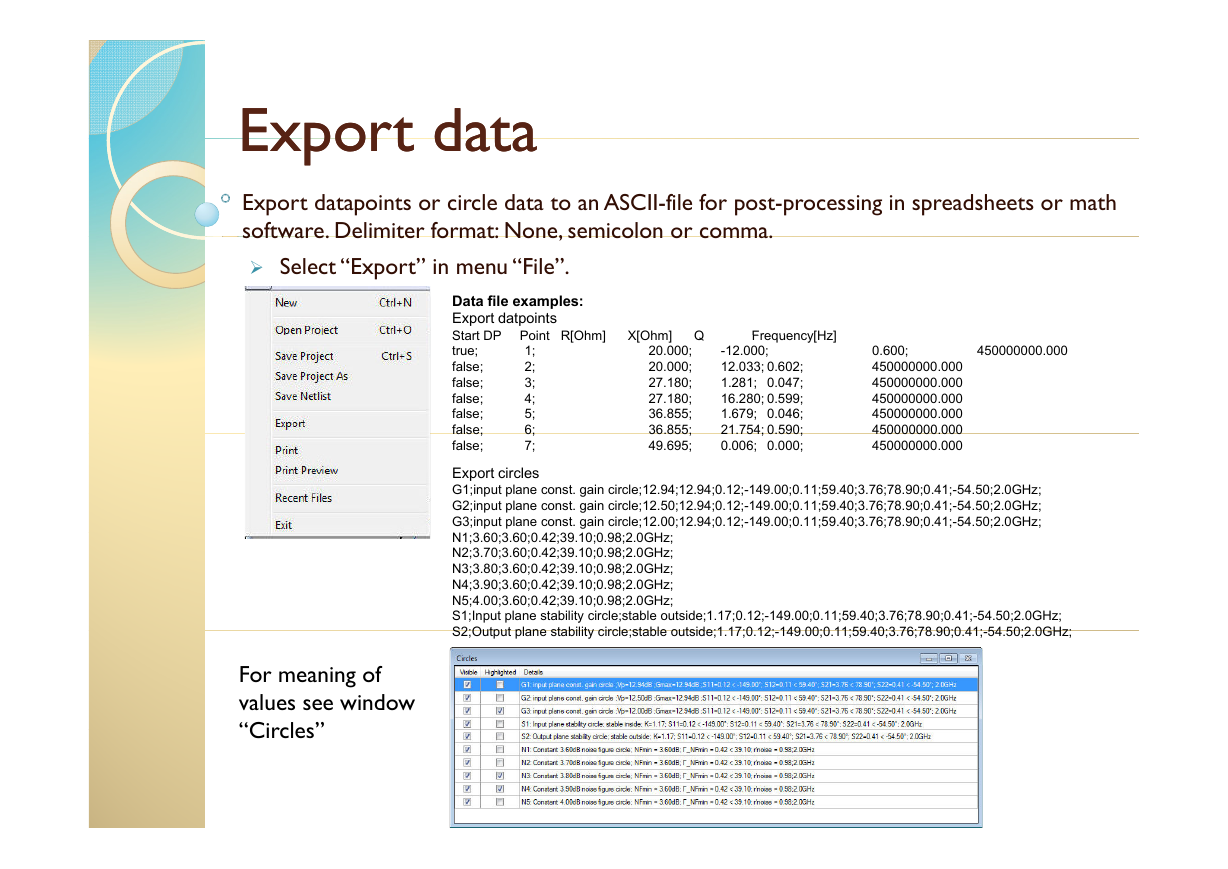
Export datapoints or circle data to an ASCII-file for post-processing in spreadsheets or math
software. Delimiter format: None, semicolon or comma.
software. Delimiter format: None, semicolon or comma.
Select “Export” in menu “File”.
Data file examples:
Export datpoints
Frequency[Hz]
Start DP Point R[Ohm] X[Ohm] Q Frequency[Hz]
Start DP
Point R[Ohm]
true;
1;
false;
2;
false;
3;
false;
4;
false;
5;
false;
false;
6;
6;
false;
7;
Export circles
G1;input plane const. gain circle;12.94;12.94;0.12;-149.00;0.11;59.40;3.76;78.90;0.41;-54.50;2.0GHz;
G2;input plane const. gain circle;12.50;12.94;0.12;-149.00;0.11;59.40;3.76;78.90;0.41;-54.50;2.0GHz;
G3;input plane const. gain circle;12.00;12.94;0.12;-149.00;0.11;59.40;3.76;78.90;0.41;-54.50;2.0GHz;
N1;3.60;3.60;0.42;39.10;0.98;2.0GHz;
N2;3.70;3.60;0.42;39.10;0.98;2.0GHz;
N3;3.80;3.60;0.42;39.10;0.98;2.0GHz;
N4;3.90;3.60;0.42;39.10;0.98;2.0GHz;
N5;4.00;3.60;0.42;39.10;0.98;2.0GHz;
S1;Input plane stability circle;stable outside;1.17;0.12;-149.00;0.11;59.40;3.76;78.90;0.41;-54.50;2.0GHz;
S2;Output plane stability circle;stable outside;1 17;0 12; 149 00;0 11;59 40;3 76;78 90;0 41; 54 50;2 0GHz;
S2;Output plane stability circle;stable outside;1.17;0.12;-149.00;0.11;59.40;3.76;78.90;0.41;-54.50;2.0GHz;
0.600;
450000000.000
450000000.000
450000000.000
450000000.000
450000000.000
450000000.000
450000000.000
-12.000;
12.033; 0.602;
1.281; 0.047;
16.280; 0.599;
1.679; 0.046;
21.754; 0.590;
21.754; 0.590;
0.006; 0.000;
450000000.000
X[Ohm]
Q
20.000;
20.000;
27.180;
27.180;
36.855;
36.855;
36.855;
49.695;
For meaning of
values see window
“Circles”
Circles
�
SS--PlotPlot
SS--PlotPlot
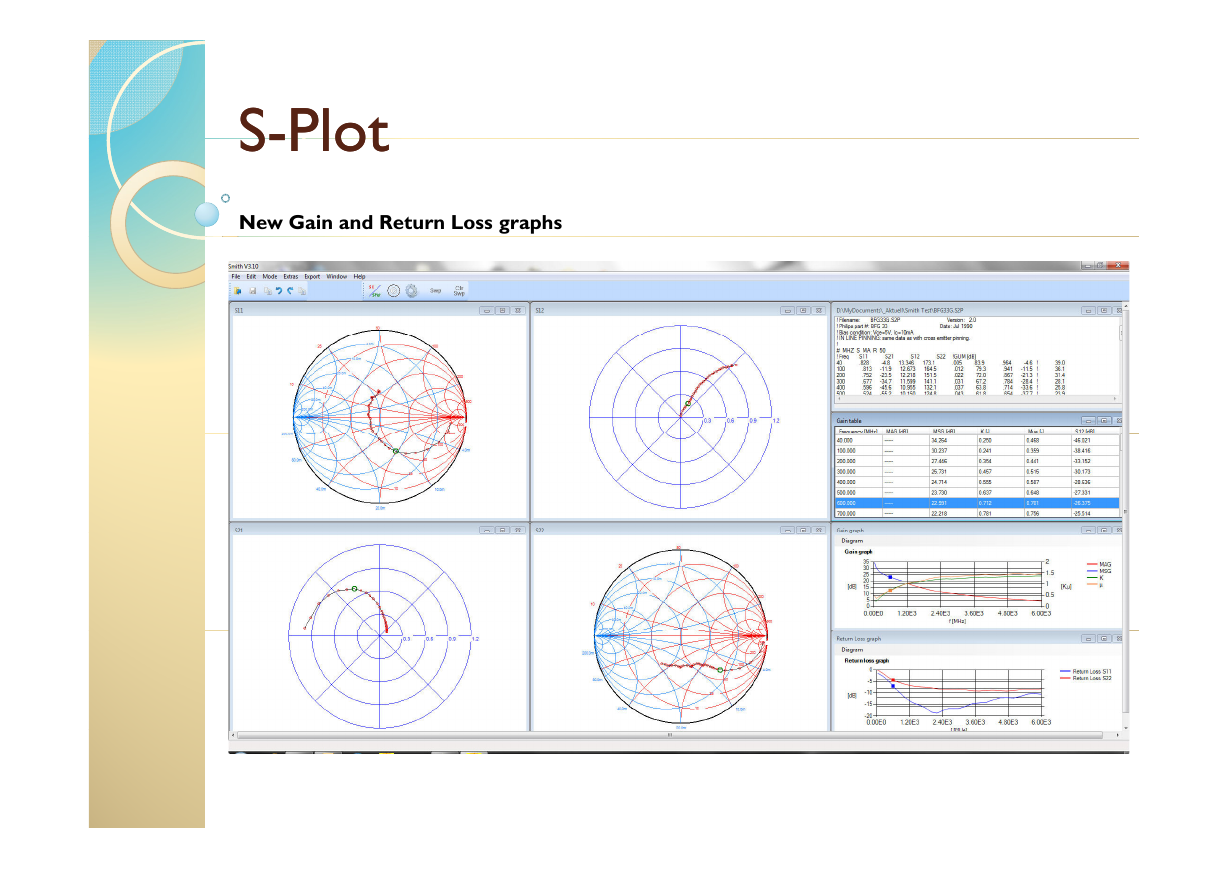
New Gain and Return Loss graphs
�
SS--PlotPlot
SS--PlotPlot
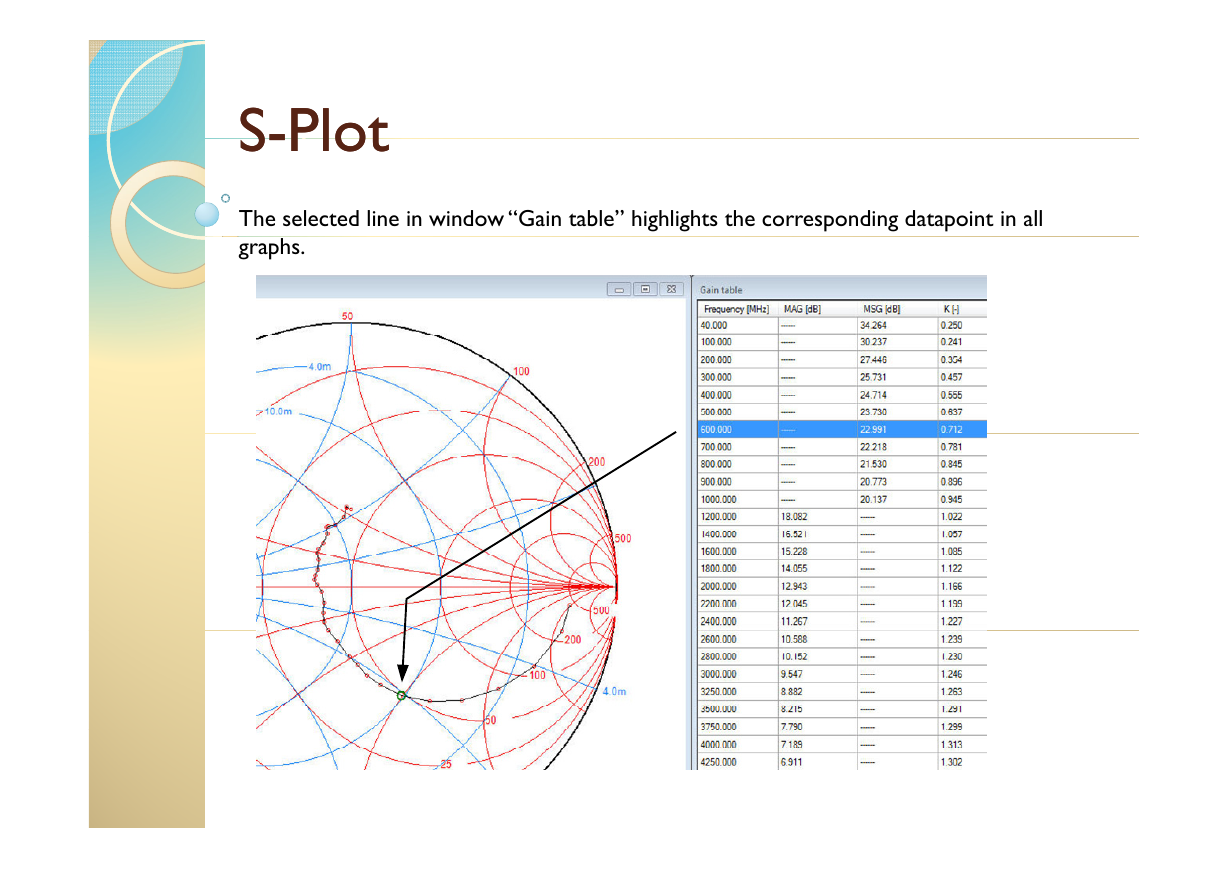
The selected line in window “Gain table” highlights the corresponding datapoint in all
graphs.
�


 2023年江西萍乡中考道德与法治真题及答案.doc
 2012年重庆南川中考生物真题及答案.doc
 2013年江西师范大学地理学综合及文艺理论基础考研真题.doc
 2020年四川甘孜小升初语文真题及答案I卷.doc
 2020年注册岩土工程师专业基础考试真题及答案.doc
 2023-2024学年福建省厦门市九年级上学期数学月考试题及答案.doc
 2021-2022学年辽宁省沈阳市大东区九年级上学期语文期末试题及答案.doc
 2022-2023学年北京东城区初三第一学期物理期末试卷及答案.doc
 2018上半年江西教师资格初中地理学科知识与教学能力真题及答案.doc
 2012年河北国家公务员申论考试真题及答案-省级.doc
 2020-2021学年江苏省扬州市江都区邵樊片九年级上学期数学第一次质量检测试题及答案.doc
 2022下半年黑龙江教师资格证中学综合素质真题及答案.doc