logo资料库

Inside Windows Debugging - Practical Debugging and Tracing Strategies 无水印pdf.pdf

第1页 / 共598页
第2页 / 共598页
第3页 / 共598页
第4页 / 共598页
第5页 / 共598页
第6页 / 共598页
第7页 / 共598页
第8页 / 共598页
资料共598页,剩余部分请下载后查看
Cover
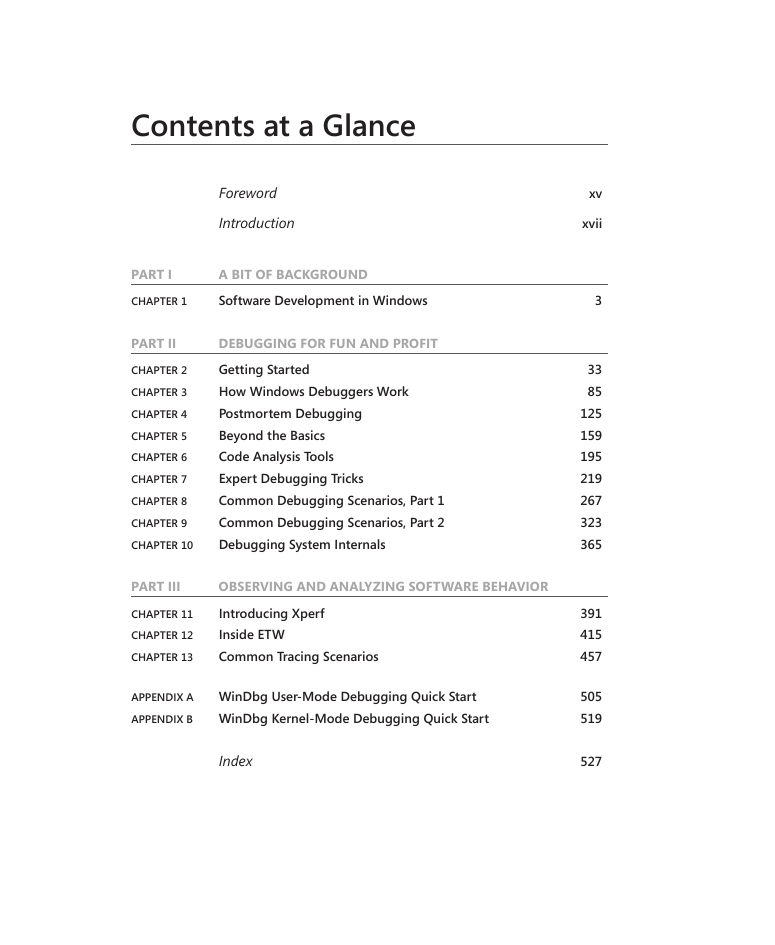
Contents at a Glance
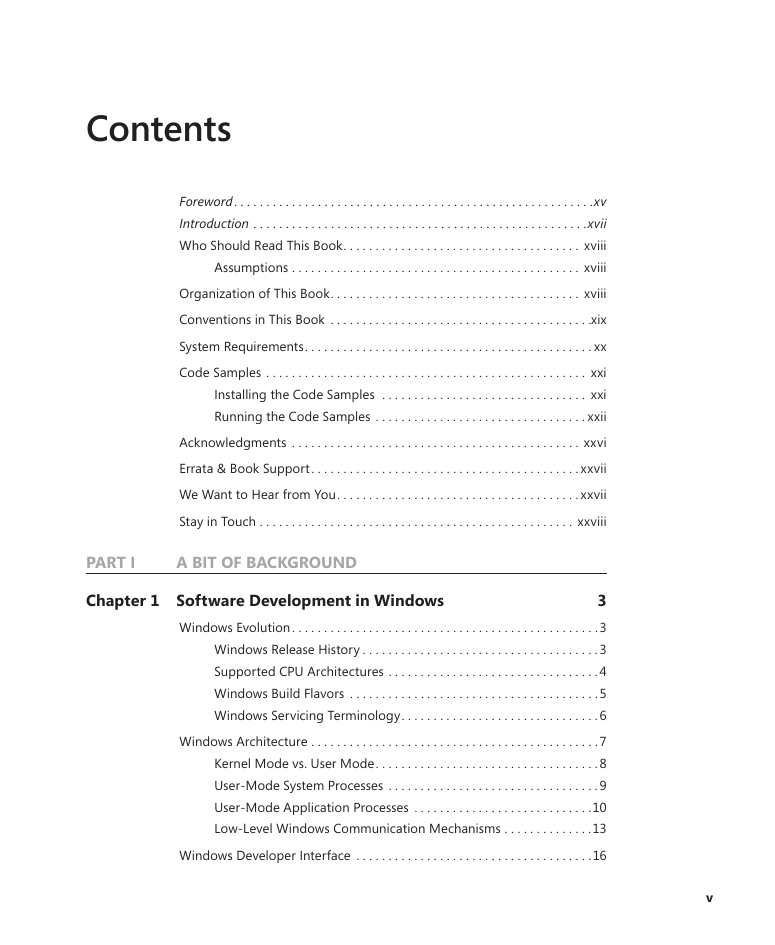
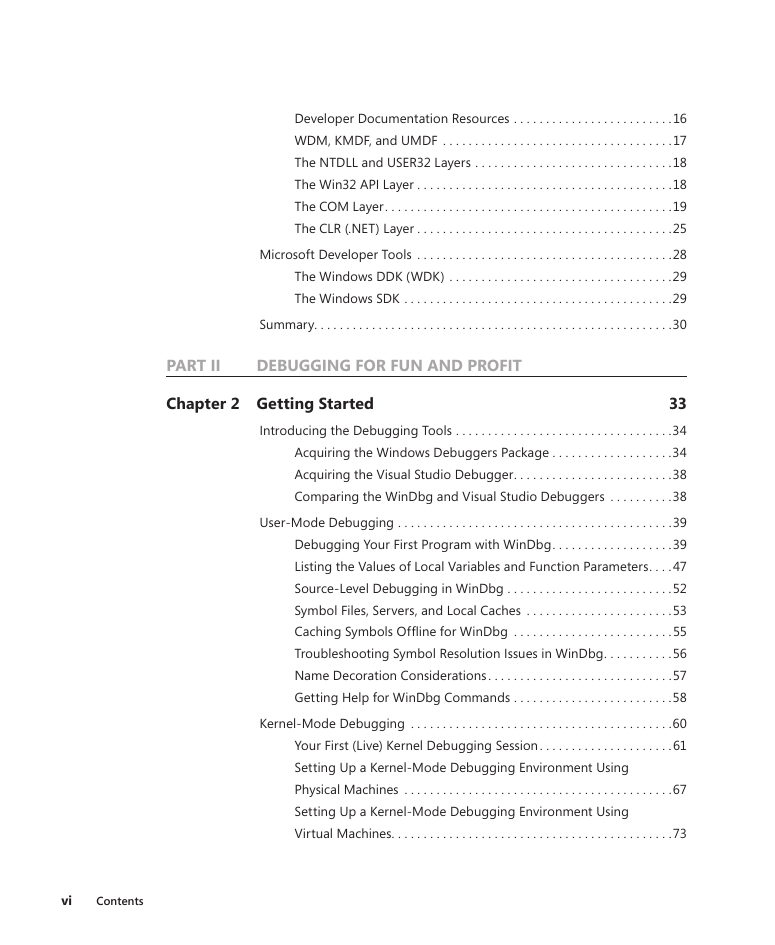
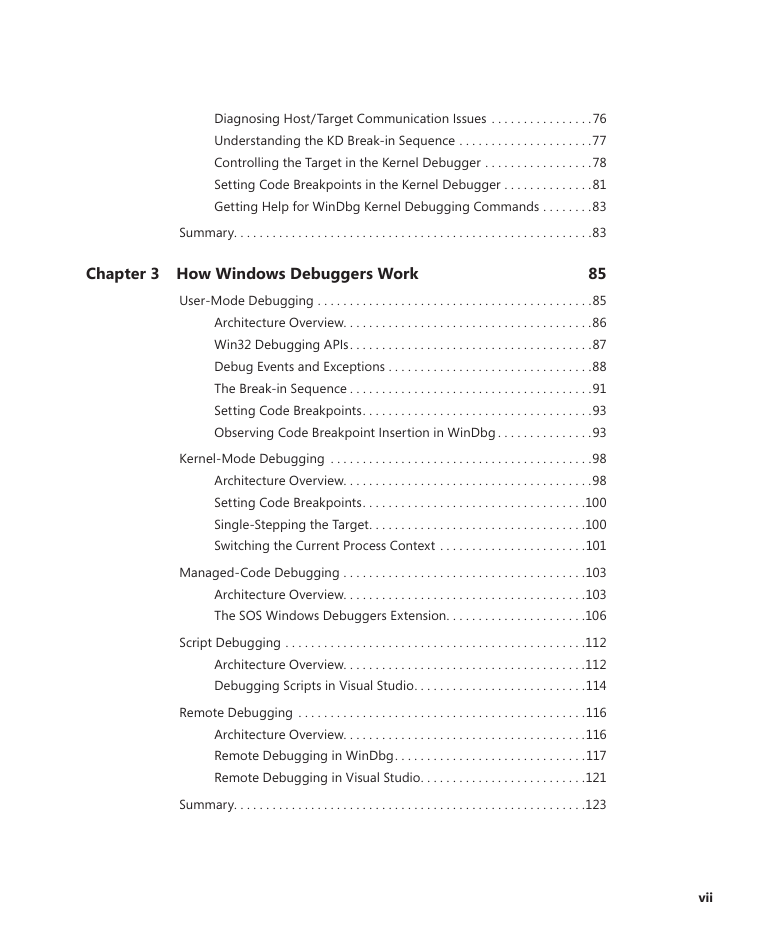
Contents
Foreword
Introduction
Who Should Read This Book
Code Samples
Acknowledgments
Errata & Book Support
We Want to Hear from You
Stay in Touch
Part 1: A Bit of Background
Chapter 1: Software Development
Windows Evolution
Windows Release History
Supported CPU Architectures
Windows Build Flavors
Windows Servicing Terminology
Windows Architecture
Kernel Mode vs. User Mode
User-Mode System Processes
User-Mode Application Processes
Low-Level Windows Communication Mechanisms
Windows Developer Interface
Developer Documentation Resources
WDM, KMDF, and UMDF
The NTDLL and USER32 Layers
The Win32 API Layer
The COM Layer
The CLR (.NET) Layer
Microsoft Developer Tools
The Windows DDK (WDK)
The Windows SDK
Summary
Part 2: Debugging for Fun and Profit
Chapter 2: Getting Started
Introducing the Debugging Tools
Acquiring the Windows Debuggers Package
Acquiring the Visual Studio Debugger
Comparing the WinDbg and Visual Studio Debuggers
User-Mode Debugging
Debugging Your First Program with WinDbg
Listing the Values of Local Variables and Function Parameters
Source-Level Debugging in WinDbg
Symbol Files, Servers, and Local Caches
Caching Symbols Offline for WinDbg
Troubleshooting Symbol Resolution Issues in WinDbg
Name Decoration Considerations
Getting Help for WinDbg Commands
Kernel-Mode Debugging
Your First (Live) Kernel Debugging Session
Setting Up a Kernel-Mode Debugging Environment Using Physical Machines
Setting Up a Kernel-Mode Debugging Environment Using Virtual Machines
Diagnosing Host/Target Communication Issues
Understanding the KD Break-in Sequence
Controlling the Target in the Kernel Debugger
Setting Code Breakpoints in the Kernel Debugger
Getting Help for WinDbg Kernel Debugging Commands
Summary
Chapter 3: How Windows Debuggers Work
User-Mode Debugging
Architecture Overview
Win32 Debugging APIs
Debug Events and Exceptions
The Break-in Sequence
Setting Code Breakpoints
Observing Code Breakpoint Insertion in WinDbg
Kernel-Mode Debugging
Architecture Overview
Setting Code Breakpoints
Single-Stepping the Target
Switching the Current Process Context
Managed-Code Debugging
Architecture Overview
The SOS Windows Debuggers Extension
Script Debugging
Architecture Overview
Debugging Scripts in Visual Studio
Remote Debugging
Architecture Overview
Remote Debugging in WinDbg
Remote Debugging in Visual Studio
Summary
Chapter 4: Postmortem Debugging
Just-in-Time Debugging
Your First JIT Debugging Experiment
How Just-in-Time Debugging Works
Using Visual Studio as Your JIT Debugger
Run-Time Assertions and JIT Debugging
JIT Debugging in Session 0
Dump Debugging
Automatic User-Mode, Crash-Dump Generation
Analyzing Crash Dumps Using the WinDbg Debugger
Analyzing Crash Dumps in Visual Studio
Manual Dump-File Generation
“Time Travel” Debugging
Kernel-Mode Postmortem Debugging
Summary
Chapter 5: Beyond the Basics
Noninvasive Debugging
Data Breakpoints
Deep Inside User-Mode and Kernel-Mode Data Breakpoints
Clearing Kernel-Mode Data Breakpoints
Execution Data Breakpoints vs. Code Breakpoints
User-Mode Debugger Data Breakpoints in Action: C++ Global Objects and the C Runtime Library
Kernel-Mode Debugger Data Breakpoints in Action: Waiting for a Process to Exit
Advanced Example: Who Is Changing a Registry Value?
Scripting the Debugger
Replaying Commands Using Debugger Scripts
Debugger Pseudo-Registers
Resolving C++ Template Names in Debugger Scripts
Scripts in Action: Listing Windows Service Processes in the Kernel Debugger
WOW64 Debugging
The WOW64 Environment
Debugging of WOW64 Processes
Windows Debugging Hooks (GFLAGS)
Systemwide vs. Process-Specific NT Global Flags
The GFLAGS Tool
The !gflag Debugger Extension Command
Impact of User-Mode Debuggers on the Value of the NT Global Flag
The Image File Execution Options Hooks
Summary
Chapter 6: Code Analysis Tools
Static Code Analysis
Catching Your First Crashing Bug Using VC++ Static Code Analysis
SAL Annotations
Other Static Analysis Tools
Runtime Code Analysis
Catching Your First Bug Using the Application Verifier Tool
A Behind-the-Scenes Look: Verifier Support in the Operating System
The !avrf Debugger Extension Command
The Application Verifier as a Quality Assurance Tool
Summary
Chapter 7: Expert Debugging Tricks
Essential Tricks
Waiting for a Debugger to Attach to the Target
Breaking on DLL Load Events
Debugging Process Startup
Debugging Child Processes
More Useful Tricks
Debugging Error-Code Failures
Breaking on First-Chance Exception Notifications
Freezing Threads
Kernel-Mode Debugging Tricks
Breaking on User-Mode Process Creation
Debugging the Startup of User-Mode Processes
Breaking on DLL Load Events
Breaking on Unhandled SEH Exceptions
Freezing Threads
Summary
Chapter 8: Common Debugging Scenarios, Part 1
Debugging Access Violations
Understanding Memory Access Violations
The !analyze Debugger Extension Command
Debugging Heap Corruptions
Debugging Native Heap Corruptions
Debugging Managed (GC) Heap Corruptions
Debugging Stack Corruptions
Stack-Based Buffer Overruns
Using Data Breakpoints in Stack Corruption Investigations
Reconstructing Call Frames from Corrupted Stacks
Debugging Stack Overflows
Understanding Stack Overflows
The kf Debugger Command
Debugging Handle Leaks
A Handle Leak Example
The !htrace Debugger Extension Command
Debugging User-Mode Memory Leaks
Detecting Resource Leaks Using the Application Verifier Tool
Investigating Memory Leaks Using the UMDH Tool
Extending the Strategy: A Custom Reference Stack-Trace Database
Debugging Kernel-Mode Memory Leaks
Kernel Memory Basics
Investigating Kernel-Mode Leaks Using Pool Tagging
Summary
Chapter 9: Common Debugging Scenarios, Part 2
Debugging Race Conditions
Shared-State Consistency Bugs
Shared-State Lifetime Management Bugs
DLL Module Lifetime-Management Bugs
Debugging Deadlocks
Lock-Ordering Deadlocks
Logical Deadlocks
Debugging Access-Check Problems
The Basic NT Security Model
Windows Vista Improvements
Wrapping Up
Summary
Chapter 10: Debugging System Internals
The Windows Console Subsystem
The Magic Behind printf
Handling of Windows UI Events
Handling of the Ctrl+C Signal
Anatomy of System Calls
The User-Mode Side of System Calls
The Transition into Kernel Mode
The Kernel-Mode Side of System Calls
Summary
Part 3: Observing and Analyzing Software Behavior
Chapter 11: Introducing Xperf
Acquiring Xperf
Your First Xperf Investigation
Devising an Investigation Strategy
Collecting an ETW Trace for the Scenario
Analyzing the Collected ETW Trace
Xperf’s Strengths and Limitations
Summary
Chapter 12: Inside ETW
ETW Architecture
ETW Design Principles
ETW Components
The Special NT Kernel Logger Session
Configuring ETW Sessions Using Xperf
Existing ETW Instrumentation in Windows
Instrumentation in the Windows Kernel
Instrumentation in Other Windows Components
Understanding ETW Stack-Walk Events
Enabling and Viewing Stack Traces for Kernel Provider Events
Enabling and Viewing Stack Traces for User Provider Events
Diagnosing ETW Stack-Trace Issues
Adding ETW Logging to Your Code
Anatomy of ETW Events
Logging Events Using the ETW Win32 APIs
Boot Tracing in ETW
Logging Kernel Provider Events During Boot
Logging User Provider Events During Boot
Summary
Chapter 13: Common Tracing Scenarios
Analyzing Blocked Time
The CSwitch and ReadyThread ETW Events
Wait Analysis Using Visual Studio 2010
Wait Analysis Using Xperf
Analyzing Memory Usage
Analyzing High-Level Memory Usage in a Target Process
Analyzing NT Heap Memory Usage
Analyzing GC Heap (.NET) Memory Usage
Tracing as a Debugging Aid
Tracing Error Code Failures
Tracing System Internals
Summary
Appendix A: WinDbg User-Mode Debugging Quick Start
Starting a User-Mode Debugging Session
Fixing the Symbols Path
Fixing the Sources Path
Displaying the Command Line of the Target Process
Control Flow Commands
Listing Loaded Modules and Their Version
Resolving Function Addresses
Setting Code (Software) Breakpoints
Setting Data (Hardware) Breakpoints
Switching Between Threads
Displaying Call Stacks
Displaying Function Parameters
Displaying Local Variables
Displaying Data Members of Native Types
Navigating Between Call Frames
Listing Function Disassembly
Displaying and Modifying Memory and Register Values
Ending a User-Mode Debugging Session
Appendix B: WinDbg Kernel-Mode Debugging Quick Start
Starting a Kernel-Mode Debugging Session
Switching Between CPU Contexts
Displaying Process Information
Displaying Thread Information
Switching Process and Thread Contexts
Listing Loaded Modules and Their Version
Setting Code (Software) Breakpoints Inside Kernel-Mode Code
Setting Code (Software) Breakpoints Inside User-Mode Code
Setting Data (Hardware) Breakpoints
Ending a Kernel-Mode Debugging Session
Index
About the Author
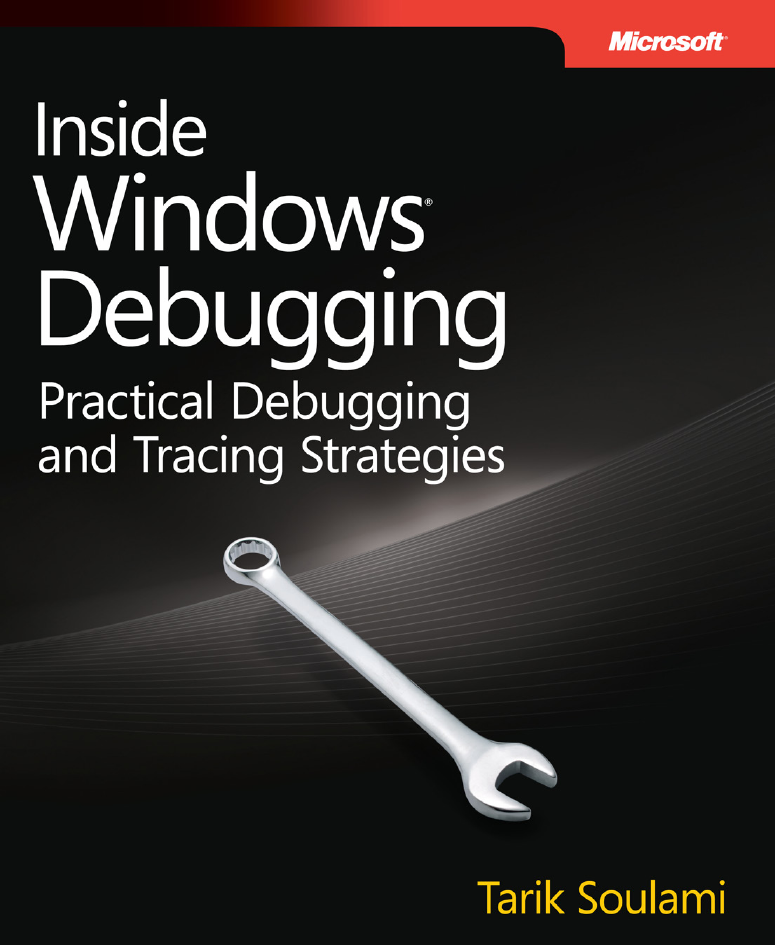
Inside Windows® Debugging Tarik Soulami
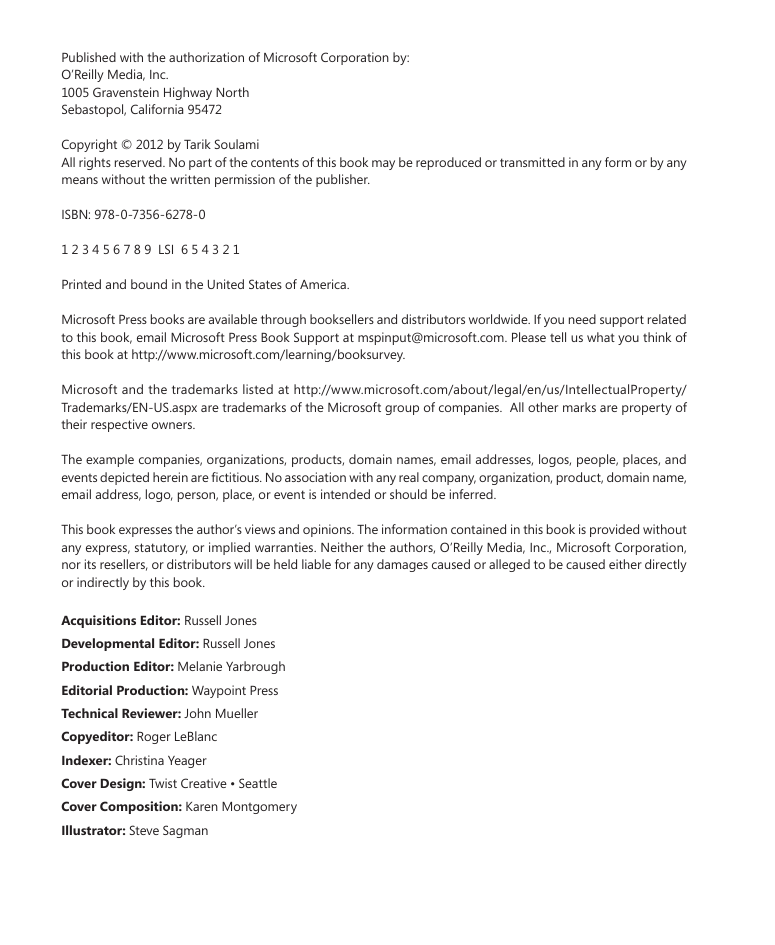
Published with the authorization of Microsoft Corporation by: O’Reilly Media, Inc. 1005 Gravenstein Highway North Sebastopol, California 95472 Copyright © 2012 by Tarik Soulami All rights reserved. No part of the contents of this book may be reproduced or transmitted in any form or by any means without the written permission of the publisher. ISBN: 978-0-7356-6278-0 1 2 3 4 5 6 7 8 9 LSI 6 5 4 3 2 1 Printed and bound in the United States of America. Microsoft Press books are available through booksellers and distributors worldwide. If you need support related to this book, email Microsoft Press Book Support at mspinput@microsoft.com. Please tell us what you think of this book at http://www.microsoft.com/learning/booksurvey. Microsoft and the trademarks listed at http://www.microsoft.com/about/legal/en/us/IntellectualProperty/ Trademarks/EN-US.aspx are trademarks of the Microsoft group of companies. All other marks are property of their respective owners. The example companies, organizations, products, domain names, email addresses, logos, people, places, and events depicted herein are fictitious. No association with any real company, organization, product, domain name, email address, logo, person, place, or event is intended or should be inferred. This book expresses the author’s views and opinions. The information contained in this book is provided without any express, statutory, or implied warranties. Neither the authors, O’Reilly Media, Inc., Microsoft Corporation, nor its resellers, or distributors will be held liable for any damages caused or alleged to be caused either directly or indirectly by this book. Acquisitions Editor: Russell Jones Developmental Editor: Russell Jones Production Editor: Melanie Yarbrough Editorial Production: Waypoint Press Technical Reviewer: John Mueller Copyeditor: Roger LeBlanc Indexer: Christina Yeager Cover Design: Twist Creative • Seattle Cover Composition: Karen Montgomery Illustrator: Steve Sagman
Contents at a Glance Foreword Introduction PART I A BIT of BACkgRounD ChapTer 1 Software Development in Windows PART II DEBuggIng foR fun AnD PRofIT ChapTer 2 ChapTer 3 ChapTer 4 ChapTer 5 ChapTer 6 ChapTer 7 ChapTer 8 ChapTer 9 ChapTer 10 Getting Started how Windows Debuggers Work postmortem Debugging Beyond the Basics Code analysis Tools expert Debugging Tricks Common Debugging Scenarios, part 1 Common Debugging Scenarios, part 2 Debugging System Internals PART III oBsERvIng AnD AnAlyzIng sofTwARE BEhAvIoR ChapTer 11 ChapTer 12 ChapTer 13 Introducing Xperf Inside eTW Common Tracing Scenarios appenDIX a WinDbg User-Mode Debugging Quick Start appenDIX B WinDbg Kernel-Mode Debugging Quick Start Index xv xvii 3 33 85 125 159 195 219 267 323 365 391 415 457 505 519 527
Contents Foreword . . . . . . . . . . . . . . . . . . . . . . . . . . . . . . . . . . . . . . . . . . . . . . . . . . . . . . . .xv Introduction . . . . . . . . . . . . . . . . . . . . . . . . . . . . . . . . . . . . . . . . . . . . . . . . . . . .xvii Who Should Read This Book . . . . . . . . . . . . . . . . . . . . . . . . . . . . . . . . . . . . . xviii Assumptions . . . . . . . . . . . . . . . . . . . . . . . . . . . . . . . . . . . . . . . . . . . . . xviii Organization of This Book . . . . . . . . . . . . . . . . . . . . . . . . . . . . . . . . . . . . . . . xviii Conventions in This Book . . . . . . . . . . . . . . . . . . . . . . . . . . . . . . . . . . . . . . . . .xix System Requirements . . . . . . . . . . . . . . . . . . . . . . . . . . . . . . . . . . . . . . . . . . . . . xx Code Samples . . . . . . . . . . . . . . . . . . . . . . . . . . . . . . . . . . . . . . . . . . . . . . . . . . xxi Installing the Code Samples . . . . . . . . . . . . . . . . . . . . . . . . . . . . . . . . xxi Running the Code Samples . . . . . . . . . . . . . . . . . . . . . . . . . . . . . . . . . xxii Acknowledgments . . . . . . . . . . . . . . . . . . . . . . . . . . . . . . . . . . . . . . . . . . . . . xxvi Errata & Book Support . . . . . . . . . . . . . . . . . . . . . . . . . . . . . . . . . . . . . . . . . . xxvii We Want to Hear from You . . . . . . . . . . . . . . . . . . . . . . . . . . . . . . . . . . . . . . xxvii Stay in Touch . . . . . . . . . . . . . . . . . . . . . . . . . . . . . . . . . . . . . . . . . . . . . . . . . xxviii PART I A BIT of BACkgRounD Chapter 1 software Development in windows 3 Windows Evolution . . . . . . . . . . . . . . . . . . . . . . . . . . . . . . . . . . . . . . . . . . . . . . . .3 Windows Release History . . . . . . . . . . . . . . . . . . . . . . . . . . . . . . . . . . . . . 3 Supported CPU Architectures . . . . . . . . . . . . . . . . . . . . . . . . . . . . . . . . . 4 Windows Build Flavors . . . . . . . . . . . . . . . . . . . . . . . . . . . . . . . . . . . . . . . 5 Windows Servicing Terminology . . . . . . . . . . . . . . . . . . . . . . . . . . . . . . . 6 Windows Architecture . . . . . . . . . . . . . . . . . . . . . . . . . . . . . . . . . . . . . . . . . . . . .7 Kernel Mode vs. User Mode . . . . . . . . . . . . . . . . . . . . . . . . . . . . . . . . . . . 8 User-Mode System Processes . . . . . . . . . . . . . . . . . . . . . . . . . . . . . . . . . 9 User-Mode Application Processes . . . . . . . . . . . . . . . . . . . . . . . . . . . .10 Low-Level Windows Communication Mechanisms . . . . . . . . . . . . . .13 Windows Developer Interface . . . . . . . . . . . . . . . . . . . . . . . . . . . . . . . . . . . . .16 v
Developer Documentation Resources . . . . . . . . . . . . . . . . . . . . . . . . .16 WDM, KMDF, and UMDF . . . . . . . . . . . . . . . . . . . . . . . . . . . . . . . . . . . .17 The NTDLL and USER32 Layers . . . . . . . . . . . . . . . . . . . . . . . . . . . . . . .18 The Win32 API Layer . . . . . . . . . . . . . . . . . . . . . . . . . . . . . . . . . . . . . . . .18 The COM Layer . . . . . . . . . . . . . . . . . . . . . . . . . . . . . . . . . . . . . . . . . . . . .19 The CLR (.NET) Layer . . . . . . . . . . . . . . . . . . . . . . . . . . . . . . . . . . . . . . . .25 Microsoft Developer Tools . . . . . . . . . . . . . . . . . . . . . . . . . . . . . . . . . . . . . . . .28 The Windows DDK (WDK) . . . . . . . . . . . . . . . . . . . . . . . . . . . . . . . . . . .29 The Windows SDK . . . . . . . . . . . . . . . . . . . . . . . . . . . . . . . . . . . . . . . . . .29 Summary. . . . . . . . . . . . . . . . . . . . . . . . . . . . . . . . . . . . . . . . . . . . . . . . . . . . . . . .30 PART II DEBuggIng foR fun AnD PRofIT Chapter 2 getting started 33 Introducing the Debugging Tools . . . . . . . . . . . . . . . . . . . . . . . . . . . . . . . . . .34 Acquiring the Windows Debuggers Package . . . . . . . . . . . . . . . . . . .34 Acquiring the Visual Studio Debugger . . . . . . . . . . . . . . . . . . . . . . . . .38 Comparing the WinDbg and Visual Studio Debuggers . . . . . . . . . .38 User-Mode Debugging . . . . . . . . . . . . . . . . . . . . . . . . . . . . . . . . . . . . . . . . . . .39 Debugging Your First Program with WinDbg . . . . . . . . . . . . . . . . . . .39 Listing the Values of Local Variables and Function Parameters . . . .47 Source-Level Debugging in WinDbg . . . . . . . . . . . . . . . . . . . . . . . . . .52 Symbol Files, Servers, and Local Caches . . . . . . . . . . . . . . . . . . . . . . .53 Caching Symbols Offline for WinDbg . . . . . . . . . . . . . . . . . . . . . . . . .55 Troubleshooting Symbol Resolution Issues in WinDbg . . . . . . . . . . .56 Name Decoration Considerations . . . . . . . . . . . . . . . . . . . . . . . . . . . . .57 Getting Help for WinDbg Commands . . . . . . . . . . . . . . . . . . . . . . . . .58 Kernel-Mode Debugging . . . . . . . . . . . . . . . . . . . . . . . . . . . . . . . . . . . . . . . . .60 Your First (Live) Kernel Debugging Session . . . . . . . . . . . . . . . . . . . . .61 Setting Up a Kernel-Mode Debugging Environment Using Physical Machines . . . . . . . . . . . . . . . . . . . . . . . . . . . . . . . . . . . . . . . . . .67 Setting Up a Kernel-Mode Debugging Environment Using Virtual Machines . . . . . . . . . . . . . . . . . . . . . . . . . . . . . . . . . . . . . . . . . . . .73 vi Contents
Diagnosing Host/Target Communication Issues . . . . . . . . . . . . . . . .76 Understanding the KD Break-in Sequence . . . . . . . . . . . . . . . . . . . . .77 Controlling the Target in the Kernel Debugger . . . . . . . . . . . . . . . . .78 Setting Code Breakpoints in the Kernel Debugger . . . . . . . . . . . . . .81 Getting Help for WinDbg Kernel Debugging Commands . . . . . . . .83 Summary. . . . . . . . . . . . . . . . . . . . . . . . . . . . . . . . . . . . . . . . . . . . . . . . . . . . . . . .83 Chapter 3 how windows Debuggers work 85 User-Mode Debugging . . . . . . . . . . . . . . . . . . . . . . . . . . . . . . . . . . . . . . . . . . .85 Architecture Overview. . . . . . . . . . . . . . . . . . . . . . . . . . . . . . . . . . . . . . .86 Win32 Debugging APIs . . . . . . . . . . . . . . . . . . . . . . . . . . . . . . . . . . . . . .87 Debug Events and Exceptions . . . . . . . . . . . . . . . . . . . . . . . . . . . . . . . .88 The Break-in Sequence . . . . . . . . . . . . . . . . . . . . . . . . . . . . . . . . . . . . . .91 Setting Code Breakpoints . . . . . . . . . . . . . . . . . . . . . . . . . . . . . . . . . . . .93 Observing Code Breakpoint Insertion in WinDbg . . . . . . . . . . . . . . .93 Kernel-Mode Debugging . . . . . . . . . . . . . . . . . . . . . . . . . . . . . . . . . . . . . . . . .98 Architecture Overview. . . . . . . . . . . . . . . . . . . . . . . . . . . . . . . . . . . . . . .98 Setting Code Breakpoints . . . . . . . . . . . . . . . . . . . . . . . . . . . . . . . . . . .100 Single-Stepping the Target . . . . . . . . . . . . . . . . . . . . . . . . . . . . . . . . . .100 Switching the Current Process Context . . . . . . . . . . . . . . . . . . . . . . .101 Managed-Code Debugging . . . . . . . . . . . . . . . . . . . . . . . . . . . . . . . . . . . . . .103 Architecture Overview. . . . . . . . . . . . . . . . . . . . . . . . . . . . . . . . . . . . . .103 The SOS Windows Debuggers Extension . . . . . . . . . . . . . . . . . . . . . .106 Script Debugging . . . . . . . . . . . . . . . . . . . . . . . . . . . . . . . . . . . . . . . . . . . . . . .112 Architecture Overview. . . . . . . . . . . . . . . . . . . . . . . . . . . . . . . . . . . . . .112 Debugging Scripts in Visual Studio . . . . . . . . . . . . . . . . . . . . . . . . . . .114 Remote Debugging . . . . . . . . . . . . . . . . . . . . . . . . . . . . . . . . . . . . . . . . . . . . .116 Architecture Overview. . . . . . . . . . . . . . . . . . . . . . . . . . . . . . . . . . . . . .116 Remote Debugging in WinDbg . . . . . . . . . . . . . . . . . . . . . . . . . . . . . .117 Remote Debugging in Visual Studio . . . . . . . . . . . . . . . . . . . . . . . . . .121 Summary. . . . . . . . . . . . . . . . . . . . . . . . . . . . . . . . . . . . . . . . . . . . . . . . . . . . . . .123 vii
分享到:
收藏