Berkshire’s Corporate Performance vs. the S&P 500
Annual Percentage Change
Year
1965 . . . . . . . . . . . . . . . . . . . . . . . . . . . . . . . . . . . . . . . . . . . . . . . . . . .
1966 . . . . . . . . . . . . . . . . . . . . . . . . . . . . . . . . . . . . . . . . . . . . . . . . . . .
1967 . . . . . . . . . . . . . . . . . . . . . . . . . . . . . . . . . . . . . . . . . . . . . . . . . . .
1968 . . . . . . . . . . . . . . . . . . . . . . . . . . . . . . . . . . . . . . . . . . . . . . . . . . .
1969 . . . . . . . . . . . . . . . . . . . . . . . . . . . . . . . . . . . . . . . . . . . . . . . . . . .
1970 . . . . . . . . . . . . . . . . . . . . . . . . . . . . . . . . . . . . . . . . . . . . . . . . . . .
1971 . . . . . . . . . . . . . . . . . . . . . . . . . . . . . . . . . . . . . . . . . . . . . . . . . . .
1972 . . . . . . . . . . . . . . . . . . . . . . . . . . . . . . . . . . . . . . . . . . . . . . . . . . .
1973 . . . . . . . . . . . . . . . . . . . . . . . . . . . . . . . . . . . . . . . . . . . . . . . . . . .
1974 . . . . . . . . . . . . . . . . . . . . . . . . . . . . . . . . . . . . . . . . . . . . . . . . . . .
1975 . . . . . . . . . . . . . . . . . . . . . . . . . . . . . . . . . . . . . . . . . . . . . . . . . . .
1976 . . . . . . . . . . . . . . . . . . . . . . . . . . . . . . . . . . . . . . . . . . . . . . . . . . .
1977 . . . . . . . . . . . . . . . . . . . . . . . . . . . . . . . . . . . . . . . . . . . . . . . . . . .
1978 . . . . . . . . . . . . . . . . . . . . . . . . . . . . . . . . . . . . . . . . . . . . . . . . . . .
1979 . . . . . . . . . . . . . . . . . . . . . . . . . . . . . . . . . . . . . . . . . . . . . . . . . . .
1980 . . . . . . . . . . . . . . . . . . . . . . . . . . . . . . . . . . . . . . . . . . . . . . . . . . .
1981 . . . . . . . . . . . . . . . . . . . . . . . . . . . . . . . . . . . . . . . . . . . . . . . . . . .
1982 . . . . . . . . . . . . . . . . . . . . . . . . . . . . . . . . . . . . . . . . . . . . . . . . . . .
1983 . . . . . . . . . . . . . . . . . . . . . . . . . . . . . . . . . . . . . . . . . . . . . . . . . . .
1984 . . . . . . . . . . . . . . . . . . . . . . . . . . . . . . . . . . . . . . . . . . . . . . . . . . .
1985 . . . . . . . . . . . . . . . . . . . . . . . . . . . . . . . . . . . . . . . . . . . . . . . . . . .
1986 . . . . . . . . . . . . . . . . . . . . . . . . . . . . . . . . . . . . . . . . . . . . . . . . . . .
1987 . . . . . . . . . . . . . . . . . . . . . . . . . . . . . . . . . . . . . . . . . . . . . . . . . . .
1988 . . . . . . . . . . . . . . . . . . . . . . . . . . . . . . . . . . . . . . . . . . . . . . . . . . .
1989 . . . . . . . . . . . . . . . . . . . . . . . . . . . . . . . . . . . . . . . . . . . . . . . . . . .
1990 . . . . . . . . . . . . . . . . . . . . . . . . . . . . . . . . . . . . . . . . . . . . . . . . . . .
1991 . . . . . . . . . . . . . . . . . . . . . . . . . . . . . . . . . . . . . . . . . . . . . . . . . . .
1992 . . . . . . . . . . . . . . . . . . . . . . . . . . . . . . . . . . . . . . . . . . . . . . . . . . .
1993 . . . . . . . . . . . . . . . . . . . . . . . . . . . . . . . . . . . . . . . . . . . . . . . . . . .
1994 . . . . . . . . . . . . . . . . . . . . . . . . . . . . . . . . . . . . . . . . . . . . . . . . . . .
1995 . . . . . . . . . . . . . . . . . . . . . . . . . . . . . . . . . . . . . . . . . . . . . . . . . . .
1996 . . . . . . . . . . . . . . . . . . . . . . . . . . . . . . . . . . . . . . . . . . . . . . . . . . .
1997 . . . . . . . . . . . . . . . . . . . . . . . . . . . . . . . . . . . . . . . . . . . . . . . . . . .
1998 . . . . . . . . . . . . . . . . . . . . . . . . . . . . . . . . . . . . . . . . . . . . . . . . . . .
1999 . . . . . . . . . . . . . . . . . . . . . . . . . . . . . . . . . . . . . . . . . . . . . . . . . . .
2000 . . . . . . . . . . . . . . . . . . . . . . . . . . . . . . . . . . . . . . . . . . . . . . . . . . .
2001 . . . . . . . . . . . . . . . . . . . . . . . . . . . . . . . . . . . . . . . . . . . . . . . . . . .
2002 . . . . . . . . . . . . . . . . . . . . . . . . . . . . . . . . . . . . . . . . . . . . . . . . . . .
2003 . . . . . . . . . . . . . . . . . . . . . . . . . . . . . . . . . . . . . . . . . . . . . . . . . . .
2004 . . . . . . . . . . . . . . . . . . . . . . . . . . . . . . . . . . . . . . . . . . . . . . . . . . .
2005 . . . . . . . . . . . . . . . . . . . . . . . . . . . . . . . . . . . . . . . . . . . . . . . . . . .
2006 . . . . . . . . . . . . . . . . . . . . . . . . . . . . . . . . . . . . . . . . . . . . . . . . . . .
2007 . . . . . . . . . . . . . . . . . . . . . . . . . . . . . . . . . . . . . . . . . . . . . . . . . . .
2008 . . . . . . . . . . . . . . . . . . . . . . . . . . . . . . . . . . . . . . . . . . . . . . . . . . .
in Per-Share
Book Value of
Berkshire
(1)
23.8
20.3
11.0
19.0
16.2
12.0
16.4
21.7
4.7
5.5
21.9
59.3
31.9
24.0
35.7
19.3
31.4
40.0
32.3
13.6
48.2
26.1
19.5
20.1
44.4
7.4
39.6
20.3
14.3
13.9
43.1
31.8
34.1
48.3
.5
6.5
(6.2)
10.0
21.0
10.5
6.4
18.4
11.0
(9.6)
in S&P 500
with Dividends
Included
(2)
10.0
(11.7)
30.9
11.0
(8.4)
3.9
14.6
18.9
(14.8)
(26.4)
37.2
23.6
(7.4)
6.4
18.2
32.3
(5.0)
21.4
22.4
6.1
31.6
18.6
5.1
16.6
31.7
(3.1)
30.5
7.6
10.1
1.3
37.6
23.0
33.4
28.6
21.0
(9.1)
(11.9)
(22.1)
28.7
10.9
4.9
15.8
5.5
(37.0)
Relative
Results
(1)-(2)
13.8
32.0
(19.9)
8.0
24.6
8.1
1.8
2.8
19.5
31.9
(15.3)
35.7
39.3
17.6
17.5
(13.0)
36.4
18.6
9.9
7.5
16.6
7.5
14.4
3.5
12.7
10.5
9.1
12.7
4.2
12.6
5.5
8.8
.7
19.7
(20.5)
15.6
5.7
32.1
(7.7)
(.4)
1.5
2.6
5.5
27.4
Compounded Annual Gain – 1965-2008 . . . . . . . . . . . . . . . . . . . . . . .
Overall Gain – 1964-2008 . . . . . . . . . . . . . . . . . . . . . . . . . . . . . . . . . .
Notes: Data are for calendar years with these exceptions: 1965 and 1966, year ended 9/30; 1967, 15 months ended
12/31.
20.3%
362,319%
8.9%
4,276%
11.4
Starting in 1979, accounting rules required insurance companies to value the equity securities they hold at market
rather than at the lower of cost or market, which was previously the requirement. In this table, Berkshire’s results
through 1978 have been restated to conform to the changed rules. In all other respects, the results are calculated using
the numbers originally reported.
The S&P 500 numbers are pre-tax whereas the Berkshire numbers are after-tax. If a corporation such as Berkshire
were simply to have owned the S&P 500 and accrued the appropriate taxes, its results would have lagged the S&P 500
in years when that index showed a positive return, but would have exceeded the S&P 500 in years when the index
showed a negative return. Over the years, the tax costs would have caused the aggregate lag to be substantial.
2
�
To the Shareholders of Berkshire Hathaway Inc.:
BERKSHIRE HATHAWAY INC.
Our decrease in net worth during 2008 was $11.5 billion, which reduced the per-share book value of
both our Class A and Class B stock by 9.6%. Over the last 44 years (that is, since present management took over)
book value has grown from $19 to $70,530, a rate of 20.3% compounded annually.*
The table on the preceding page, recording both the 44-year performance of Berkshire’s book value
and the S&P 500 index, shows that 2008 was the worst year for each. The period was devastating as well for
corporate and municipal bonds, real estate and commodities. By yearend, investors of all stripes were bloodied
and confused, much as if they were small birds that had strayed into a badminton game.
As the year progressed, a series of life-threatening problems within many of the world’s great financial
institutions was unveiled. This led to a dysfunctional credit market that in important respects soon turned
non-functional. The watchword throughout the country became the creed I saw on restaurant walls when I was
young: “In God we trust; all others pay cash.”
By the fourth quarter, the credit crisis, coupled with tumbling home and stock prices, had produced a
paralyzing fear that engulfed the country. A freefall in business activity ensued, accelerating at a pace that I have
never before witnessed. The U.S. – and much of the world – became trapped in a vicious negative-feedback
cycle. Fear led to business contraction, and that in turn led to even greater fear.
This debilitating spiral has spurred our government to take massive action. In poker terms, the Treasury
and the Fed have gone “all in.” Economic medicine that was previously meted out by the cupful has recently
been dispensed by the barrel. These once-unthinkable dosages will almost certainly bring on unwelcome
aftereffects. Their precise nature is anyone’s guess, though one likely consequence is an onslaught of inflation.
Moreover, major industries have become dependent on Federal assistance, and they will be followed by cities
and states bearing mind-boggling requests. Weaning these entities from the public teat will be a political
challenge. They won’t leave willingly.
Whatever the downsides may be, strong and immediate action by government was essential last year if
the financial system was to avoid a total breakdown. Had one occurred, the consequences for every area of our
economy would have been cataclysmic. Like it or not, the inhabitants of Wall Street, Main Street and the various
Side Streets of America were all in the same boat.
Amid this bad news, however, never forget that our country has faced far worse travails in the past. In
the 20th Century alone, we dealt with two great wars (one of which we initially appeared to be losing); a dozen or
so panics and recessions; virulent inflation that led to a 21 1⁄2% prime rate in 1980; and the Great Depression of
the 1930s, when unemployment ranged between 15% and 25% for many years. America has had no shortage of
challenges.
Without fail, however, we’ve overcome them. In the face of those obstacles – and many others – the
real standard of living for Americans improved nearly seven-fold during the 1900s, while the Dow Jones
Industrials rose from 66 to 11,497. Compare the record of this period with the dozens of centuries during which
humans secured only tiny gains, if any, in how they lived. Though the path has not been smooth, our economic
system has worked extraordinarily well over time. It has unleashed human potential as no other system has, and it
will continue to do so. America’s best days lie ahead.
*All per-share figures used in this report apply to Berkshire’s A shares. Figures for the B shares are
1/30th of those shown for A.
3
�
Take a look again at the 44-year table on page 2. In 75% of those years, the S&P stocks recorded a
gain. I would guess that a roughly similar percentage of years will be positive in the next 44. But neither Charlie
Munger, my partner in running Berkshire, nor I can predict the winning and losing years in advance. (In our
usual opinionated view, we don’t think anyone else can either.) We’re certain, for example, that the economy will
be in shambles throughout 2009 – and, for that matter, probably well beyond – but that conclusion does not tell
us whether the stock market will rise or fall.
In good years and bad, Charlie and I simply focus on four goals:
(1)
(2)
(3)
(4)
maintaining Berkshire’s Gibraltar-like financial position, which features huge amounts of
excess liquidity, near-term obligations that are modest, and dozens of sources of earnings
and cash;
widening the “moats” around our operating businesses that give them durable competitive
advantages;
acquiring and developing new and varied streams of earnings;
expanding and nurturing the cadre of outstanding operating managers who, over the years,
have delivered Berkshire exceptional results.
Berkshire in 2008
Most of the Berkshire businesses whose results are significantly affected by the economy earned below
their potential last year, and that will be true in 2009 as well. Our retailers were hit particularly hard, as were our
operations tied to residential construction. In aggregate, however, our manufacturing, service and retail
businesses earned substantial sums and most of them – particularly the larger ones – continue to strengthen their
competitive positions. Moreover, we are fortunate that Berkshire’s two most
important businesses – our
insurance and utility groups – produce earnings that are not correlated to those of the general economy. Both
businesses delivered outstanding results in 2008 and have excellent prospects.
As predicted in last year’s report, the exceptional underwriting profits that our insurance businesses
realized in 2007 were not repeated in 2008. Nevertheless, the insurance group delivered an underwriting gain for
the sixth consecutive year. This means that our $58.5 billion of insurance “float” – money that doesn’t belong to
us but that we hold and invest for our own benefit – cost us less than zero. In fact, we were paid $2.8 billion to
hold our float during 2008. Charlie and I find this enjoyable.
Over time, most insurers experience a substantial underwriting loss, which makes their economics far
different from ours. Of course, we too will experience underwriting losses in some years. But we have the best
group of managers in the insurance business, and in most cases they oversee entrenched and valuable franchises.
Considering these strengths, I believe that we will earn an underwriting profit over the years and that our float
will
is an economic
powerhouse.
therefore cost us nothing. Our insurance operation,
the core business of Berkshire,
Charlie and I are equally enthusiastic about our utility business, which had record earnings last year
and is poised for future gains. Dave Sokol and Greg Abel, the managers of this operation, have achieved results
unmatched elsewhere in the utility industry. I love it when they come up with new projects because in this
capital-intensive business these ventures are often large. Such projects offer Berkshire the opportunity to put out
substantial sums at decent returns.
4
�
Things also went well on the capital-allocation front last year. Berkshire is always a buyer of both
businesses and securities, and the disarray in markets gave us a tailwind in our purchases. When investing,
pessimism is your friend, euphoria the enemy.
In our insurance portfolios, we made three large investments on terms that would be unavailable in
normal markets. These should add about $1 1⁄2 billion pre-tax to Berkshire’s annual earnings and offer
possibilities for capital gains as well. We also closed on our Marmon acquisition (we own 64% of the company
now and will purchase its remaining stock over the next six years). Additionally, certain of our subsidiaries made
“tuck-in” acquisitions that will strengthen their competitive positions and earnings.
That’s the good news. But there’s another less pleasant reality: During 2008 I did some dumb things in
investments. I made at least one major mistake of commission and several lesser ones that also hurt. I will tell
you more about these later. Furthermore, I made some errors of omission, sucking my thumb when new facts
came in that should have caused me to re-examine my thinking and promptly take action.
Additionally, the market value of the bonds and stocks that we continue to hold suffered a significant
decline along with the general market. This does not bother Charlie and me. Indeed, we enjoy such price declines
if we have funds available to increase our positions. Long ago, Ben Graham taught me that “Price is what you
pay; value is what you get.” Whether we’re talking about socks or stocks, I like buying quality merchandise
when it is marked down.
Yardsticks
Berkshire has two major areas of value. The first
is our investments: stocks, bonds and cash
equivalents. At yearend those totaled $122 billion (not counting the investments held by our finance and utility
operations, which we assign to our second bucket of value). About $58.5 billion of that total is funded by our
insurance float.
Berkshire’s second component of value is earnings that come from sources other than investments and
insurance. These earnings are delivered by our 67 non-insurance companies, itemized on page 96. We exclude
our insurance earnings from this calculation because the value of our insurance operation comes from the
investable funds it generates, and we have already included this factor in our first bucket.
In 2008, our investments fell from $90,343 per share of Berkshire (after minority interest) to $77,793, a
decrease that was caused by a decline in market prices, not by net sales of stocks or bonds. Our second segment
of value fell from pre-tax earnings of $4,093 per Berkshire share to $3,921 (again after minority interest).
Both of these performances are unsatisfactory. Over time, we need to make decent gains in each area if
we are to increase Berkshire’s intrinsic value at an acceptable rate. Going forward, however, our focus will be on
the earnings segment, just as it has been for several decades. We like buying underpriced securities, but we like
buying fairly-priced operating businesses even more.
Now, let’s take a look at the four major operating sectors of Berkshire. Each of these has vastly
different balance sheet and income account characteristics. Therefore, lumping them together, as is done in
standard financial statements, impedes analysis. So we’ll present them as four separate businesses, which is how
Charlie and I view them.
5
�
Regulated Utility Business
Berkshire has an 87.4% (diluted) interest in MidAmerican Energy Holdings, which owns a wide
variety of utility operations. The largest of these are (1) Yorkshire Electricity and Northern Electric, whose
3.8 million end users make it the U.K.’s third largest distributor of electricity; (2) MidAmerican Energy, which
serves 723,000 electric customers, primarily in Iowa; (3) Pacific Power and Rocky Mountain Power, serving
about 1.7 million electric customers in six western states; and (4) Kern River and Northern Natural pipelines,
which carry about 9% of the natural gas consumed in the U.S.
Our partners in ownership of MidAmerican are its two terrific managers, Dave Sokol and Greg Abel,
and my long-time friend, Walter Scott. It’s unimportant how many votes each party has; we make major moves
only when we are unanimous in thinking them wise. Nine years of working with Dave, Greg and Walter have
reinforced my original belief: Berkshire couldn’t have better partners.
Somewhat incongruously, MidAmerican also owns the second largest real estate brokerage firm in the
U.S., HomeServices of America. This company operates through 21 locally-branded firms that have 16,000
agents. Last year was a terrible year for home sales, and 2009 looks no better. We will continue, however, to
acquire quality brokerage operations when they are available at sensible prices.
Here are some key figures on MidAmerican’s operations:
Earnings (in millions)
2008
2007
U.K. utilities . . . . . . . . . . . . . . . . . . . . . . . . . . . . . . . . . . . . . . . . . . . . . . . . . . . . . . . . . . . .
Iowa utility . . . . . . . . . . . . . . . . . . . . . . . . . . . . . . . . . . . . . . . . . . . . . . . . . . . . . . . . . . . . .
Western utilities . . . . . . . . . . . . . . . . . . . . . . . . . . . . . . . . . . . . . . . . . . . . . . . . . . . . . . . . .
Pipelines . . . . . . . . . . . . . . . . . . . . . . . . . . . . . . . . . . . . . . . . . . . . . . . . . . . . . . . . . . . . . . .
HomeServices . . . . . . . . . . . . . . . . . . . . . . . . . . . . . . . . . . . . . . . . . . . . . . . . . . . . . . . . . . .
Other (net) . . . . . . . . . . . . . . . . . . . . . . . . . . . . . . . . . . . . . . . . . . . . . . . . . . . . . . . . . . . . . .
Operating earnings before corporate interest and taxes . . . . . . . . . . . . . . . . . . . . . . . . . . .
Constellation Energy* . . . . . . . . . . . . . . . . . . . . . . . . . . . . . . . . . . . . . . . . . . . . . . . . . . . . .
Interest, other than to Berkshire . . . . . . . . . . . . . . . . . . . . . . . . . . . . . . . . . . . . . . . . . . . . .
Interest on Berkshire junior debt . . . . . . . . . . . . . . . . . . . . . . . . . . . . . . . . . . . . . . . . . . . . .
Income tax . . . . . . . . . . . . . . . . . . . . . . . . . . . . . . . . . . . . . . . . . . . . . . . . . . . . . . . . . . . . . .
Net earnings . . . . . . . . . . . . . . . . . . . . . . . . . . . . . . . . . . . . . . . . . . . . . . . . . . . . . . . . . . . . .
Earnings applicable to Berkshire** . . . . . . . . . . . . . . . . . . . . . . . . . . . . . . . . . . . . . . . . . .
Debt owed to others . . . . . . . . . . . . . . . . . . . . . . . . . . . . . . . . . . . . . . . . . . . . . . . . . . . . . . .
Debt owed to Berkshire . . . . . . . . . . . . . . . . . . . . . . . . . . . . . . . . . . . . . . . . . . . . . . . . . . . .
$
339
425
703
595
(45)
186
2,203
1,092
(332)
(111)
(1,002)
$ 1,850
$ 1,704
19,145
1,087
$
337
412
692
473
42
130
2,086
–
(312)
(108)
(477)
$ 1,189
$ 1,114
19,002
821
*Consists of a breakup fee of $175 million and a profit on our investment of $917 million.
**Includes interest earned by Berkshire (net of related income taxes) of $72 in 2008 and $70 in 2007.
MidAmerican’s record in operating its regulated electric utilities and natural gas pipelines is truly
outstanding. Here’s some backup for that claim.
Our two pipelines, Kern River and Northern Natural, were both acquired in 2002. A firm called Mastio
regularly ranks pipelines for customer satisfaction. Among the 44 rated, Kern River came in 9th when we
purchased it and Northern Natural ranked 39th. There was work to do.
In Mastio’s 2009 report, Kern River ranked 1st and Northern Natural 3rd. Charlie and I couldn’t be more
proud of this performance. It came about because hundreds of people at each operation committed themselves to
a new culture and then delivered on their commitment.
Achievements at our electric utilities have been equally impressive. In 1995, MidAmerican became the
major provider of electricity in Iowa. By judicious planning and a zeal for efficiency, the company has kept
electric prices unchanged since our purchase and has promised to hold them steady through 2013.
6
�
MidAmerican has maintained this extraordinary price stability while making Iowa number one among
all states in the percentage of its generation capacity that comes from wind. Since our purchase, MidAmerican’s
wind-based facilities have grown from zero to almost 20% of total capacity.
Similarly, when we purchased PacifiCorp in 2006, we moved aggressively to expand wind generation.
Wind capacity was then 33 megawatts. It’s now 794, with more coming. (Arriving at PacifiCorp, we found
“wind” of a different sort: The company had 98 committees that met frequently. Now there are 28. Meanwhile,
we generate and deliver considerably more electricity, doing so with 2% fewer employees.)
In 2008 alone, MidAmerican spent $1.8 billion on wind generation at our two operations, and today the
company is number one in the nation among regulated utilities in ownership of wind capacity. By the way,
compare that $1.8 billion to the $1.1 billion of pre-tax earnings of PacifiCorp (shown in the table as “Western”)
and Iowa. In our utility business, we spend all we earn, and then some, in order to fulfill the needs of our service
areas. Indeed, MidAmerican has not paid a dividend since Berkshire bought into the company in early 2000. Its
earnings have instead been reinvested to develop the utility systems our customers require and deserve. In
exchange, we have been allowed to earn a fair return on the huge sums we have invested. It’s a great partnership
for all concerned.
* * * * * * * * * * * *
Our long-avowed goal is to be the “buyer of choice” for businesses – particularly those built and owned
by families. The way to achieve this goal is to deserve it. That means we must keep our promises; avoid
leveraging up acquired businesses; grant unusual autonomy to our managers; and hold the purchased companies
through thick and thin (though we prefer thick and thicker).
Our record matches our rhetoric. Most buyers competing against us, however, follow a different path.
For them, acquisitions are “merchandise.” Before the ink dries on their purchase contracts, these operators are
contemplating “exit strategies.” We have a decided advantage, therefore, when we encounter sellers who truly
care about the future of their businesses.
Some years back our competitors were known as “leveraged-buyout operators.” But LBO became a
bad name. So in Orwellian fashion, the buyout firms decided to change their moniker. What they did not change,
though, were the essential ingredients of their previous operations, including their cherished fee structures and
love of leverage.
Their new label became “private equity,” a name that turns the facts upside-down: A purchase of a
business by these firms almost invariably results in dramatic reductions in the equity portion of the acquiree’s
capital structure compared to that previously existing. A number of these acquirees, purchased only two to three
years ago, are now in mortal danger because of the debt piled on them by their private-equity buyers. Much of
the bank debt is selling below 70¢ on the dollar, and the public debt has taken a far greater beating. The private-
equity firms, it should be noted, are not rushing in to inject the equity their wards now desperately need. Instead,
they’re keeping their remaining funds very private.
In the regulated utility field there are no large family-owned businesses. Here, Berkshire hopes to be
the “buyer of choice” of regulators. It is they, rather than selling shareholders, who judge the fitness of
purchasers when transactions are proposed.
There is no hiding your history when you stand before these regulators. They can – and do – call their
counterparts in other states where you operate and ask how you have behaved in respect to all aspects of the
business, including a willingness to commit adequate equity capital.
7
�
When MidAmerican proposed its purchase of PacifiCorp in 2005, regulators in the six new states we
would be serving immediately checked our record in Iowa. They also carefully evaluated our financing plans and
capabilities. We passed this examination, just as we expect to pass future ones.
There are two reasons for our confidence. First, Dave Sokol and Greg Abel are going to run any
businesses with which they are associated in a first-class manner. They don’t know of any other way to operate.
Beyond that is the fact that we hope to buy more regulated utilities in the future – and we know that our business
behavior in jurisdictions where we are operating today will determine how we are welcomed by new jurisdictions
tomorrow.
Insurance
Our insurance group has propelled Berkshire’s growth since we first entered the business in 1967. This
happy result has not been due to general prosperity in the industry. During the 25 years ending in 2007, return on
net worth for insurers averaged 8.5% versus 14.0% for the Fortune 500. Clearly our insurance CEOs have not
had the wind at their back. Yet these managers have excelled to a degree Charlie and I never dreamed possible in
the early days. Why do I love them? Let me count the ways.
At GEICO, Tony Nicely – now in his 48th year at the company after joining it when he was 18 –
continues to gobble up market share while maintaining disciplined underwriting. When Tony became CEO in
1993, GEICO had 2.0% of the auto insurance market, a level at which the company had long been stuck. Now we
have a 7.7% share, up from 7.2% in 2007.
The combination of new business gains and an improvement in the renewal rate on existing business
has moved GEICO into the number three position among auto insurers. In 1995, when Berkshire purchased
control, GEICO was number seven. Now we trail only State Farm and Allstate.
GEICO grows because it saves money for motorists. No one likes to buy auto insurance. But virtually
everyone likes to drive. So, sensibly, drivers look for the lowest-cost insurance consistent with first-class service.
Efficiency is the key to low cost, and efficiency is Tony’s specialty. Five years ago the number of policies per
employee was 299. In 2008, the number was 439, a huge increase in productivity.
As we view GEICO’s current opportunities, Tony and I feel like two hungry mosquitoes in a nudist
camp. Juicy targets are everywhere. First, and most important, our new business in auto insurance is now
exploding. Americans are focused on saving money as never before, and they are flocking to GEICO. In January
2009, we set a monthly record – by a wide margin – for growth in policyholders. That record will last exactly 28
days: As we go to press, it’s clear February’s gain will be even better.
Beyond this, we are gaining ground in allied lines. Last year, our motorcycle policies increased by
23.4%, which raised our market share from about 6% to more than 7%. Our RV and ATV businesses are also
growing rapidly, albeit from a small base. And, finally, we recently began insuring commercial autos, a big
market that offers real promise.
GEICO is now saving money for millions of Americans. Go to GEICO.com or call 1-800-847-7536
and see if we can save you money as well.
General Re, our large international reinsurer, also had an outstanding year in 2008. Some time back,
the company had serious problems (which I totally failed to detect when we purchased it in late 1998). By 2001,
when Joe Brandon took over as CEO, assisted by his partner, Tad Montross, General Re’s culture had further
deteriorated, exhibiting a loss of discipline in underwriting, reserving and expenses. After Joe and Tad took
charge, these problems were decisively and successfully addressed. Today General Re has regained its luster.
Last spring Joe stepped down, and Tad became CEO. Charlie and I are grateful to Joe for righting the ship and
are certain that, with Tad, General Re’s future is in the best of hands.
8
�
Reinsurance is a business of long-term promises, sometimes extending for fifty years or more. This
past year has retaught clients a crucial principle: A promise is no better than the person or institution making it.
That’s where General Re excels: It is the only reinsurer that is backed by an AAA corporation. Ben Franklin once
said, “It’s difficult for an empty sack to stand upright.” That’s no worry for General Re clients.
Our third major insurance operation is Ajit Jain’s reinsurance division, headquartered in Stamford and
staffed by only 31 employees. This may be one of the most remarkable businesses in the world, hard to
characterize but easy to admire.
From year to year, Ajit’s business is never the same. It features very large transactions, incredible
speed of execution and a willingness to quote on policies that leave others scratching their heads. When there is a
huge and unusual risk to be insured, Ajit is almost certain to be called.
Ajit came to Berkshire in 1986. Very quickly, I realized that we had acquired an extraordinary talent.
So I did the logical thing: I wrote his parents in New Delhi and asked if they had another one like him at home.
Of course, I knew the answer before writing. There isn’t anyone like Ajit.
Our smaller insurers are just as outstanding in their own way as the “big three,” regularly delivering
valuable float to us at a negative cost. We aggregate their results below under “Other Primary.” For space
reasons, we don’t discuss these insurers individually. But be assured that Charlie and I appreciate the
contribution of each.
Here is the record for the four legs to our insurance stool. The underwriting profits signify that all four
provided funds to Berkshire last year without cost, just as they did in 2007. And in both years our underwriting
profitability was considerably better than that achieved by the industry. Of course, we ourselves will periodically
have a terrible year in insurance. But, overall, I expect us to average an underwriting profit. If so, we will be
using free funds of large size for the indefinite future.
Underwriting Profit
Yearend Float
Insurance Operations
General Re . . . . . . . . . . . . . . . . . . . . . .
BH Reinsurance . . . . . . . . . . . . . . . . . .
GEICO . . . . . . . . . . . . . . . . . . . . . . . . .
Other Primary . . . . . . . . . . . . . . . . . . .
2008
$ 342
1,324
916
210
$2,792
Manufacturing, Service and Retailing Operations
(in millions)
2007
$ 555
1,427
1,113
279
$3,374
2008
$21,074
24,221
8,454
4,739
$58,488
2007
$23,009
23,692
7,768
4,229
$58,698
Our activities in this part of Berkshire cover the waterfront. Let’s look, though, at a summary balance sheet
and earnings statement for the entire group.
Balance Sheet 12/31/08 (in millions)
Assets
Cash and equivalents . . . . . . . . . . . . . . . . .
Accounts and notes receivable . . . . . . . . . .
Inventory . . . . . . . . . . . . . . . . . . . . . . . . . .
Other current assets . . . . . . . . . . . . . . . . . .
Total current assets . . . . . . . . . . . . . . . . . . .
Goodwill and other intangibles . . . . . . . . .
Fixed assets . . . . . . . . . . . . . . . . . . . . . . . .
Other assets . . . . . . . . . . . . . . . . . . . . . . . .
Liabilities and Equity
Notes payable . . . . . . . . . . . . . . . . . . . . . . .
Other current liabilities . . . . . . . . . . . . . . .
Total current liabilities . . . . . . . . . . . . . . . .
$ 2,212
8,087
10,299
Deferred taxes . . . . . . . . . . . . . . . . . . . . . .
Term debt and other liabilities . . . . . . . . . .
Equity . . . . . . . . . . . . . . . . . . . . . . . . . . . . .
2,786
6,033
30,779
$49,897
$ 2,497
5,047
7,500
752
15,796
16,515
16,338
1,248
$49,897
9
�


 2025年软考高级信息系统项目管理师金色考点
 软考高项三色笔记
 镇安县双鑫矿业月河年处理15万吨尾渣综合加工利用项目水土保持报告表
  红杉资本:生成式AI最新市场格局.pdf
 wireshark 使用教程.pdf
 【2021年-贝佐斯致股东的信】.pdf
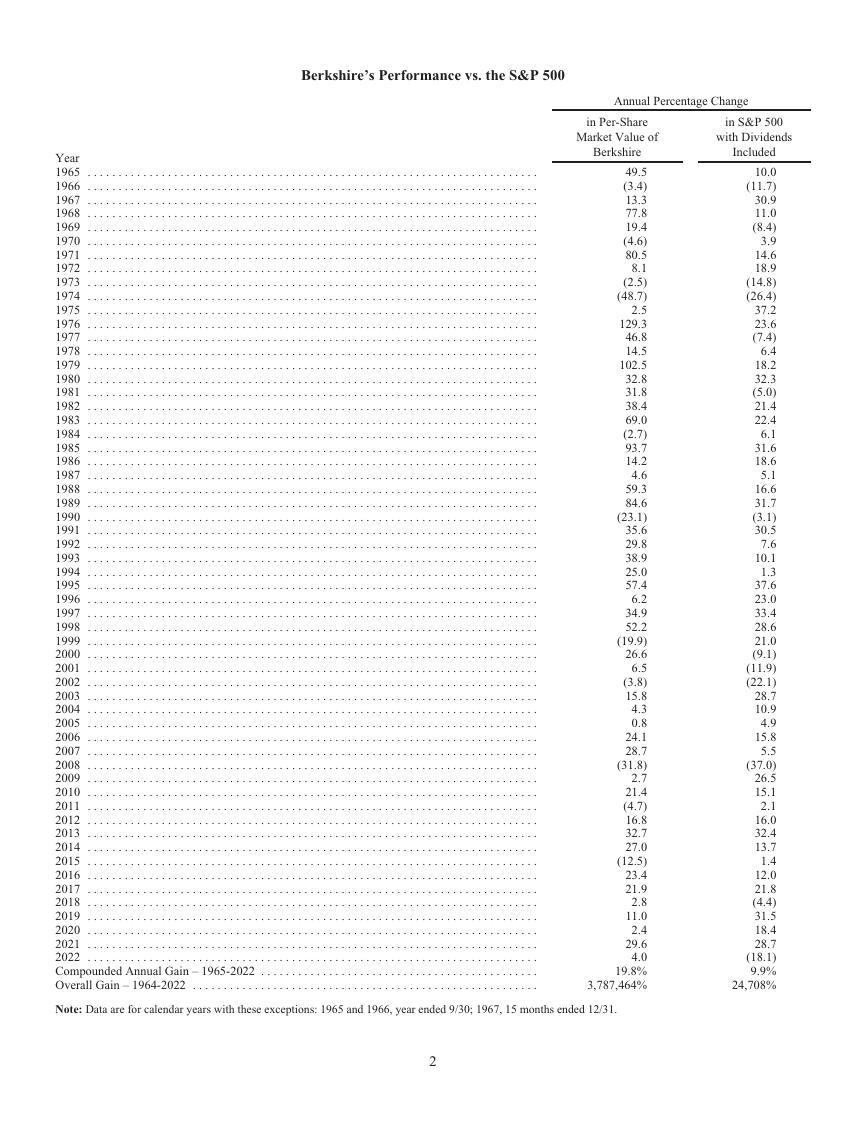 巴菲特致股东的公开信 - 2022.pdf
 MySQL 8.1 参考手册.pdf
 世界银行报告下载:激进政策缩紧浪潮不足遏制通胀 全球经济衰退迫在眉睫(Is a Global Recession Imminent?).pdf
 红杉资本报告:适应与忍耐(Adapting to Endure).pdf
 高保真音响系统设计制作-毕业论文.doc
 一种自适应互补滤波姿态估计算法.pdf