March 3, 1983
To the Stockholders of Berkshire Hathaway Inc.:
Operating earnings of $31.5 million in 1982 amounted to only
9.8% of beginning equity capital (valuing securities at cost),
down from 15.2% in 1981 and far below our recent high of 19.4% in
1978. This decline largely resulted from:
(1) a significant deterioration in insurance underwriting
results;
(2) a considerable expansion of equity capital without a
corresponding growth in the businesses we operate
directly; and
(3) a continually-enlarging commitment of our resources to
investment in partially-owned, nonoperated businesses;
accounting rules dictate that a major part of our
pro-rata share of earnings from such businesses must be
excluded from Berkshire’s reported earnings.
It was only a few years ago that we told you that the
operating earnings/equity capital percentage, with proper
allowance for a few other variables, was the most important
yardstick of single-year managerial performance. While we still
believe this to be the case with the vast majority of companies,
we believe its utility in our own case has greatly diminished.
You should be suspicious of such an assertion. Yardsticks seldom
are discarded while yielding favorable readings. But when
results deteriorate, most managers favor disposition of the
yardstick rather than disposition of the manager.
To managers faced with such deterioration, a more flexible
measurement system often suggests itself: just shoot the arrow of
business performance into a blank canvas and then carefully draw
the bullseye around the implanted arrow. We generally believe in
pre-set, long-lived and small bullseyes. However, because of the
importance of item (3) above, further explained in the following
section, we believe our abandonment of the operating
earnings/equity capital bullseye to be warranted.
Non-Reported Ownership Earnings
The appended financial statements reflect “accounting”
earnings that generally include our proportionate share of
earnings from any underlying business in which our ownership is
at least 20%. Below the 20% ownership figure, however, only our
share of dividends paid by the underlying business units is
included in our accounting numbers; undistributed earnings of
such less-than-20%-owned businesses are totally ignored.
There are a few exceptions to this rule; e.g., we own about
35% of GEICO Corporation but, because we have assigned our voting
rights, the company is treated for accounting purposes as a less-
than-20% holding. Thus, dividends received from GEICO in 1982 of
$3.5 million after tax are the only item included in our
“accounting”earnings. An additional $23 million that represents
our share of GEICO’s undistributed operating earnings for 1982 is
totally excluded from our reported operating earnings. If GEICO
had earned less money in 1982 but had paid an additional $1
million in dividends, our reported earnings would have been
larger despite the poorer business results. Conversely, if GEICO
had earned an additional $100 million - and retained it all - our
reported earnings would have been unchanged. Clearly
“accounting” earnings can seriously misrepresent economic
reality.
We prefer a concept of “economic” earnings that includes all
undistributed earnings, regardless of ownership percentage. In
our view, the value to all owners of the retained earnings of a
business enterprise is determined by the effectiveness with which
those earnings are used - and not by the size of one’s ownership
percentage. If you have owned .01 of 1% of Berkshire during the
past decade, you have benefited economically in full measure from
your share of our retained earnings, no matter what your
accounting system. Proportionately, you have done just as well
as if you had owned the magic 20%. But if you have owned 100% of
a great many capital-intensive businesses during the decade,
retained earnings that were credited fully and with painstaking
precision to you under standard accounting methods have resulted
in minor or zero economic value. This is not a criticism of
accounting procedures. We would not like to have the job of
designing a better system. It’s simply to say that managers and
investors alike must understand that accounting numbers are the
beginning, not the end, of business valuation.
In most corporations, less-than-20% ownership positions are
unimportant (perhaps, in part, because they prevent maximization
of cherished reported earnings) and the distinction between
accounting and economic results we have just discussed matters
little. But in our own case, such positions are of very large
and growing importance. Their magnitude, we believe, is what
B
E
R
K
S
H
I
R
E
H
A
T
H
A
W
A
Y
I
N
C
.
�
makes our reported operating earnings figure of limited
significance.
In our 1981 annual report we predicted that our share of
undistributed earnings from four of our major non-controlled
holdings would aggregate over $35 million in 1982. With no
change in our holdings of three of these companies - GEICO,
General Foods and The Washington Post - and a considerable
increase in our ownership of the fourth, R. J. Reynolds
Industries, our share of undistributed 1982 operating earnings of
this group came to well over $40 million. This number - not
reflected at all in our earnings - is greater than our total
reported earnings, which include only the $14 million in
dividends received from these companies. And, of course, we have
a number of smaller ownership interests that, in aggregate, had
substantial additional undistributed earnings.
We attach real significance to the general magnitude of
these numbers, but we don’t believe they should be carried to ten
decimal places. Realization by Berkshire of such retained
earnings through improved market valuations is subject to very
substantial, but indeterminate, taxation. And while retained
earnings over the years, and in the aggregate, have translated
into at least equal market value for shareholders, the
translation has been both extraordinarily uneven among companies
and irregular and unpredictable in timing.
However, this very unevenness and irregularity offers
advantages to the value-oriented purchaser of fractional portions
of businesses. This investor may select from almost the entire
array of major American corporations, including many far superior
to virtually any of the businesses that could be bought in their
entirety in a negotiated deal. And fractional-interest purchases
can be made in an auction market where prices are set by
participants with behavior patterns that sometimes resemble those
of an army of manic-depressive lemmings.
Within this gigantic auction arena, it is our job to select
businesses with economic characteristics allowing each dollar of
retained earnings to be translated eventually into at least a
dollar of market value. Despite a lot of mistakes, we have so
far achieved this goal. In doing so, we have been greatly
assisted by Arthur Okun’s patron saint for economists - St.
Offset. In some cases, that is, retained earnings attributable
to our ownership position have had insignificant or even negative
impact on market value, while in other major positions a dollar
retained by an investee corporation has been translated into two
or more dollars of market value. To date, our corporate over-
achievers have more than offset the laggards. If we can continue
this record, it will validate our efforts to maximize “economic”
earnings, regardless of the impact upon “accounting” earnings.
Satisfactory as our partial-ownership approach has been,
what really makes us dance is the purchase of 100% of good
businesses at reasonable prices. We’ve accomplished this feat a
few times (and expect to do so again), but it is an
extraordinarily difficult job - far more difficult than the
purchase at attractive prices of fractional interests.
As we look at the major acquisitions that others made during
1982, our reaction is not envy, but relief that we were non-
participants. For in many of these acquisitions, managerial
intellect wilted in competition with managerial adrenaline The
thrill of the chase blinded the pursuers to the consequences of
the catch. Pascal’s observation seems apt: “It has struck me
that all men’s misfortunes spring from the single cause that they
are unable to stay quietly in one room.”
(Your Chairman left the room once too often last year and
almost starred in the Acquisition Follies of 1982. In
retrospect, our major accomplishment of the year was that a very
large purchase to which we had firmly committed was unable to be
completed for reasons totally beyond our control. Had it come
off, this transaction would have consumed extraordinary amounts
of time and energy, all for a most uncertain payoff. If we were
to introduce graphics to this report, illustrating favorable
business developments of the past year, two blank pages depicting
this blown deal would be the appropriate centerfold.)
Our partial-ownership approach can be continued soundly only
as long as portions of attractive businesses can be acquired at
attractive prices. We need a moderately-priced stock market to
assist us in this endeavor. The market, like the Lord, helps
those who help themselves. But, unlike the Lord, the market does
not forgive those who know not what they do. For the investor, a
too-high purchase price for the stock of an excellent company can
undo the effects of a subsequent decade of favorable business
developments.
Should the stock market advance to considerably higher
levels, our ability to utilize capital effectively in partial-
ownership positions will be reduced or eliminated. This will
happen periodically: just ten years ago, at the height of the
two-tier market mania (with high-return-on-equity businesses bid
to the sky by institutional investors), Berkshire’s insurance
subsidiaries owned only $18 million in market value of equities,
excluding their interest in Blue Chip Stamps. At that time, such
equity holdings amounted to about 15% of our insurance company
investments versus the present 80%. There were as many good
businesses around in 1972 as in 1982, but the prices the stock
�
market placed upon those businesses in 1972 looked absurd. While
high stock prices in the future would make our performance look
good temporarily, they would hurt our long-term business
prospects rather than help them. We currently are seeing early
traces of this problem.
Long-Term Corporate Performance
Our gain in net worth during 1982, valuing equities held by
our insurance subsidiaries at market value (less capital gain
taxes payable if unrealized gains were actually realized)
amounted to $208 million. On a beginning net worth base of $519
million, the percentage gain was 40%.
During the 18-year tenure of present management, book value
has grown from $19.46 per share to $737.43 per share, or 22.0%
compounded annually. You can be certain that this percentage
will diminish in the future. Geometric progressions eventually
forge their own anchors.
Berkshire’s economic goal remains to produce a long-term
rate of return well above the return achieved by the average
large American corporation. Our willingness to purchase either
partial or total ownership positions in favorably-situated
businesses, coupled with reasonable discipline about the prices
we are willing to pay, should give us a good chance of achieving
our goal.
Again this year the gain in market valuation of partially-
owned businesses outpaced the gain in underlying economic value
of those businesses. For example, $79 million of our $208
million gain is attributable to an increased market price for
GEICO. This company continues to do exceptionally well, and we
are more impressed than ever by the strength of GEICO’s basic
business idea and by the management skills of Jack Byrne.
(Although not found in the catechism of the better business
schools, “Let Jack Do It” works fine as a corporate creed for
us.)
However, GEICO’s increase in market value during the past
two years has been considerably greater than the gain in its
intrinsic business value, impressive as the latter has been. We
expected such a favorable variation at some point, as the
perception of investors converged with business reality. And we
look forward to substantial future gains in underlying business
value accompanied by irregular, but eventually full, market
recognition of such gains.
Year-to-year variances, however, cannot consistently be in
our favor. Even if our partially-owned businesses continue to
perform well in an economic sense, there will be years when they
perform poorly in the market. At such times our net worth could
shrink significantly. We will not be distressed by such a
shrinkage; if the businesses continue to look attractive and we
have cash available, we simply will add to our holdings at even
more favorable prices.
Sources of Reported Earnings
The table below shows the sources of Berkshire’s reported
earnings. In 1981 and 1982 Berkshire owned about 60% of Blue
Chip Stamps which, in turn, owned 80% of Wesco Financial
Corporation. The table displays aggregate operating earnings of
the various business entities, as well as Berkshire’s share of
those earnings. All of the significant gains and losses
attributable to unusual sales of assets by any of the business
entities are aggregated with securities transactions in the line
near the bottom of the table, and are not included in operating
earnings.
Net Earnings
Earnings Before Income Taxes After Tax
-------------------------------------- ------------------
Total Berkshire Share Berkshire Share
------------------ ------------------ ------------------
1982 1981 1982 1981 1982 1981
-------- -------- -------- -------- -------- --------
(000s omitted)
Operating Earnings:
Insurance Group:
Underwriting ............ $(21,558) $ 1,478 $(21,558) $ 1,478 $(11,345) $ 798
Net Investment Income ... 41,620 38,823 41,620 38,823 35,270 32,401
Berkshire-Waumbec Textiles (1,545) (2,669) (1,545) (2,669) (862) (1,493)
Associated Retail Stores .. 914 1,763 914 1,763 446 759
See’s Candies ............. 23,884 20,961 14,235 12,493 6,914 5,910
Buffalo Evening News ...... (1,215) (1,217) (724) (725) (226) (320)
Blue Chip Stamps - Parent 4,182 3,642 2,492 2,171 2,472 2,134
Wesco Financial - Parent .. 6,156 4,495 2,937 2,145 2,210 1,590
Mutual Savings and Loan ... (6) 1,605 (2) 766 1,524 1,536
Precision Steel ........... 1,035 3,453 493 1,648 265 841
Interest on Debt .......... (14,996) (14,656) (12,977) (12,649) (6,951) (6,671)
Other* .................... 2,631 2,985 1,857 1,992 1,780 1,936
-------- -------- -------- -------- -------- --------
Operating Earnings .......... 41,102 60,663 27,742 47,236 31,497 39,421
Sales of securities and
unusual sales of assets .. 36,651 37,801 21,875 33,150 14,877 23,183
-------- -------- -------- -------- -------- --------
Total Earnings - all entities $ 77,753 $ 98,464 $ 49,617 $ 80,386 $ 46,374 $ 62,604
�
======== ======== ======== ======== ======== ========
* Amortization of intangibles arising in accounting for purchases
of businesses (i.e. See’s, Mutual and Buffalo Evening News) is
reflected in the category designated as “Other”.
On pages 45-61 of this report we have reproduced the
narrative reports of the principal executives of Blue Chip and
Wesco, in which they describe 1982 operations. A copy of the
full annual report of either company will be mailed to any
Berkshire shareholder upon request to Mr. Robert H. Bird for
Blue Chip Stamps, 5801 South Eastern Avenue, Los Angeles,
California 90040, or to Mrs. Jeanne Leach for Wesco Financial
Corporation, 315 East Colorado Boulevard, Pasadena, California
91109.
I believe you will find the Blue Chip chronicle of
developments in the Buffalo newspaper situation particularly
interesting. There are now only 14 cities in the United States
with a daily newspaper whose weekday circulation exceeds that of
the Buffalo News. But the real story has been the growth in
Sunday circulation. Six years ago, prior to introduction of a
Sunday edition of the News, the long-established Courier-Express,
as the only Sunday newspaper published in Buffalo, had
circulation of 272,000. The News now has Sunday circulation of
367,000, a 35% gain - even though the number of households within
the primary circulation area has shown little change during the
six years. We know of no city in the United States with a long
history of seven-day newspaper publication in which the
percentage of households purchasing the Sunday newspaper has
grown at anything like this rate. To the contrary, in most
cities household penetration figures have grown negligibly, or
not at all. Our key managers in Buffalo - Henry Urban, Stan
Lipsey, Murray Light, Clyde Pinson, Dave Perona and Dick Feather
- deserve great credit for this unmatched expansion in Sunday
readership.
As we indicated earlier, undistributed earnings in companies
we do not control are now fully as important as the reported
operating earnings detailed in the preceding table. The
distributed portion of non-controlled earnings, of course, finds
its way into that table primarily through the net investment
income segment of Insurance Group earnings.
We show below Berkshire’s proportional holdings in those
non-controlled businesses for which only distributed earnings
(dividends) are included in our earnings.
No. of Shares
or Share Equiv. Cost Market
--------------- ---------- ----------
(000s omitted)
460,650 (a) Affiliated Publications, Inc. ...... $ 3,516 $ 16,929
908,800 (c) Crum & Forster ..................... 47,144 48,962
2,101,244 (b) General Foods, Inc. ................ 66,277 83,680
7,200,000 (a) GEICO Corporation .................. 47,138 309,600
2,379,200 (a) Handy & Harman ..................... 27,318 46,692
711,180 (a) Interpublic Group of Companies, Inc. 4,531 34,314
282,500 (a) Media General ...................... 4,545 12,289
391,400 (a) Ogilvy & Mather Int’l. Inc. ........ 3,709 17,319
3,107,675 (b) R. J. Reynolds Industries .......... 142,343 158,715
1,531,391 (a) Time, Inc. ......................... 45,273 79,824
1,868,600 (a) The Washington Post Company ........ 10,628 103,240
---------- ----------
$402,422 $911,564
All Other Common Stockholdings ..... 21,611 34,058
---------- ----------
Total Common Stocks $424,033 $945,622
========== ==========
(a) All owned by Berkshire or its insurance subsidiaries.
(b) Blue Chip and/or Wesco own shares of these companies. All
numbers represent Berkshire’s net interest in the larger
gross holdings of the group.
(c) Temporary holding as cash substitute.
In case you haven’t noticed, there is an important
investment lesson to be derived from this table: nostalgia should
be weighted heavily in stock selection. Our two largest
unrealized gains are in Washington Post and GEICO, companies with
which your Chairman formed his first commercial connections at
the ages of 13 and 20, respectively After straying for roughly 25
years, we returned as investors in the mid-1970s. The table
quantifies the rewards for even long-delayed corporate fidelity.
Our controlled and non-controlled businesses operate over
such a wide spectrum that detailed commentary here would prove
too lengthy. Much financial and operational information
regarding the controlled businesses is included in Management’s
Discussion on pages 34-39, and in the narrative reports on pages
45-61. However, our largest area of business activity has been,
and almost certainly will continue to be, the property-casualty
insurance area. So commentary on developments in that industry
is appropriate.
Insurance Industry Conditions
�
We show below an updated table of the industry statistics we
utilized in last year’s annual report. Its message is clear:
underwriting results in 1983 will not be a sight for the
squeamish.
Yearly Change Yearly Change Combined Ratio
in Premiums in Premiums after Policy-
Written (%) Earned (%) holder Dividends
------------- ------------- ----------------
1972 ................ 10.2 10.9 96.2
1973 ................ 8.0 8.8 99.2
1974 ................ 6.2 6.9 105.4
1975 ................ 11.0 9.6 107.9
1976 ................ 21.9 19.4 102.4
1977 ................ 19.8 20.5 97.2
1978 ................ 12.8 14.3 97.5
1979 ................ 10.3 10.4 100.6
1980 ................ 6.0 7.8 103.1
1981 (Rev.) ......... 3.9 4.1 106.0
1982 (Est.) ......... 5.1 4.6 109.5
Source: Best’s Aggregates and Averages.
The Best’s data reflect the experience of practically the
entire industry, including stock, mutual and reciprocal
companies. The combined ratio represents total operating and
loss costs as compared to revenue from premiums; a ratio below
100 indicates an underwriting profit, and one above 100 indicates
a loss.
For reasons outlined in last year’s report, as long as the
annual gain in industry premiums written falls well below 10%,
you can expect the underwriting picture in the next year to
deteriorate. This will be true even at today’s lower general
rate of inflation. With the number of policies increasing
annually, medical inflation far exceeding general inflation, and
concepts of insured liability broadening, it is highly unlikely
that yearly increases in insured losses will fall much below 10%.
You should be further aware that the 1982 combined ratio of
109.5 represents a “best case” estimate. In a given year, it is
possible for an insurer to show almost any profit number it
wishes, particularly if it (1) writes “long-tail” business
(coverage where current costs can be only estimated, because
claim payments are long delayed), (2) has been adequately
reserved in the past, or (3)
indications that several large insurers opted in 1982 for obscure
accounting and reserving maneuvers that masked significant
deterioration in their underlying businesses. In insurance, as
elsewhere, the reaction of weak managements to weak operations is
often weak accounting. (“It’s difficult for an empty sack to
stand upright.”)
is growing very rapidly. There are
The great majority of managements, however, try to play it
straight. But even managements of integrity may subconsciously
be less willing in poor profit years to fully recognize adverse
loss trends. Industry statistics indicate some deterioration in
loss reserving practices during 1982 and the true combined ratio
is likely to be modestly worse than indicated by our table.
The conventional wisdom is that 1983 or 1984 will see the
worst of underwriting experience and then, as in the past, the
“cycle” will move, significantly and steadily, toward better
results. We disagree because of a pronounced change in the
competitive environment, hard to see for many years but now quite
visible.
To understand the change, we need to look at some major
factors that affect levels of corporate profitability generally.
Businesses in industries with both substantial over-capacity and
a “commodity” product (undifferentiated in any customer-important
way by factors such as performance, appearance, service support,
etc.) are prime candidates for profit troubles. These may be
escaped, true, if prices or costs are administered in some manner
and thereby insulated at least partially from normal market
forces. This administration can be carried out (a) legally
through government intervention (until recently, this category
included pricing for truckers and deposit costs for financial
institutions), (b) illegally through collusion, or (c) “extra-
legally” through OPEC-style foreign cartelization (with tag-along
benefits for domestic non-cartel operators).
If, however, costs and prices are determined by full-bore
competition, there is more than ample capacity, and the buyer
cares little about whose product or distribution services he
uses, industry economics are almost certain to be unexciting.
They may well be disastrous.
Hence the constant struggle of every vendor to establish and
emphasize special qualities of product or service. This works
with candy bars (customers buy by brand name, not by asking for a
“two-ounce candy bar”) but doesn’t work with sugar (how often do
you hear, “I’ll have a cup of coffee with cream and C & H sugar,
please”).
In many industries, differentiation simply can’t be made
meaningful. A few producers in such industries may consistently
do well if they have a cost advantage that is both wide and
sustainable. By definition such exceptions are few, and, in many
industries, are non-existent. For the great majority of
�
companies selling “commodity”products, a depressing equation of
business economics prevails: persistent over-capacity without
administered prices (or costs) equals poor profitability.
Of course, over-capacity may eventually self-correct, either
as capacity shrinks or demand expands. Unfortunately for the
participants, such corrections often are long delayed. When they
finally occur, the rebound to prosperity frequently produces a
pervasive enthusiasm for expansion that, within a few years,
again creates over-capacity and a new profitless environment. In
other words, nothing fails like success.
What finally determines levels of long-term profitability in
such industries is the ratio of supply-tight to supply-ample
years. Frequently that ratio is dismal. (It seems as if the most
recent supply-tight period in our textile business - it occurred
some years back - lasted the better part of a morning.)
In some industries, however, capacity-tight conditions can
last a long time. Sometimes actual growth in demand will outrun
forecasted growth for an extended period. In other cases, adding
capacity requires very long lead times because complicated
manufacturing facilities must be planned and built.
But in the insurance business, to return to that subject,
capacity can be instantly created by capital plus an
underwriter’s willingness to sign his name. (Even capital is less
important in a world in which state-sponsored guaranty funds
protect many policyholders against insurer insolvency.) Under
almost all conditions except that of fear for survival -
produced, perhaps, by a stock market debacle or a truly major
natural disaster - the insurance industry operates under the
competitive sword of substantial overcapacity. Generally, also,
despite heroic attempts to do otherwise, the industry sells a
relatively undifferentiated commodity-type product. (Many
insureds, including the managers of large businesses, do not even
know the names of their insurers.) Insurance, therefore, would
seem to be a textbook case of an industry usually faced with the
deadly combination of excess capacity and a “commodity” product.
Why, then, was underwriting, despite the existence of
cycles, generally profitable over many decades? (From 1950
through 1970, the industry combined ratio averaged 99.0.
allowing all investment income plus 1% of premiums to flow
through to profits.) The answer lies primarily in the historic
methods of regulation and distribution. For much of this
century, a large portion of the industry worked, in effect,
within a legal quasi-administered pricing system fostered by
insurance regulators. While price competition existed, it was
not pervasive among the larger companies. The main competition
was for agents, who were courted via various non-price-related
strategies.
For the giants of the industry, most rates were set through
negotiations between industry “bureaus” (or through companies
acting in accord with their recommendations) and state
regulators. Dignified haggling occurred, but it was between
company and regulator rather than between company and customer.
When the dust settled, Giant A charged the same price as Giant B
- and both companies and agents were prohibited by law from
cutting such filed rates.
The company-state negotiated prices included specific profit
allowances and, when loss data indicated that current prices were
unprofitable, both company managements and state regulators
expected that they would act together to correct the situation.
Thus, most of the pricing actions of the giants of the industry
were “gentlemanly”, predictable, and profit-producing. Of prime
importance - and in contrast to the way most of the business
world operated - insurance companies could legally price their
way to profitability even in the face of substantial over-
capacity.
That day is gone. Although parts of the old structure
remain, far more than enough new capacity exists outside of that
structure to force all parties, old and new, to respond. The new
capacity uses various methods of distribution and is not
reluctant to use price as a prime competitive weapon. Indeed, it
relishes that use. In the process, customers have learned that
insurance is no longer a one-price business. They won’t forget.
Future profitability of the industry will be determined by
current competitive characteristics, not past ones. Many
managers have been slow to recognize this. It’s not only
generals that prefer to fight the last war. Most business and
investment analysis also comes from the rear-view mirror. It
seems clear to us, however, that only one condition will allow
the insurance industry to achieve significantly improved
underwriting results. That is the same condition that will allow
better results for the aluminum, copper, or corn producer - a
major narrowing of the gap between demand and supply.
Unfortunately, there can be no surge in demand for insurance
policies comparable to one that might produce a market tightness
in copper or aluminum. Rather, the supply of available insurance
coverage must be curtailed. “Supply”, in this context, is mental
rather than physical: plants or companies need not be shut; only
the willingness of underwriters to sign their names need be
curtailed.
�
This contraction will not happen because of generally poor
profit levels. Bad profits produce much hand-wringing and
finger-pointing. But they do not lead major sources of insurance
capacity to turn their backs on very large chunks of business,
thereby sacrificing market share and industry significance.
Instead, major capacity withdrawals require a shock factor
such as a natural or financial “megadisaster”. One might occur
tomorrow - or many years from now. The insurance business - even
taking investment income into account - will not be particularly
profitable in the meantime.
When supply ultimately contracts, large amounts of business
will be available for the few with large capital capacity, a
willingness to commit it, and an in-place distribution system.
We would expect great opportunities for our insurance
subsidiaries at such a time.
During 1982, our insurance underwriting deteriorated far
more than did the industry’s. From a profit position well above
average, we, slipped to a performance modestly below average.
The biggest swing was in National Indemnity’s traditional
coverages. Lines that have been highly profitable for us in the
past are now priced at levels that guarantee underwriting losses.
In 1983 we expect our insurance group to record an average
performance in an industry in which average is very poor.
Two of our stars, Milt Thornton at Cypress and Floyd Taylor
at Kansas Fire and Casualty, continued their outstanding records
of producing an underwriting profit every year since joining us.
Both Milt and Floyd simply are incapable of being average. They
maintain a passionately proprietary attitude toward their
operations and have developed a business culture centered upon
unusual cost-consciousness and customer service. It shows on
their scorecards.
During 1982, parent company responsibility for most of our
insurance operations was given to Mike Goldberg. Planning,
recruitment, and monitoring all have shown significant
improvement since Mike replaced me in this role.
GEICO continues to be managed with a zeal for efficiency and
value to the customer that virtually guarantees unusual success.
Jack Byrne and Bill Snyder are achieving the most elusive of
human goals - keeping things simple and remembering what you set
out to do. In Lou Simpson, additionally, GEICO has the best
investment manager in the property-casualty business. We are
happy with every aspect of this operation. GEICO is a
magnificent illustration of the high-profit exception we
described earlier in discussing commodity industries with over-
capacity - a company with a wide and sustainable cost advantage.
Our 35% interest in GEICO represents about $250 million of
premium volume, an amount considerably greater than all of the
direct volume we produce.
Issuance of Equity
Berkshire and Blue Chip are considering merger in 1983. If
it takes place, it will involve an exchange of stock based upon
an identical valuation method applied to both companies. The one
other significant issuance of shares by Berkshire or its
affiliated companies that occurred during present management’s
tenure was in the 1978 merger of Berkshire with Diversified
Retailing Company.
Our share issuances follow a simple basic rule: we will not
issue shares unless we receive as much intrinsic business value
as we give. Such a policy might seem axiomatic. Why, you might
ask, would anyone issue dollar bills in exchange for fifty-cent
pieces? Unfortunately, many corporate managers have been willing
to do just that.
The first choice of these managers in making acquisitions
may be to use cash or debt. But frequently the CEO’s cravings
outpace cash and credit resources (certainly mine always have).
Frequently, also, these cravings occur when his own stock is
selling far below intrinsic business value. This state of
affairs produces a moment of truth. At that point, as Yogi Berra
has said, “You can observe a lot just by watching.” For
shareholders then will find which objective the management truly
prefers - expansion of domain or maintenance of owners’ wealth.
The need to choose between these objectives occurs for some
simple reasons. Companies often sell in the stock market below
their intrinsic business value. But when a company wishes to
sell out completely, in a negotiated transaction, it inevitably
wants to - and usually can - receive full business value in
whatever kind of currency the value is to be delivered. If cash
is to be used in payment, the seller’s calculation of value
received couldn’t be easier. If stock of the buyer is to be the
currency, the seller’s calculation is still relatively easy: just
figure the market value in cash of what is to be received in
stock.
Meanwhile, the buyer wishing to use his own stock as
currency for the purchase has no problems if the stock is selling
in the market at full intrinsic value.
But suppose it is selling at only half intrinsic value. In
�
that case, the buyer is faced with the unhappy prospect of using
a substantially undervalued currency to make its purchase.
Ironically, were the buyer to instead be a seller of its
entire business, it too could negotiate for, and probably get,
full intrinsic business value. But when the buyer makes a
partial sale of itself - and that is what the issuance of shares
to make an acquisition amounts to - it can customarily get no
higher value set on its shares than the market chooses to grant
it.
The acquirer who nevertheless barges ahead ends up using an
undervalued (market value) currency to pay for a fully valued
(negotiated value) property. In effect, the acquirer must give
up $2 of value to receive $1 of value. Under such circumstances,
a marvelous business purchased at a fair sales price becomes a
terrible buy. For gold valued as gold cannot be purchased
intelligently through the utilization of gold - or even silver -
valued as lead.
If, however, the thirst for size and action is strong
enough, the acquirer’s manager will find ample rationalizations
for such a value-destroying issuance of stock. Friendly
investment bankers will reassure him as to the soundness of his
actions. (Don’t ask the barber whether you need a haircut.)
A few favorite rationalizations employed by stock-issuing
managements follow:
(a) “The company we’re buying is going to be worth a lot
more in the future.” (Presumably so is the interest in
the old business that is being traded away; future
prospects are implicit in the business valuation
process. If 2X is issued for X, the imbalance still
exists when both parts double in business value.)
(b) “We have to grow.” (Who, it might be asked, is the “we”?
For present shareholders, the reality is that all
existing businesses shrink when shares are issued. Were
Berkshire to issue shares tomorrow for an acquisition,
Berkshire would own everything that it now owns plus the
new business, but your interest in such hard-to-match
businesses as See’s Candy Shops, National Indemnity,
etc. would automatically be reduced. If (1) your family
owns a 120-acre farm and (2) you invite a neighbor with
60 acres of comparable land to merge his farm into an
equal partnership - with you to be managing partner,
then (3) your managerial domain will have grown to 180
acres but you will have permanently shrunk by 25% your
family’s ownership interest in both acreage and crops.
Managers who want to expand their domain at the expense
of owners might better consider a career in government.)
(c) “Our stock is undervalued and we’ve minimized its use in
this deal - but we need to give the selling shareholders
51% in stock and 49% in cash so that certain of those
shareholders can get the tax-free exchange they want.”
(This argument acknowledges that it is beneficial to the
acquirer to hold down the issuance of shares, and we like
that. But if it hurts the old owners to utilize shares
on a 100% basis, it very likely hurts on a 51% basis.
After all, a man is not charmed if a spaniel defaces his
lawn, just because it’s a spaniel and not a St. Bernard.
And the wishes of sellers can’t be the determinant of the
best interests of the buyer - what would happen if,
heaven forbid, the seller insisted that as a condition of
merger the CEO of the acquirer be replaced?)
There are three ways to avoid destruction of value for old
owners when shares are issued for acquisitions. One is to have a
true business-value-for-business-value merger, such as the
Berkshire-Blue Chip combination is intended to be. Such a merger
attempts to be fair to shareholders of both parties, with each
receiving just as much as it gives in terms of intrinsic business
value. The Dart Industries-Kraft and Nabisco Standard Brands
mergers appeared to be of this type, but they are the exceptions.
It’s not that acquirers wish to avoid such deals; it’s just that
they are very hard to do.
The second route presents itself when the acquirer’s stock
sells at or above its intrinsic business value. In that
situation, the use of stock as currency actually may enhance the
wealth of the acquiring company’s owners. Many mergers were
accomplished on this basis in the 1965-69 period. The results
were the converse of most of the activity since 1970: the
shareholders of the acquired company received very inflated
currency (frequently pumped up by dubious accounting and
promotional techniques) and were the losers of wealth through
such transactions.
During recent years the second solution has been available
to very few large companies. The exceptions have primarily been
those companies in glamorous or promotional businesses to which
the market temporarily attaches valuations at or above intrinsic
business valuation.
The third solution is for the acquirer to go ahead with the
acquisition, but then subsequently repurchase a quantity of
shares equal to the number issued in the merger. In this manner,
what originally was a stock-for-stock merger can be converted,
�


 2025年软考高级信息系统项目管理师金色考点
 软考高项三色笔记
 镇安县双鑫矿业月河年处理15万吨尾渣综合加工利用项目水土保持报告表
  红杉资本:生成式AI最新市场格局.pdf
 wireshark 使用教程.pdf
 【2021年-贝佐斯致股东的信】.pdf
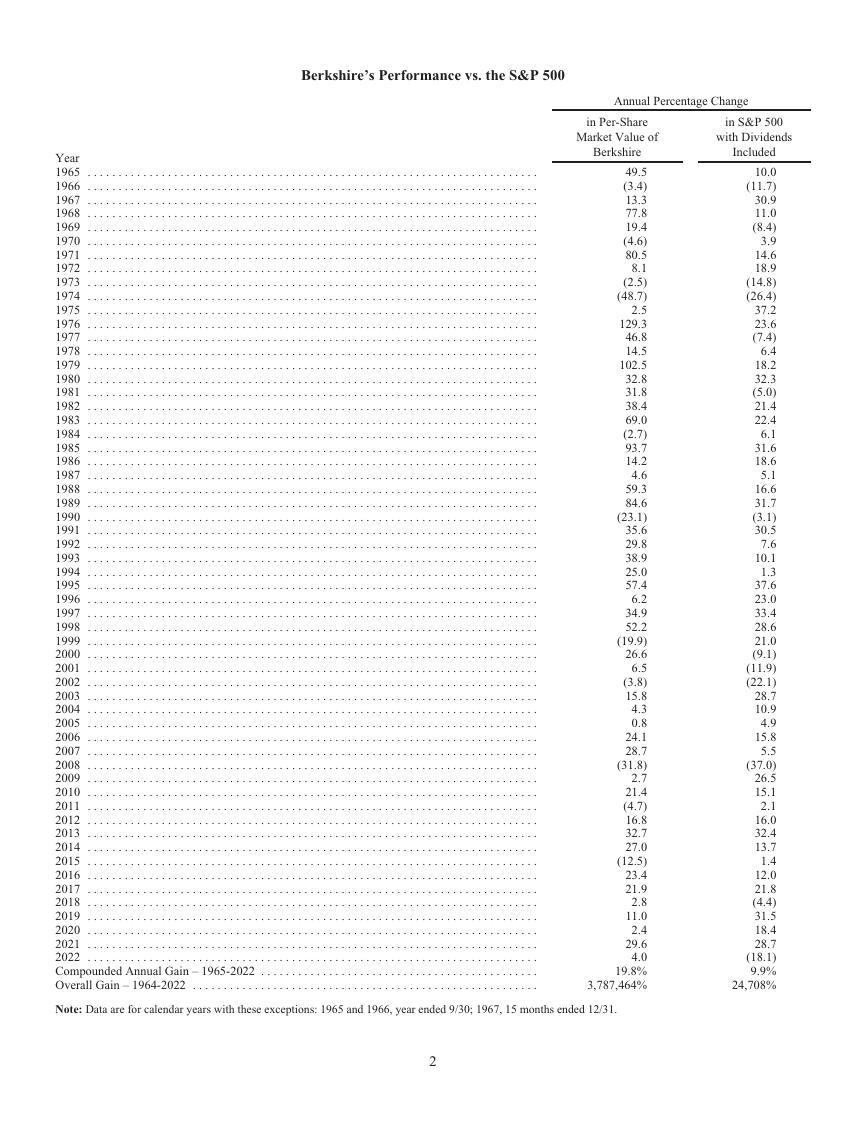 巴菲特致股东的公开信 - 2022.pdf
 MySQL 8.1 参考手册.pdf
 世界银行报告下载:激进政策缩紧浪潮不足遏制通胀 全球经济衰退迫在眉睫(Is a Global Recession Imminent?).pdf
 红杉资本报告:适应与忍耐(Adapting to Endure).pdf
 高保真音响系统设计制作-毕业论文.doc
 一种自适应互补滤波姿态估计算法.pdf