Journal of Service Science and Management, 2020, 13, 435-448
https://www.scirp.org/journal/jssm
ISSN Online: 1940-9907
ISSN Print: 1940-9893
Bank Telemarketing Forecasting Model Based
on t-SNE-SVM
Jianguo Che1, Sai Zhao1, Yongfan Li2, Kai Li1
1Business School, Nankai University, Tianjin, China
2Mechanical Electrical Engineering School, Beijing Information Science & Technology University, Beijing, China
How to cite this paper: Che, J. G., Zhao, S.,
Li, Y. F., & Li, K. (2020). Bank Telemarket-
ing Forecasting Model Based on t-SNE-SVM.
Journal of Service Science and Manage-
ment, 13, 435-448.
https://doi.org/10.4236/jssm.2020.133029
Received: April 14, 2020
Accepted: May 15, 2020
Published: May 18, 2020
Copyright © 2020 by author(s) and
Scientific Research Publishing Inc.
This work is licensed under the Creative
Commons Attribution International
License (CC BY 4.0).
http://creativecommons.org/licenses/by/4.0/
Open Access
Abstract
As a low-cost marketing model, telemarketing has always been the most im-
portant channel for banks to promote wealth management products. Tradi-
tional telemarketing has not only brought intrusiveness to many telephone
access customers, but also a waste of resources for the bank itself. In order to
improve the success rate of bank telemarketing, it is necessary to predict in
advance which customers are most likely to purchase the wealth management
product, so as to achieve precision marketing. Aiming at the complex
high-dimensional nonlinear characteristics of the factors affecting the success
rate of telemarketing, a t-SNE (t-distributed stochastic neighbor embedding)
feature extraction method, and then take the extracted low-dimensional fea-
tures as input, use nonlinear support vector machine (SVM) for training and
prediction. The empirical results show that the bank phone based on
t-SNE-SVM proposed in this paper. The marketing prediction model has
good learning ability and generalization ability, which can provide certain de-
cision-making reference for banks and other industries to achieve precision
marketing.
Keywords
Telemarketing, t-SNE, Support Vector Machine (SVM), Forecasting, Preci-
sion Marketing
1. Introduction
As a typical strategy to promote business development, marketing activities can
generally be divided into mass marketing and direct marketing. Mass marketing
is the use of newspapers, radio, television and other media to promote the gen-
eral public, while direct marketing is through mobile phones, fixed phones, Email,
etc. directly contact customers to promote products or provide customers with
435
Journal of Service Science and Management
DOI: 10.4236/jssm.2020.133029 May 18, 2020
�
J. G. Che et al.
DOI: 10.4236/jssm.2020.133029
discounts. In today’s highly competitive market environment, mass marketing is
no longer an effective and reliable method, and marketing is moving from tradi-
tional mass marketing moving to direct marketing (Elsalamony, 2014). In direct
marketing, because of its low cost and easy communication, telemarketing has
gradually become one of the most widely used marketing channels. Compared to
traditional account manager marketing and branch site marketing, telemarket-
ing is promoting finance to individual customers. There are significant ad-
vantages in terms of products, and when the products are suitable, telephone
marketing can directly make profits, thereby providing banks with new market-
ing channels and profit channels (Song, 2011). However, with the increasing use
of telemarketing, companies have also received more and more customer com-
plaints (Moro et al., 2012). For most customers who are reluctant to purchase
the product, marketing calls may mean intrusiveness. On the other hand, many
commercial banks have not implemented effective classified marketing strategies
for their customers and often sell the same wealth management product to many
customers, which is not effective Use information to analyze customer needs,
wasting a lot of manpower and other resources (Liu & Zhang, 2008). Therefore,
it is necessary for companies implementing telemarketing to analyze customer
data in advance using predictive models in order to select those customers who
are most likely to respond to targeted marketing (Sing’oei et al., 2013), which can
not only improve the marketing efficiency of bank managers, but also maximize
To reduce intrusiveness to non-target customers.
Banks usually have a large number of databases consisting of customer infor-
mation and transaction information. This can not only provide banks with ac-
curate and timely business and management information, but also perform
functional query, analysis, and decision advice on information, and provide de-
tailed information support for marketing activities (An, 2007). Data mining
technology can not only explain past marketing results, but also provide decision
support for future marketing activities, so it is widely used in bank marketing
business. Many data mining algorithms are used to predict the success rate of
telemarketing, such as support vector machines (Moro et al., 2012), deep convo-
lutional neural networks (Kim et al., 2015), and comparative analysis of various
classification algorithms (Elsalamony, 2014; Moro et al., 2011, 2014). Amponsah
et al. (2016) used the J48 decision tree and Naive Bayes classifier to conduct an
empirical analysis of the survey data set of a rural bank in Ghana, and provided
decision suggestions for bank staff to sell a loan product to community residents
(Amponsah et al., 2016). Mitik et al. (2017) constructed a data mining method
based on profit-cost analysis. The empirical results show that this method will
reduce a small amount of total profit, but because the total cost has dropped sig-
nificantly, the total profit/cost ratio has increased significantly. Villuendas-Rey
et al. (2017) proposed a naive association classifier. This classifier uses a new
similarity operator, which can handle missing values as well as mixed classifica-
tion and numerical variables. The classifier is verified better performance than
other traditional classifiers by related financial data sets. Zakaryazad et al. (2016)
436
Journal of Service Science and Management
�
J. G. Che et al.
considered the cost of misclassification of each sample, modified the artificial
neural network using a penalty function, and applied it to fraud detection and
bank marketing. Although the empirical results are not as good as before, this
method can achieve better performance when considering profit indicators. In
related financial and commercial fields, Pang et al. (2009) embedded Boosting
technology into the decision tree C5.0 algorithm, established a personal credit
rating model based on C5.0, and performed credit rating on personal credit data
of a German bank. Li et al. (2011) introduced the cross-selling sequence model
to the cross-selling analysis of domestic commercial banks, constructed a
cross-selling sequence model for individual customers, and used Logistic regres-
sion to predict the probability of customers buying different products. The re-
sults show that it can help banks implement cross-selling strategy effectively.
Fang et al. (2014) constructed a personal credit risk early-warning model based
on the Lasso-Logistic model. Through empirical analysis of credit card consum-
er credit default data, it showed that this model can better capture the key factors
affecting consumer credit risk, and at the same time it has higher prediction ac-
curacy. Zhang et al. (2015) applied Logistics and SVM to bank credit risk early
warning. This method can fully capture and characterize the linear and
non-linear complex features of influencing factors on customer defaults. The
model has better generalization ability and can warn the credit risks of consum-
ers accurately. Xiao et al. (2018) used BP neural network to evaluate the credit of
network lenders. The verification of actual P2P transaction data showed that the
model has strong predictive ability and can be applied to the risk control of P2P
online loan platform to a certain extent. Zhang et al. (2018) constructed a credit
risk assessment model of P2P online loan borrowers based on non-equilibrium
fuzzy approximate support vector machines. The empirical results show that the
model has better classification accuracy and better adaptability than other mod-
els. In addition, it can effectively reduce the impact of sample imbalance on clas-
sification results.
As the bank marketing data set generally contains more variables (such as many
customer attributes), on the one hand it will affect the training speed of the
model (dimensional disaster), it will consume more time and memory, and on
the other hand it is easy to cause over-learning of the model, which makes it dif-
ficult to understand, so it is necessary to carry out the dimension reduction. The
dimension reduction greatly reduces the time and memory requirements of the
data mining algorithm, and can reduce the original data to 2D or 3D makes data
easier to visualize (Tan et al., 2001). However, using automatic or semi-automatic
feature selection methods to eliminate some input features may cause the lack of
input information. To this end, this paper proposes a t-SNE-SVM-based bank
telephone marketing prediction method. This method first uses the t-SNE algo-
rithm to visually reduce the number of input attributes that may affect the suc-
cess rate of telemarketing, while reducing complexity while maximizing infor-
mation of original input features is retained. Then use the reduced-dimensional
low-dimensional data as input to the SVM algorithm to learn and train to pre-
437
Journal of Service Science and Management
DOI: 10.4236/jssm.2020.133029
�
J. G. Che et al.
dict which customers will buy the wealth management products.
2. Prerequisite Knowledge
2.1. t-Distributed Stochastic Neighbor Embedding (t-SNE)
t-distributed stochastic neighbor embedding (t-SNE) is a nonlinear dimension-
ality reduction and visualization algorithm proposed by Maaten et al. (2008),
which maps multi-dimensional data to two or three dimensions suitable for hu-
man observation for visualization research (Maaten et al., 2008). t-SNE is de-
rived from SNE (Stochastic Neighbor Embedding). The idea of the SNE algo-
rithm is that while mapping high-dimensional data to low-dimensional data, try
to ensure that the distribution probability between the points is unchanged, that
is, similar data points in high-dimensional space have similar distances to
low-dimensional space. There are two main disadvantages of the SNE algorithm:
one is the large amount of gradient calculation caused by asymmetry, and the
other is the crowding problem, that is, the clusters of different classes are
crowded together and cannot be distinguished. In addition, the SNE algorithm
only focuses on the locality of the data and ignores the globality of the data. The
t-SNE algorithm is improved for the above defects. For a detailed introduction
of the t-SNE algorithm, see the literature (Maaten et al., 2008).
2.2. Support Vector Machine (SVM)
Support Vector Machine (SVM) was first proposed by Corinna Cortes and Vapnik
in 1995. It has many unique advantages in solving small sample, non-linear and
high-dimensional pattern recognition and is widely used in industry, computer
science, finance and other fields. Support vector machine provides better deci-
sion boundaries than traditional neural networks. The classification results are
better than many parametric or non-parametric statistical techniques, and the
problem of overfitting can be overcome through the concept of structural risk
minimization (Kim et al., 2018). By non-linearly mapping the input vector to a
high-dimensional feature space, the support vector machine can use a linear
model to construct a nonlinear classification boundary.
Kernel functions are often used instead of dot product operations between
vector pairs in transformed space. Common positive definite kernel functions
that conform to Mercer’s theorem are
● Linear kernel
, used for linearly separable cases, less applicable
(
,
k x y
x y
= ⋅
)
for practically complex problems;
x y
⋅
● Polynomial kernel
=
)
(
(
,
k x y
1 d
, is suitable for orthogonal normal-
ized data. The larger the parameter d , the higher the dimension of the
mapping, the more complicated the calculation, and the “over-fitting” phe-
nomenon tends to occur.
+
)
● Radial basis kernel (Gaussian kernel)
, this func-
tion is the most widely used kernel function because it has fewer parameters
and is easier to learn;
exp
γ
−
=
−
x
y
)2
(
k x y
,
)
(
DOI: 10.4236/jssm.2020.133029
438
Journal of Service Science and Management
�
J. G. Che et al.
(
(
a x y
⋅
)
)
b
(
,
k x y
)
+
=
tanh
● Sigmoid kernel
, is derived from a neural net-
work. If the Sigmoid function is used as the kernel function, the support vec-
tor machine is equivalent to a multilayer perceptron neural network.
In this paper, we use the radial basis function as the kernel function to con-
struct a non-linear support vector machine model to learn and train the
low-dimensional input after t-SNE feature extraction. Then we use the con-
structed model to make classification predictions on the test samples to effec-
tively identify which customers are most likely to order bank wealth manage-
ment products.
3. Data and Empirical Analysis
3.1. Problem Description
The data in this article comes from the real telephone marketing data collected
by Sérgio, with 20 input variables, including 15 customer attributes such as cus-
tomer age, occupation, marital status, and five social and economic attributes
such as employment change rate, consumer price index, consumer confidence
index (Moro et al., 2014). The output variable is whether the customer orders a
certain financial product (yes/no), and the detailed introduction of each variable
is shown in Table A1 in Appendix.
3.2. Data Processing
The data set has a total of 41,188 customer records, of which 4640 customers
successfully ordered the wealth management product, accounting for 11.27% of
the total. It can be seen that the traditional telephone marketing customer re-
sponse rate is very low, which brings intrusion to most customers. It is also a
waste of resources for the bank itself. By reviewing the data, there are 6 attributes
with missing values (“unknown”), as shown in Table 1.
After inspection, it is found that 79.12% of the customers in the credit default
(default) field have not experienced a credit default, and the remaining 20.87%
of the customers have an unknown default status, and only 3 customers (0.01%)
have had a credit default (see
http://archive.ics.uci.edu/ml/datasets/Bank+Marketing for a more detailed un-
derstanding of the data). Therefore, this field is filtered out during modeling.
Table 1. Attributes with missing values.
Attributes
Job
Marital
Education
Default
Housing
Loan
Number of valid records
Effective record ratio
40,858
41,108
39,457
32,591
40,198
40,198
99.2%
99.8%
95.8%
79.1%
97.6%
97.6%
439
Journal of Service Science and Management
DOI: 10.4236/jssm.2020.133029
�
J. G. Che et al.
Considering adequate samples, in order to ensure the accuracy of the model,
delete the customer records that contain missing values (unknown), and eventu-
ally retain 38,245 customer records with complete information, including 4258
(11.13%) customers successfully ordered products, 33,987 (88.87%) customers
did not order products.
Due to the imbalance between the two types of output (yes/no), the learning
process of the model will be troubled, resulting in the lack of application value of
the model prediction results. The most commonly used method to solve the
problem of class imbalance is undersampling, that is, reducing the number of
samples of a larger type, making the positive and negative samples proportion-
ally balanced. Therefore, this article keeps 4258 customer records of successfully
ordered products, randomly selects 4258 samples from 33987 samples of unor-
dered products. In the end, there were 8,516 customer records, of which 50%
were customers who ordered/not ordered this product. The input variables con-
tain 9 categorical variables, which need to be numericalized first, refer to the
variable coding method used by Miguéis et al. (2017) which represents categori-
cal variables with dummy variables. By this method, we obtain the input matrix
of 8516 × 55, and the output is a binary variable (y = yes/no).
3.3. Model Framework
Column standardization of the input variables to eliminate the influence of dif-
ferent variable dimensions, and then use the t-SNE algorithm to visualize the
dimensionality reduction operation, the default output dimension is 2. Set the
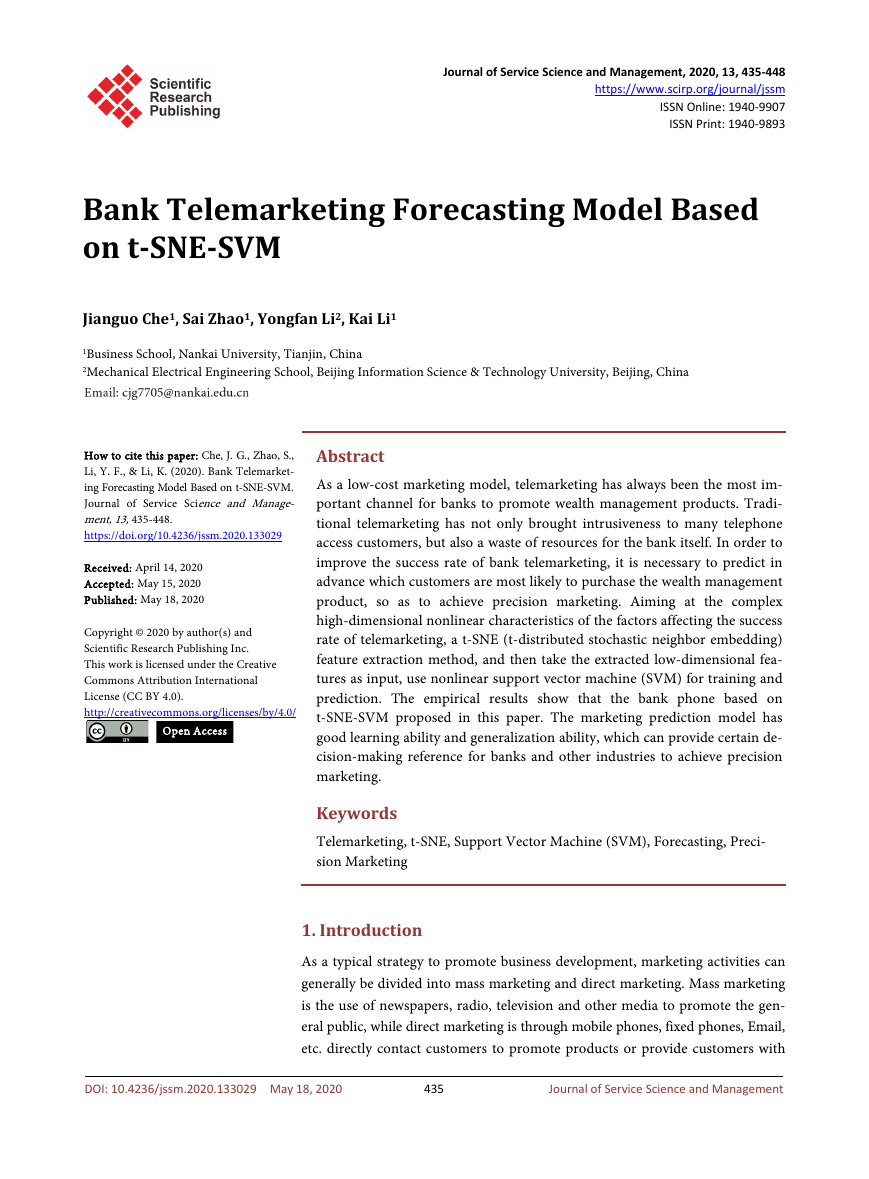
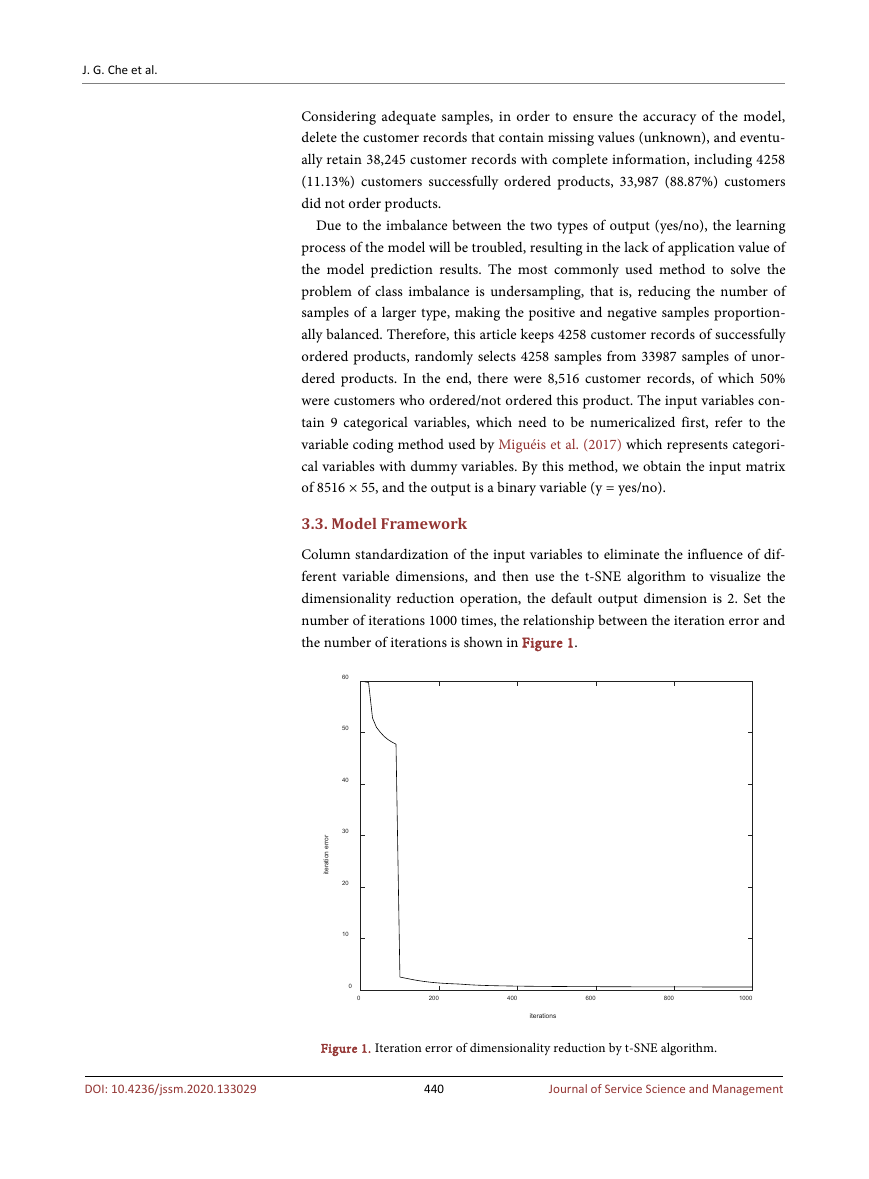
number of iterations 1000 times, the relationship between the iteration error and
the number of iterations is shown in Figure 1.
60
50
40
30
20
10
0
0
r
o
r
r
e
n
o
i
t
a
r
e
t
i
200
400
600
800
1000
iterations
DOI: 10.4236/jssm.2020.133029
Figure 1. Iteration error of dimensionality reduction by t-SNE algorithm.
440
Journal of Service Science and Management
�
J. G. Che et al.
The objective function of the t-SNE algorithm is to optimize the KL divergence
between the original space and the embedded space sample distribution, but the
KL divergence is non-convex, so iterative iterations are required to obtain the
final stable (convergent) optimal solutions. It can be seen that the error is suffi-
cient to converge after 1000 iterations, and the output result is stable and relia-
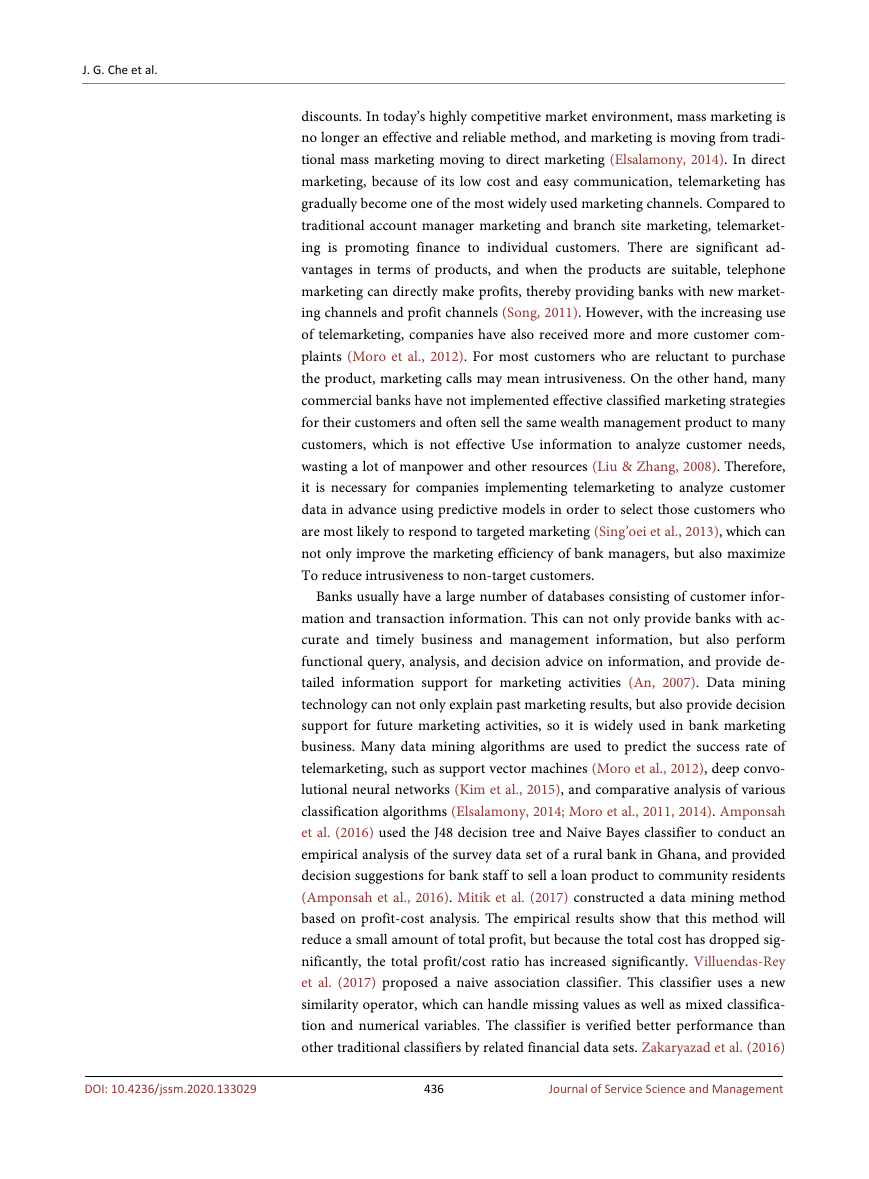
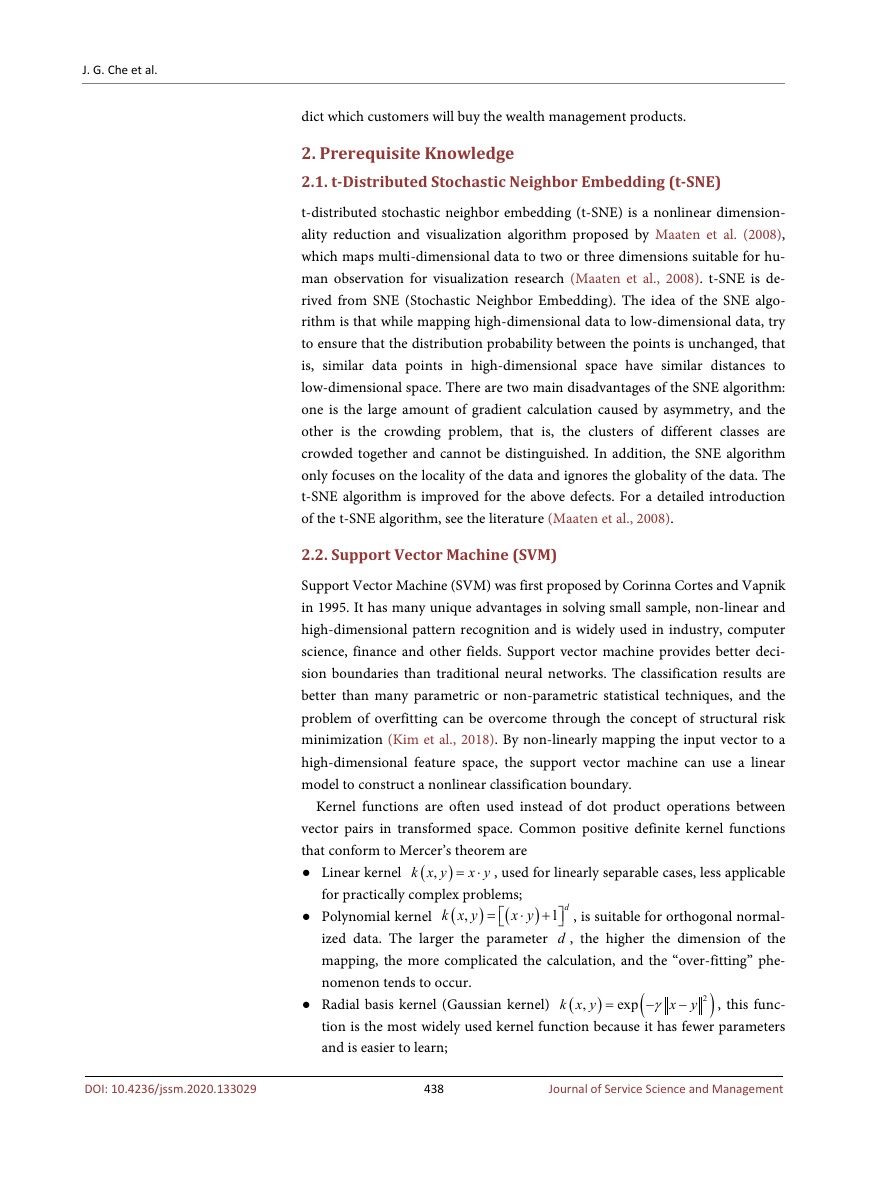
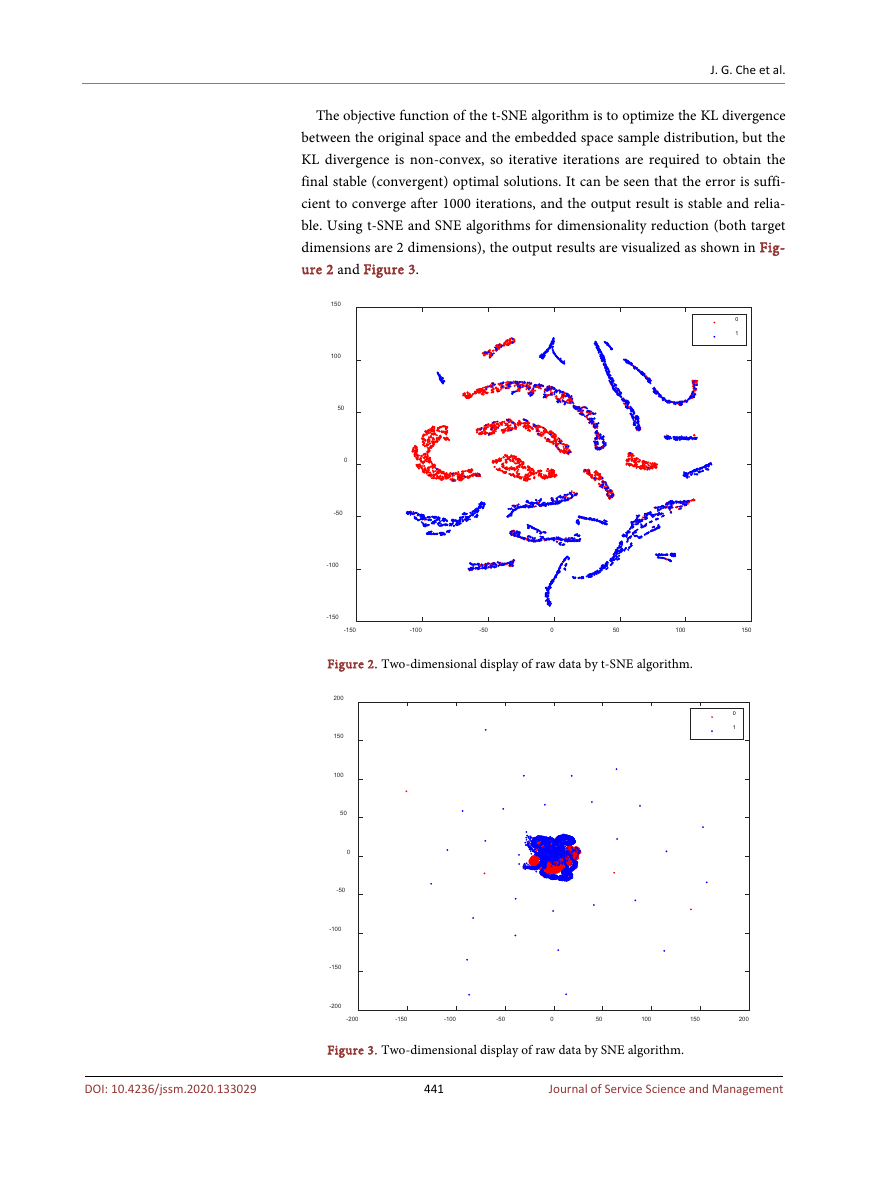
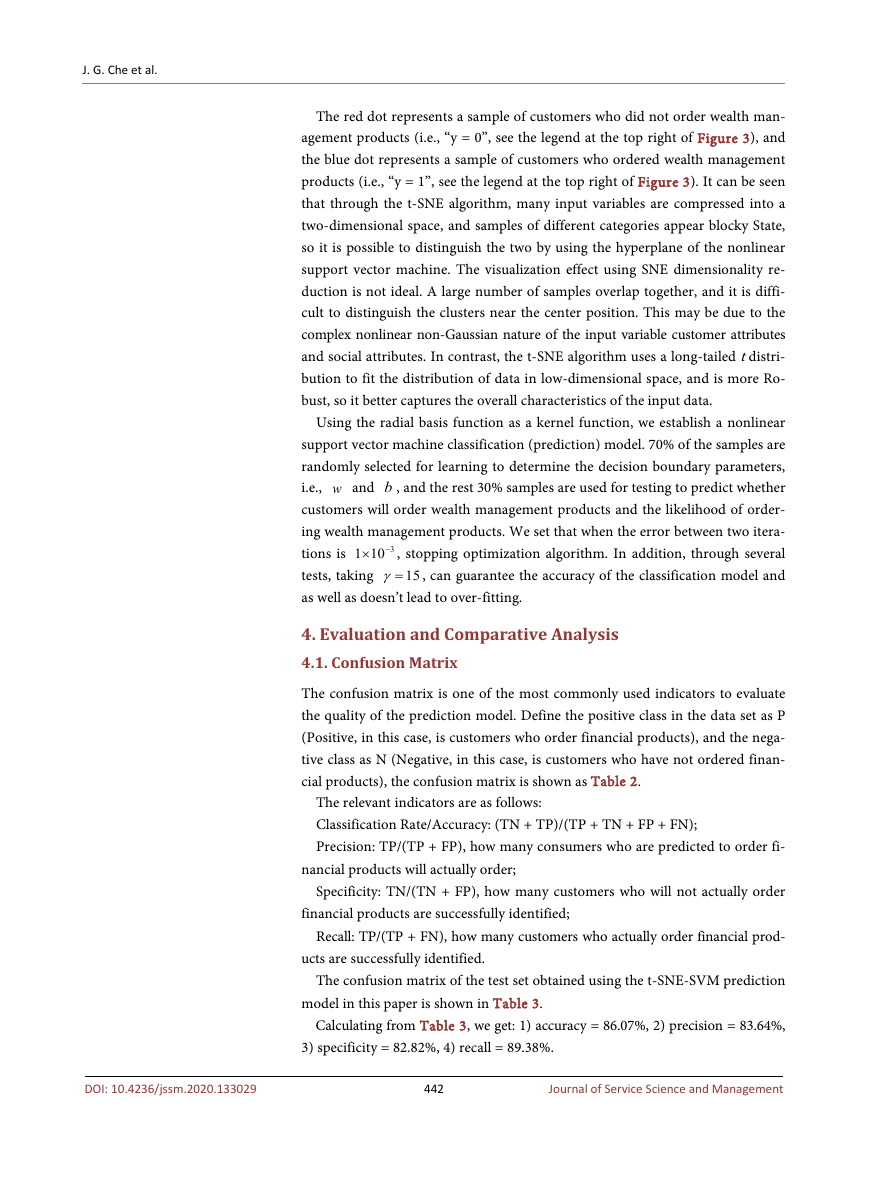
ble. Using t-SNE and SNE algorithms for dimensionality reduction (both target
dimensions are 2 dimensions), the output results are visualized as shown in Fig-
ure 2 and Figure 3.
150
100
50
0
-50
-100
-150
-150
0
1
-100
-50
0
50
100
150
Figure 2. Two-dimensional display of raw data by t-SNE algorithm.
0
1
200
150
100
50
0
-50
-100
-150
-200
-200
-150
-100
-50
0
50
100
150
200
Figure 3. Two-dimensional display of raw data by SNE algorithm.
441
Journal of Service Science and Management
DOI: 10.4236/jssm.2020.133029
�
J. G. Che et al.
The red dot represents a sample of customers who did not order wealth man-
agement products (i.e., “y = 0”, see the legend at the top right of Figure 3), and
the blue dot represents a sample of customers who ordered wealth management
products (i.e., “y = 1”, see the legend at the top right of Figure 3). It can be seen
that through the t-SNE algorithm, many input variables are compressed into a
two-dimensional space, and samples of different categories appear blocky State,
so it is possible to distinguish the two by using the hyperplane of the nonlinear
support vector machine. The visualization effect using SNE dimensionality re-
duction is not ideal. A large number of samples overlap together, and it is diffi-
cult to distinguish the clusters near the center position. This may be due to the
complex nonlinear non-Gaussian nature of the input variable customer attributes
and social attributes. In contrast, the t-SNE algorithm uses a long-tailed t distri-
bution to fit the distribution of data in low-dimensional space, and is more Ro-
bust, so it better captures the overall characteristics of the input data.
Using the radial basis function as a kernel function, we establish a nonlinear
support vector machine classification (prediction) model. 70% of the samples are
randomly selected for learning to determine the decision boundary parameters,
i.e., w and b , and the rest 30% samples are used for testing to predict whether
customers will order wealth management products and the likelihood of order-
ing wealth management products. We set that when the error between two itera-
tions is
, stopping optimization algorithm. In addition, through several
tests, taking
, can guarantee the accuracy of the classification model and
as well as doesn’t lead to over-fitting.
3
1 10−×
15γ=
4. Evaluation and Comparative Analysis
4.1. Confusion Matrix
The confusion matrix is one of the most commonly used indicators to evaluate
the quality of the prediction model. Define the positive class in the data set as P
(Positive, in this case, is customers who order financial products), and the nega-
tive class as N (Negative, in this case, is customers who have not ordered finan-
cial products), the confusion matrix is shown as Table 2.
The relevant indicators are as follows:
Classification Rate/Accuracy: (TN + TP)/(TP + TN + FP + FN);
Precision: TP/(TP + FP), how many consumers who are predicted to order fi-
nancial products will actually order;
Specificity: TN/(TN + FP), how many customers who will not actually order
financial products are successfully identified;
Recall: TP/(TP + FN), how many customers who actually order financial prod-
ucts are successfully identified.
The confusion matrix of the test set obtained using the t-SNE-SVM prediction
model in this paper is shown in Table 3.
Calculating from Table 3, we get: 1) accuracy = 86.07%, 2) precision = 83.64%,
3) specificity = 82.82%, 4) recall = 89.38%.
442
Journal of Service Science and Management
DOI: 10.4236/jssm.2020.133029
�



 2023年江西萍乡中考道德与法治真题及答案.doc
 2012年重庆南川中考生物真题及答案.doc
 2013年江西师范大学地理学综合及文艺理论基础考研真题.doc
 2020年四川甘孜小升初语文真题及答案I卷.doc
 2020年注册岩土工程师专业基础考试真题及答案.doc
 2023-2024学年福建省厦门市九年级上学期数学月考试题及答案.doc
 2021-2022学年辽宁省沈阳市大东区九年级上学期语文期末试题及答案.doc
 2022-2023学年北京东城区初三第一学期物理期末试卷及答案.doc
 2018上半年江西教师资格初中地理学科知识与教学能力真题及答案.doc
 2012年河北国家公务员申论考试真题及答案-省级.doc
 2020-2021学年江苏省扬州市江都区邵樊片九年级上学期数学第一次质量检测试题及答案.doc
 2022下半年黑龙江教师资格证中学综合素质真题及答案.doc