5
10
15
20
25
30
35
40
中国科技论文在线
http://www.paper.edu.cn
Direct Simulation of Monte Carlo of Hypersonic Shock
Interaction#
XIAO Hong, WU Di*
(School of Power and Energy, Northwestern Polytechnical University, Xi’an710072)
Abstract: Direct Simulation of Monte Carlo (DSMC) of hypersonic shock interaction was present.
Molecule models in DSMC included hard sphere, variable hard sphere and variable soft sphere.
Double-cone and Edney’s type IV shock interaction was selected in DSMC research. Comparisons
between DSMC and experiment were also conducted. Investigation of double-cone hypersonic flow
shows that three collisions models can predict the trend of pressure coefficient and standun number.
The agreement between DSMC simulation and experiment is best by hard sphere collisions model.
Investigation of type IV shock interaction shows that the agreement between DSMC simulation and
experiment is generally good in hard sphere and variable hard sphere collisions model. But it is
unsuccessfully in variable soft sphere. Both double-cone flow and type IV shock interaction simulation
shows that DSMC error depend on Kn Number and models employed for intermolecular interaction.
With the Kn number increasing, DSMC error is decreasing. The error are the smallest for hard sphere
model in comprised with variable hard sphere model and variable soft sphere model. When Kn number
exceeds8.0 ×〖10〗^(-5), DSMC error for pressure coefficient ,stanton number and scale of interaction
region is controlled within 10%.(10 Points, Times New Roman)
Key words: Mechanics; DSMC; Shock interaction; Double-cone flow; type IV shock interaction;
Experimental validation
0 Introduction
Shock interactions play an important role in hypersonic flows. In the past decade, there have
been signification efforts in computational fluid dynamics to develop prediction techniques for
simulating these complex flow structures [1][2][3]. Most these works were simulated using the
continuum transport equations (Navier-Stokes), which describe the transport of mass, momentum
and energy. These equations are based on the hypothesis that the mean free path length
of the
gas molecules is very small in comparison to a characteristic dimension L of the flow. This
dimension can be the gradient length scale as flowing.
φ
∂⎛
⎞
⎜
⎟∂⎝
x
⎠
L= /
φ
On which some flow property φ changes significantly. The dimensionless Knudsen number Kn
can be used to describe this situation:
λKn=
L
Flows with Kn > 10 are called “free molecular flows”. In this regime, inter-molecular
collisions rarely occur and the flow is completely dominated by the inter-action between the gas
and the walls. Flows in the free molecular regime can be simulated using Molecular
Dynamics(MD) or ballistic models.
In the intermediate ( 0.01 < Kn < 10 ) or rarefied regime, both collisions with solid surfaces
and with other gas molecules are important, and therefore have to be included in the simulation to
Foundations: Specialized Research Fund for the Doctoral Program of Higher Education(No.200806990021)
Brief author introduction:XIAO Hong(1978-),Male,Associate Professor,Research Field:DSMC,LBM,Hypersonic
CFD Simulation. E-mail: xhong@nwpu.edu.cn
- 1 -
�
http://www.paper.edu.cn
中国科技论文在线
obtain an accurate result. The Direct Simulation Monte Carlo(DSMC) method as developed by
Bird[6] is the only practical engineering method that can be used in the rarefied regime. The
DSMC method is also valid in free molecular and continuum regimes, although the computational
expenses become very large in the latter case. Its computational epenses, infact, scale with
Kn-4and become prohibitively large when Kn becomes lower than0.05.
In summary, one can simulate flows with Kn<0.01 using continuum based CFD models, and
flows with Kn>0.05 with particle based DSMC methods, and with 0.05
中国科技论文在线
1.1 Particles Moving
http://www.paper.edu.cn
85
In the first process, all the simulated molecules are moved through distances appropriate to
their velocity components and the discrete time-step. Appropriate action is taken if the molecule
crosses boundaries representing solid surfaces, or s symmetry boundary, or the outer boundary of
the flow. Collisions with surfaces can be treated as being either fully specula, fully diffuse, or
some combinations of the two. Secular collisions involve a simple reversal of the molecular
velocity component normal to the incident surface. Diffuse collisions cause a random reorientation
of the reflected molecule, where the post-collision velocity is based on the temperature of the
surface.
90
95
100
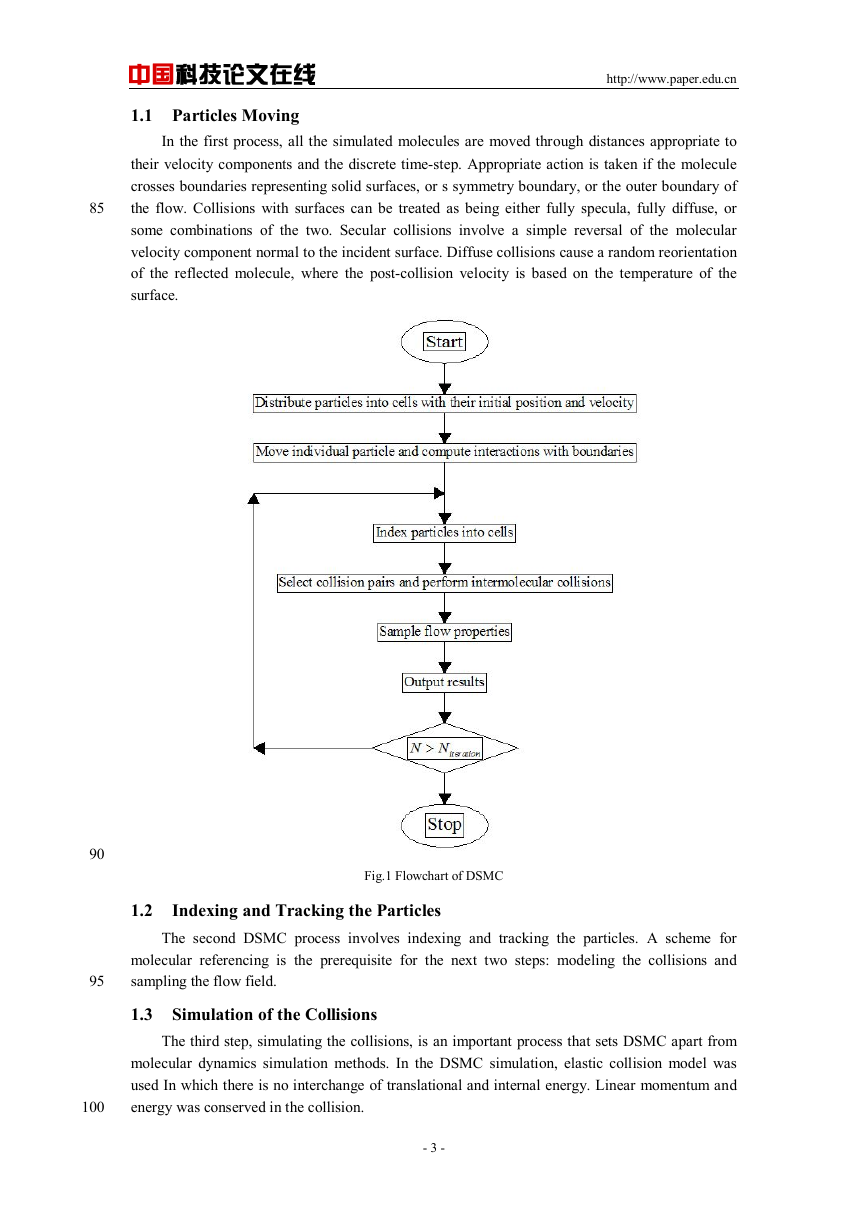
Fig.1 Flowchart of DSMC
1.2
Indexing and Tracking the Particles
The second DSMC process involves indexing and tracking the particles. A scheme for
molecular referencing is the prerequisite for the next two steps: modeling the collisions and
sampling the flow field.
1.3 Simulation of the Collisions
The third step, simulating the collisions, is an important process that sets DSMC apart from
molecular dynamics simulation methods. In the DSMC simulation, elastic collision model was
used In which there is no interchange of translational and internal energy. Linear momentum and
energy was conserved in the collision.
- 3 -
�
中国科技论文在线
1.3.1
Impact Parameters and Collision Cross-section
http://www.paper.edu.cn
The probability of a collision between two molecules in a homogenous gas is proportional to
the product of their relative speed and total collision cross-section. In DSMC, the cross-section
is specified as[9],
105
σ=
b
db
dχ χ
sin
(1)
Where, b is the distance of closest approach of undisturbed trajectories.
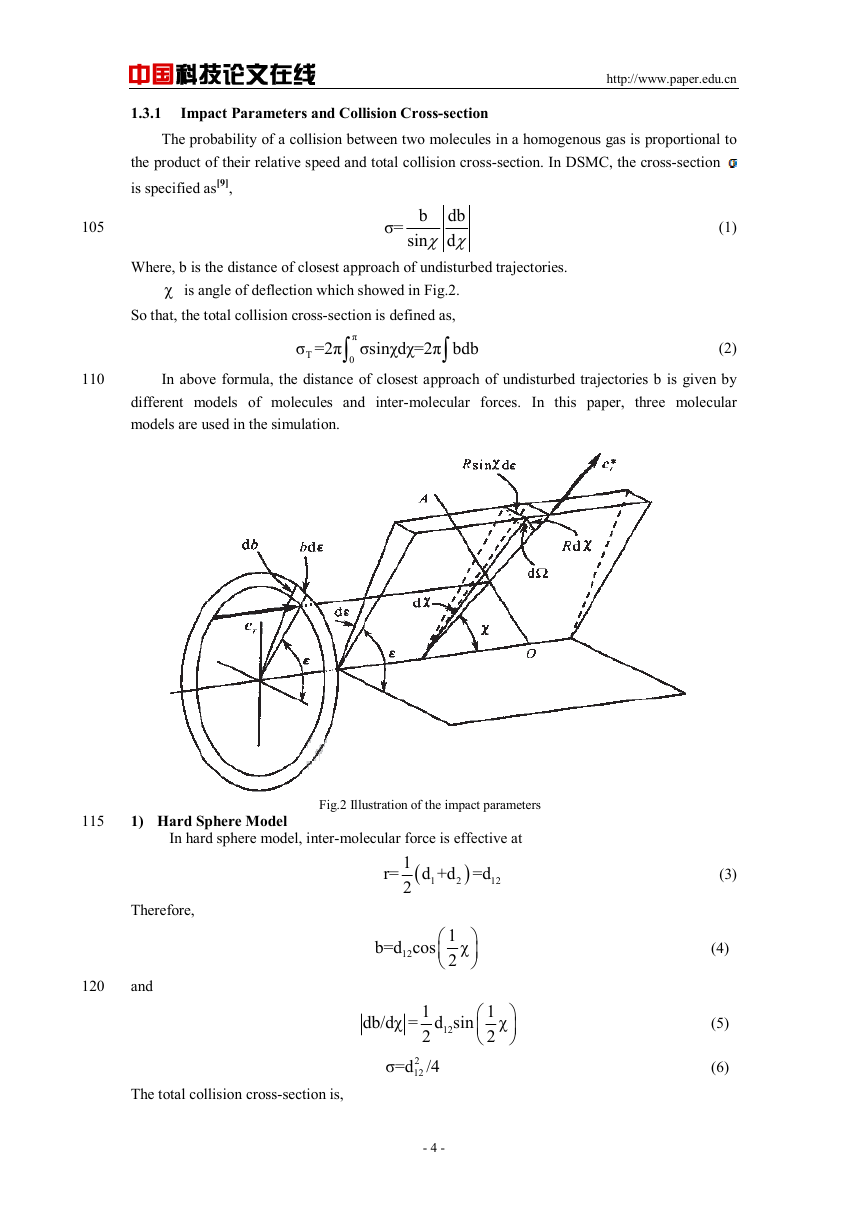
χ is angle of deflection which showed in Fig.2.
So that, the total collision cross-section is defined as,
∫
σ =2π σsinχdχ=2π bdb
T
∫
π
0
(2)
110
In above formula, the distance of closest approach of undisturbed trajectories b is given by
different models of molecules and inter-molecular forces. In this paper, three molecular
models are used in the simulation.
115
1) Hard Sphere Model
In hard sphere model, inter-molecular force is effective at
Fig.2 Illustration of the impact parameters
1r=
2
(
d +d =d
1
12
2
)
(3)
Therefore,
120
and
b=d cos
12
1
2
⎛
⎜
⎝
χ
⎞
⎟
⎠
(4)
db/dχ = d sin
12
1
2
1
2
⎛
⎜
⎝
χ
⎞
⎟
⎠
(5)
σ=d /4 (6)
2
12
The total collision cross-section is,
- 4 -
�
中国科技论文在线
http://www.paper.edu.cn
125
In HS model, molecule diameter can be calculated as,
σ =πd (7)
T
2
12
d =
5
16
⎡
⎢
⎣
(
mkT / π
ref
1/2
)
/ µ
ref
1/2
⎤
⎥
⎦
(8)
refµ is reference viscosity in the temperature at
Where,
m is the mass of molecular.
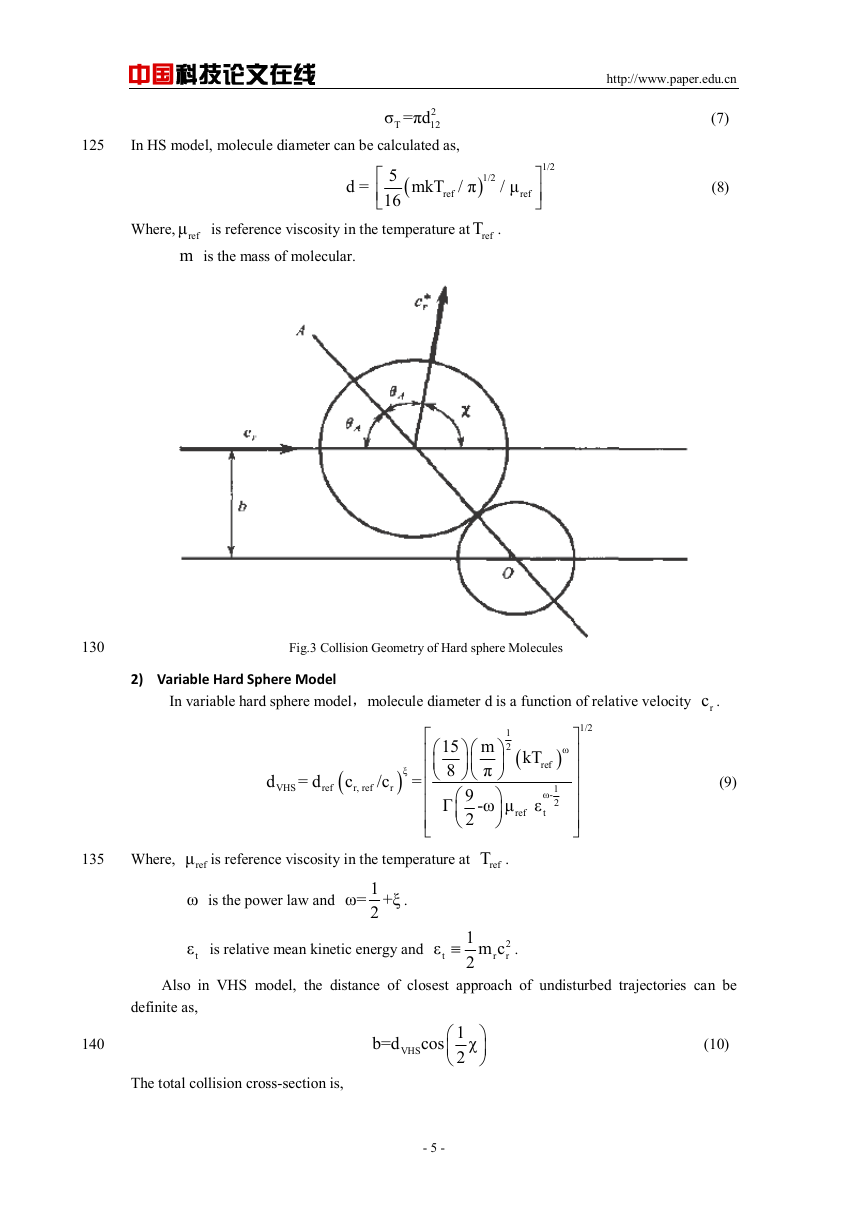
refT .
130
Fig.3 Collision Geometry of Hard sphere Molecules
rc .
2) Variable Hard Sphere Model
In variable hard sphere model,molecule diameter d is a function of relative velocity
d
VHS
= d
ref
(
c
r, ref
/c
r
ξ
)
=
⎛
⎜
⎝
⎡
⎢
⎢
⎢
⎢
⎢
⎣
15 m
⎞⎛
⎟⎜
8
π
⎠⎝
9Γ
⎛
⎜
2
⎝
⎞
⎟
⎠
⎞
⎟
⎠
-ω µ ε
ref
1
2
(
kT
ref
)
1ω-
2
t
ω
1/2
⎤
⎥
⎥
⎥
⎥
⎥
⎦
(9)
135
Where,
refµ is reference viscosity in the temperature at
refT .
ω is the power law and
1ω= +ξ
2
.
tε is relative mean kinetic energy and
ε
t
≡
1
2
m c
r
2
r
.
Also in VHS model, the distance of closest approach of undisturbed trajectories can be
definite as,
140
The total collision cross-section is,
b=d
cos
VHS
1
2
⎛
⎜
⎝
χ
⎞
⎟
⎠
(10)
- 5 -
�
中国科技论文在线
http://www.paper.edu.cn
σ =σ
T
T, ref
(
d
VHS
/d
ref
)2
(11)
σ
T, ref
is reference collision cross-section at reference molecule diameter
refd .
Where,
3)
145
Variable Soft Sphere Model
In variable soft sphere model,molecule diameter d is defined as ,
1/2
d
VVS
=
⎡
⎢
⎢
⎢
⎢
⎢
⎣
(
5 α+1 α+2
)(
kT
ref
ω
)
1
2
(
)
⎞
⎟
⎠
⎛
⎜
⎝
-ω µ ε
m
π
⎞
⎟
⎠
ref
1ω-
2
t
16αΓ
9
2
⎛
⎜
⎝
⎤
⎥
⎥
⎥
⎥
⎥
⎦
(12)
Where, α is scattering coefficient.(In case ofα=1, VSS model is same to VHS model.)
In VSS model, the distance of closest approach of undisturbed trajectories can be definite as,
b=d
α
cos
VSS
1
2
⎛
⎜
⎝
χ
⎞
⎟
⎠
(13)
150
The total collision cross-section is,
σ =πd
T
2
VSS
(14)
1.3.2 Gas-Surface Interaction
Diffuse reflection with full accommodation to the surface temperature is used in the
155
160
165
simulation. On the other hand, molecules were diffused in the condition of Maxwell distribution
at
T = T in the simulation.
W
1.4 Sampling
The final process is sampling the macroscopic flow properties. The spatial coordinates and
velocity components of molecules in a particular cell are used to calculate macroscopic quantities
at the geometric centre of the cell.
ρ = nm (14)
P = ρ c-c
(
)2
(15)
is number density of molecules.
Where,
c is velocity of molecule.
c is average velocity of molecule.
1.5 Parameters
Parameters selected in this paper are pressure coefficient and standun number.
P
2
∞
P - P
C = 1 ρV
∞
2
q
S = 1 ρV
t
3
∞
2
(16)
(17)
Where, P is the pressure of flow field.
170
P∞ is the far-field pressure of flow field.
- 6 -
�
中国科技论文在线
ρ is the density of flow field.
V∞ is the far-field velocity of flow field.
q is the thermal flux of solid surface.
http://www.paper.edu.cn
2 Hypersonic Double-cone flow Simulation
2.1 Moss’ and Boyd’ DSMC predictions for hypersonic 250/550 double-cone
flow
175
Run V∞
m / s
2612
24
2581
26
28
2520
2575
35
2621
31
32
2572
2636
33
2584
36
2566
37
38
2453
2511
6
Table1. Test case in Ref[1]
ρ∞
g/m
3
1.372
1.087
0.727
0.607
0.567
0.758
1.290
1.109
1.130
0.503
0.671
P∞
Pa
61.9
48.7
30.0
18.5
18.1
32.1
59.8
49.6
49.6
13.9
27.4
Ma
10.38
10.34
10.50
12.49
12.43
10.56
10.35
10.34
10.35
12.47
10.50
Re/ft
410×
10.4
8.35
5.83
6.74
6.08
6.01
9.71
8.48
8.67
5.83
5.39
Nose
Sharp
Sharp
Sharp
Sharp
R0.250
R0.250
R0.250
R0.250
R0.288
R0.288
R0.600
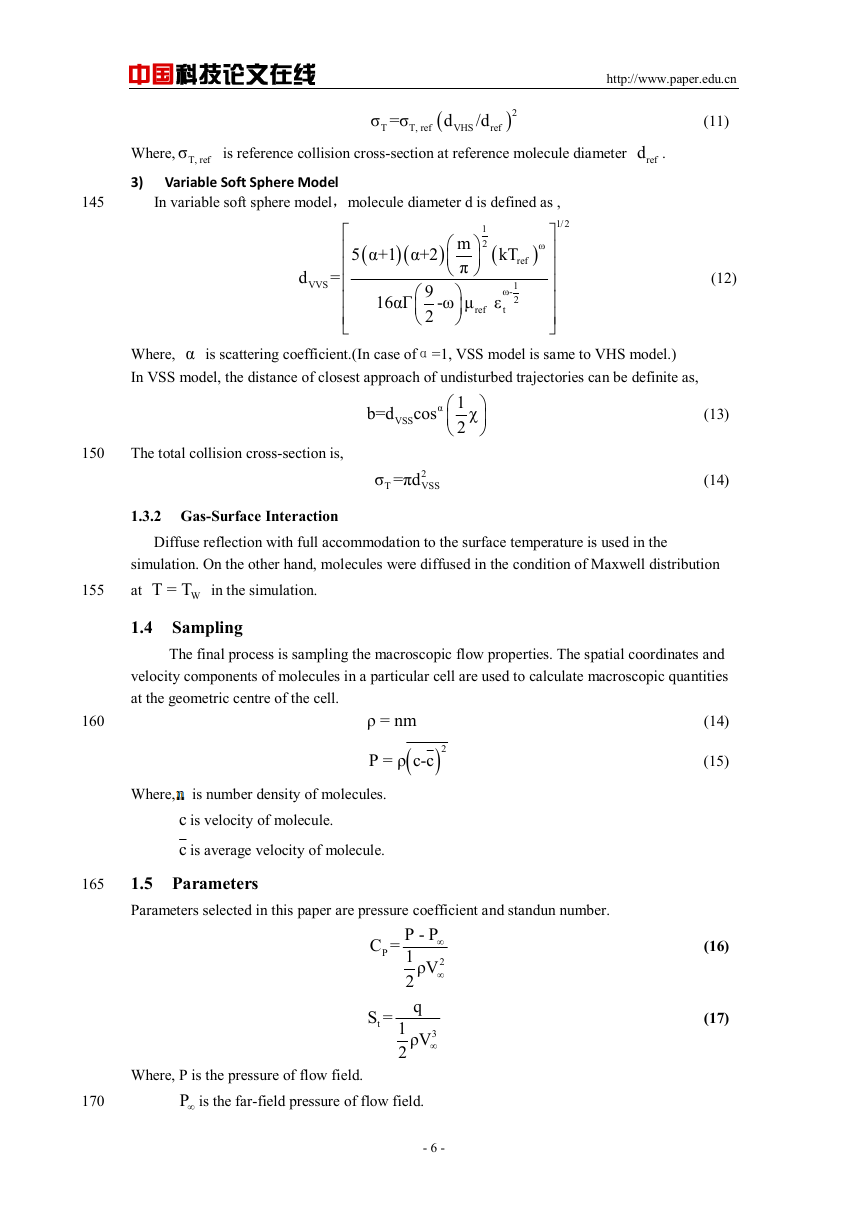
180
Fig.4 No.1 configuration Fig.5 No.2 confi 710072guration
(sharp nose 250/550 double-cone ) (R0.25 blunt nose 250/550 double-cone )
- 7 -
�
中国科技论文在线
http://www.paper.edu.cn
185
190
195
200
205
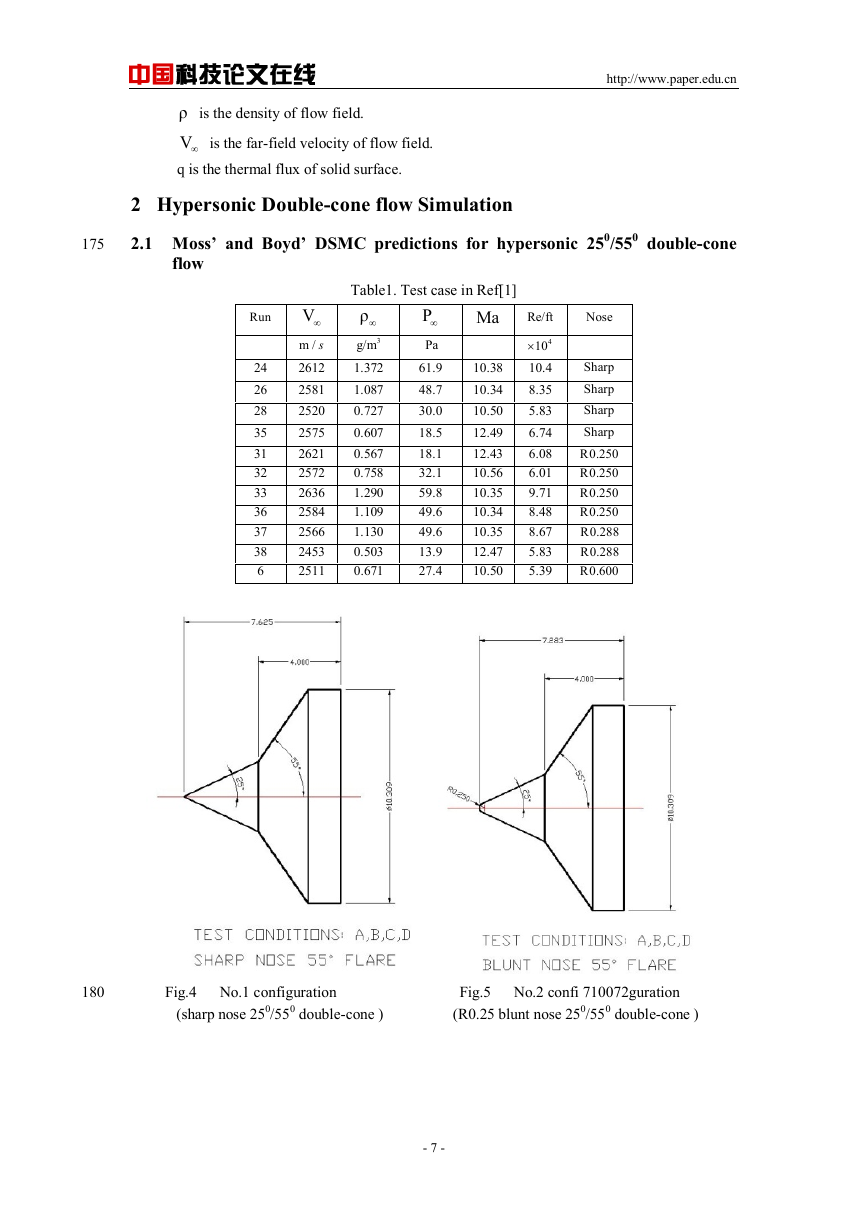
Fig.6 No.3 configuration Fig.7 No.4 configuration
(R0.288 blunt nose 250/550 double-cone ) (R0.6 blunt nose 250/550 double-cone )
For hypersonic double-cone flow simulation, three 250/550 configurations were selected in
five flow conditions to valid DSMC method. Experimental data was reported in ref[1] in
which Moss’ and Boyd’ DSMC predictions were compared with experimental data in some
experimental conditions. The following are tested 250/550 double-cone configurations in
Ref[1].( Unit of length is in)
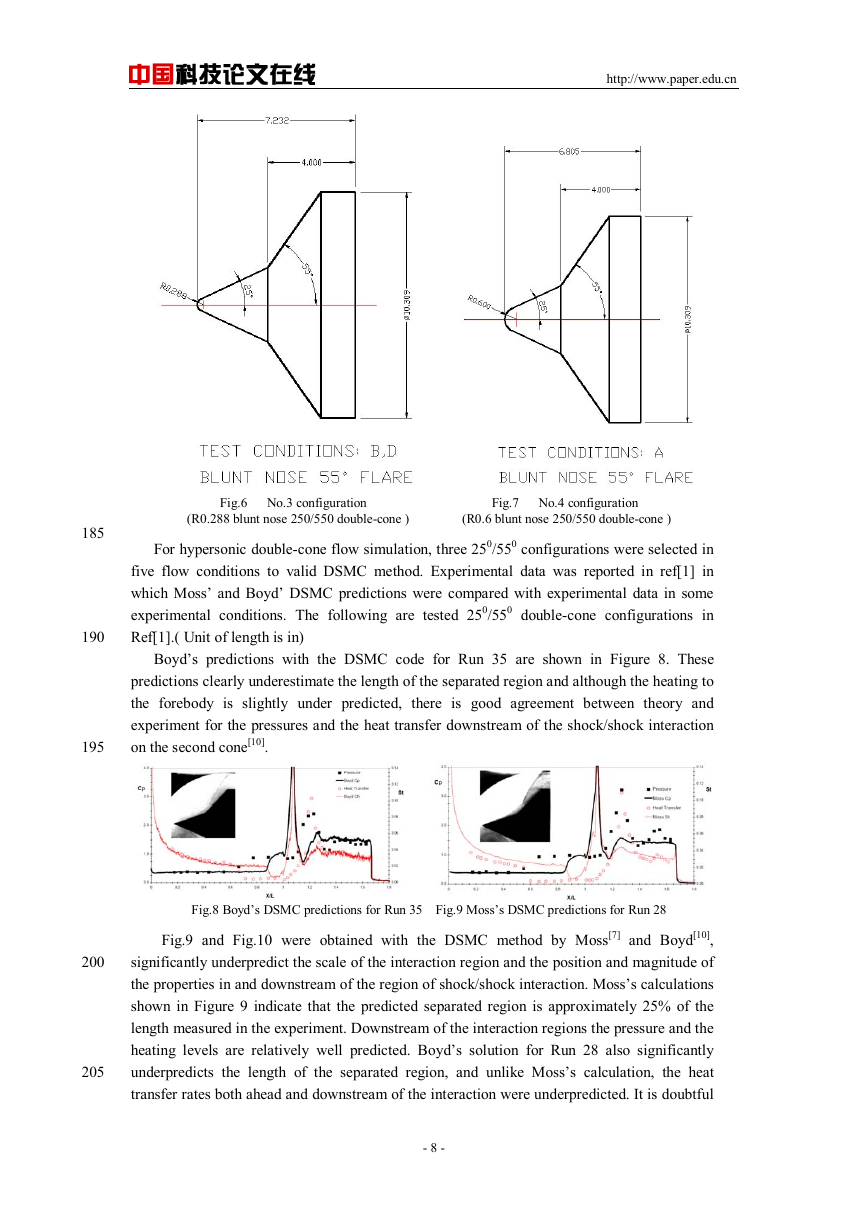
Boyd’s predictions with the DSMC code for Run 35 are shown in Figure 8. These
predictions clearly underestimate the length of the separated region and although the heating to
the forebody is slightly under predicted, there is good agreement between theory and
experiment for the pressures and the heat transfer downstream of the shock/shock interaction
on the second cone[10].
Fig.8 Boyd’s DSMC predictions for Run 35 Fig.9 Moss’s DSMC predictions for Run 28
Fig.9 and Fig.10 were obtained with the DSMC method by Moss[7] and Boyd[10],
significantly underpredict the scale of the interaction region and the position and magnitude of
the properties in and downstream of the region of shock/shock interaction. Moss’s calculations
shown in Figure 9 indicate that the predicted separated region is approximately 25% of the
length measured in the experiment. Downstream of the interaction regions the pressure and the
heating levels are relatively well predicted. Boyd’s solution for Run 28 also significantly
underpredicts the length of the separated region, and unlike Moss’s calculation, the heat
transfer rates both ahead and downstream of the interaction were underpredicted. It is doubtful
- 8 -
�


 2023年江西萍乡中考道德与法治真题及答案.doc
 2012年重庆南川中考生物真题及答案.doc
 2013年江西师范大学地理学综合及文艺理论基础考研真题.doc
 2020年四川甘孜小升初语文真题及答案I卷.doc
 2020年注册岩土工程师专业基础考试真题及答案.doc
 2023-2024学年福建省厦门市九年级上学期数学月考试题及答案.doc
 2021-2022学年辽宁省沈阳市大东区九年级上学期语文期末试题及答案.doc
 2022-2023学年北京东城区初三第一学期物理期末试卷及答案.doc
 2018上半年江西教师资格初中地理学科知识与教学能力真题及答案.doc
 2012年河北国家公务员申论考试真题及答案-省级.doc
 2020-2021学年江苏省扬州市江都区邵樊片九年级上学期数学第一次质量检测试题及答案.doc
 2022下半年黑龙江教师资格证中学综合素质真题及答案.doc