Augmented Analytics Is the Future of Data and
Analytics
Published: 27 July 2017 ID: G00326012
Analyst(s): Rita Sallam, Cindi Howson, Carlie Idoine
Augmented analytics, an approach that automates insights using machine
learning and natural-language generation, marks the next wave of disruption
in the data and analytics market. Data and analytics leaders should plan to
adopt augmented analytics as platform capabilities mature.
Key Findings
■
Augmented analytics is a next-generation data and analytics paradigm that uses machine
learning to automate data preparation, insight discovery and insight sharing for a broad range of
business users, operational workers and citizen data scientists.
■
Augmented analytics will enable expert data scientists to focus on specialized problems and on
embedding enterprise-grade models into applications. Users will spend less time exploring data
and more time acting on the most relevant insights with less bias than is the case with manual
approaches.
■ Both small startups and large vendors now offer augmented analytics capabilities that could
disrupt business intelligence (BI) and analytics, data science, data integration and embedded
analytic application vendors. Data and analytics leaders must therefore review their
investments.
■
As augmented analytics tools and capabilities become more accessible, data and analytics
leaders will need to adopt new approaches. They will also have to develop a strategy to address
the impact of augmented analytics on currently supported data and analytics capabilities, roles,
responsibilities and skills, and increase their investments in data literacy.
Recommendations
As a data and analytics leader planning to use augmented analytics for modernization, you should:
■
Launch a pilot to assess the viability of augmented analytics. Address a shortlist of business
problems that traditionally require manual, time-intensive analysis or are prone to bias.
�
■ Build trust in machine-assisted models by using expert data scientists to run them in parallel
with existing models to validate their accuracy, while fostering collaboration between expert
data scientists and citizen data scientists.
■ Monitor the augmented analytics capabilities and roadmaps of established BI and analytics,
data science and machine-learning platform vendors, startups and open-source products.
Focus on the requirements for upfront setup and data preparation, on the types of data that can
be analyzed, on the types and range of algorithms supported, and on the accuracy of findings.
Table of Contents
Strategic Planning Assumptions............................................................................................................. 3
Analysis..................................................................................................................................................3
Definition.......................................................................................................................................... 4
Description....................................................................................................................................... 5
Augmented Analytics Marks the Next Wave of Analytics Disruption............................................ 5
Preparing Data......................................................................................................................... 11
Finding Patterns in Data............................................................................................................14
Sharing and Operationalizing Findings From Data..................................................................... 20
Adoption Rate................................................................................................................................ 24
Risks.............................................................................................................................................. 26
Evaluation Factors.......................................................................................................................... 28
Recommendations......................................................................................................................... 30
Representative Vendors..................................................................................................................31
Gartner Recommended Reading.......................................................................................................... 35
List of Tables
Table 1. Examples of Augmented Data Discovery Vendors and Their Capabilities................................. 33
List of Figures
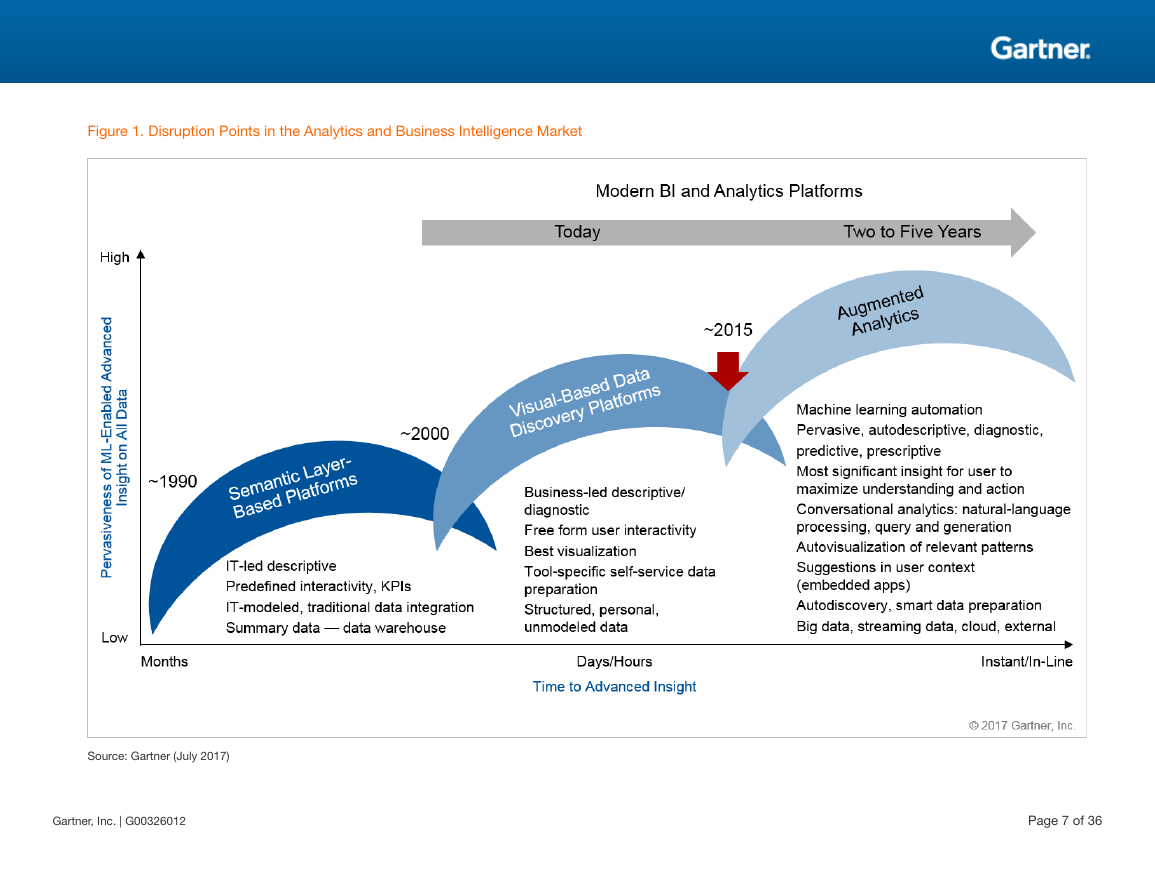
Figure 1. Disruption Points in the Analytics and Business Intelligence Market..........................................7
Figure 2. What Drives Student Earnings?................................................................................................9
Figure 3. Current Data Analytics Workflow............................................................................................ 10
Figure 4. Emerging Augmented Analytics Workflow.............................................................................. 11
Figure 5. Use of Machine Learning to Harmonize Complex and Difficult Datasets................................. 13
Figure 6. Smart Self-Service Data Preparation...................................................................................... 14
Page 2 of 36
Gartner, Inc. | G00326012
�
Figure 7. How Augmented Data Discovery and Augmented Data Science Platforms Differ................... 16
Figure 8. Automated Machine Learning Uncovers Loan Default Drivers................................................ 18
Figure 9. Smart Visualization.................................................................................................................19
Figure 10. Smart Labeling Automatically Focuses Users on Outliers (1).................................................20
Figure 11. Smart Labeling Automatically Focuses Users on Outliers (2).................................................20
Figure 12. Dynamic Narration of the Load Time Analysis...................................................................... 22
Figure 13. Adoption Across the Analytics Spectrum............................................................................. 24
Figure 14. Augmented Data Discovery Embedded in a Sales Application..............................................25
Strategic Planning Assumptions
By 2020, due largely to the automation of data science tasks, citizen data scientists will surpass
data scientists in terms of the amount of advanced analysis they produce and the value derived
from it.
By 2020, augmented analytics — a paradigm that includes natural-language query and narration,
augmented data preparation, automated advanced analytics and visual-based data discovery
capabilities — will be a dominant driver of new purchases of business intelligence, analytics and
data science and machine learning platforms and of embedded analytics.
By 2020, the number of users of modern business intelligence and analytics platforms that are
differentiated by augmented data discovery capabilities will grow at twice the rate — and deliver
twice the business value — of those that are not.
By 2020, natural-language generation and artificial intelligence will be a standard feature of 90% of
modern BI platforms.
By 2020, 50% of analytical queries will be generated via search, natural-language processing or
voice, or will be automatically generated.
By 2020, organizations that offer users access to a curated catalog of internal and external data will
derive twice as much business value from analytics investments as those that do not.
Through 2020, the number of citizen data scientists will grow five times faster than the number of
expert data scientists.
Analysis
Analytics, the core of digital business, is at a critical inflection point. Across the analytics stack,
tools have become easier to use and more agile, enabling greater access and self-service. And yet
organizations' processes for preparing data for analysis, analyzing data, building advanced analytics
models, interpreting results and telling stories with data remain largely manual and prone to bias.
Gartner, Inc. | G00326012
Page 3 of 36
�
Data volumes are increasing and becoming more complex to optimize cross-functional digital
business decisions. As a result, the number of variables driving an outcome or best action is
growing to the point where exploring every possible pattern and determining the most relevant and
actionable findings is either impossible or impractical using current manual approaches, which
leaves business people and analysts increasingly prone to confirmation bias. They often resort to
exploring their own biased hypotheses, miss key findings, and draw incorrect or incomplete
conclusions, which adversely affects decisions and outcomes. Furthermore, data science modeling,
which is also largely manual, requires specialist skills that are in short supply at time when insights
from advanced analytics must be pervasive to fuel digital business transformation.
There is hope, however. A new paradigm — augmented analytics — has emerged. Central to this
development is the use of machine-learning automation to augment human intelligence and
contextual awareness across the entire data and analytics workflow — from data to insight, to
action, to impact the entire data management, BI and analytics, and data science and machine
learning analytic workflow. Augmented analytics will be crucial for delivering unbiased decisions and
impartial contextual awareness. It will transform how users interact with data, and how they
consume and act on insights.
We are already seeing augmented analytics features make their way into modern BI and analytics
and data science and machine learning platforms. This is happening largely in response to
disruptive innovations from startups such as BeyondCore (acquired by Salesforce in 2016 and
rebranded Salesforce Einstein Discovery, a part of the Salesforce Einstein Analytics portfolio) and
DataRobot, as well as from traditional BI vendors like IBM (with IBM Watson Analytics). The same is
happening to self-service data preparation platforms, where machine-learning augmented data
preparation vendors such as Paxata, Trifacta and UniFi are driving innovation.
Definition
Augmented analytics includes:
■ Augmented data preparation, which uses machine-learning automation to augment data
profiling and data quality, harmonization, modeling, manipulation, enrichment, metadata
development and cataloging.
■ Augmented data discovery (formerly "smart data discovery"), which enables business
people and citizen data scientists to use machine learning to automatically find, visualize and
narrate relevant findings (such as correlations, exceptions, clusters, links and predictions)
without having to build models or write algorithms. Users explore data via visualizations, search
and natural-language query technologies, supported by natural-language-generated narration
for interpretation of results. It can be used by citizen data scientists to analyze data without
preconceived notions for early prototyping and hypothesis development with less manual
experimentation. Consequently, highly skilled data scientists have more time to focus on
building and operationalizing the most relevant models.
■ Augmented data science and machine learning, which automates key aspects of advanced
analytic modeling, such as feature selection. This reduces the requirement for specialized skills
to generate, operationalize and manage an advanced analytics model.
Page 4 of 36
Gartner, Inc. | G00326012
�
Many autogenerated and human-augmented machine-learning models created through augmented
analytics will also be embedded in enterprise applications — for example, those of the HR, finance,
sales, marketing, customer service, procurement and asset management departments — to
optimize the decisions and actions of all employees, not just those of analysts and data scientists.
Augmented analytics will also be a key feature of conversational analytics. This is an emerging
paradigm that enables business people to generate queries, explore data, and receive and act on
insights in natural language (voice or text) via mobile devices and personal assistants. For example,
instead of accessing a daily dashboard, a decision maker with access to Amazon Alexa might say,
"Alexa, analyze my sales results for the past three months!" or "Alexa, what are the top three things
I can do to improve my close rate today?"
Conversational analytics applications are not yet available "out of the box," and early integrations
are immature. Analytics vendors are using APIs and building integrations with the help of partners to
make these applications easier to deploy. We expect out-of-the-box and enterprise-ready instances
to appear over the next two to five years (see "Hype Cycle for Business Intelligence and Analytics,
2017").
Description
This document explores augmented analytics capabilities and their ramifications for organizational
and market disruption. It provides guidance to data and analytics leaders planning to adopt these
capabilities in order to modernize and to drive digital transformation and innovation.
Augmented Analytics Marks the Next Wave of Analytics Disruption
Over the past 10 years, visual-based data discovery tools have disrupted the traditional BI market.
These easy-to-use tools enable users to assemble data rapidly, explore hypotheses visually, and
find new insights in data. They have transformed how business users explore data, in comparison
with the IT-centric, semantic-layer-based approach of traditional BI platforms. Even so, many
activities associated with preparing data, finding patterns in large, complex combinations of data,
and sharing insights with others remain highly manual and prone to bias.
Although visual-based data discovery tools are easy to use, because users analyze data manually
by creating queries to investigate hypotheses, it is not possible for them to explore every possible
pattern and combination, let alone determine whether their findings are the most relevant,
significant and actionable. Relying on business users to find patterns manually may result in them
exploring their own biased hypotheses, missing key findings, and drawing their own incorrect or
incomplete conclusions, which may adversely affect decisions and outcomes.
That "a picture is worth a thousand words" has long been assumed in the field of data and
analytics. And rightfully so, as visualizations are a powerful and consumable way to find and
communicate patterns in data (more so than tables or lists). However, they do not always highlight
statistically significant findings. That requires user interpretation or further statistical analysis to
determine whether findings are relevant, significant and actionable. Moreover, finding insights from
Gartner, Inc. | G00326012
Page 5 of 36
�
advanced analytics — a key aspirational goal for most companies as they undertake the transition
to digital business — requires expert data science skills, which are extremely scarce.
Whereas manual interactive exploration using visualizations is the defining feature of visual-based
data discovery platforms, machine-learning automation of the insight discovery and exploration
process is a defining feature of augmented analytics in next-generation data and analytics platforms
(see Figure 1). It enables business users and citizen data scientists to automatically find, visualize
and narrate relevant findings, such as correlations, exceptions, clusters and predictions, without
having to build models or write algorithms. Users explore data via visualizations, search and natural-
language query technologies, supported by text- and voice-based natural-language-generated
narration and interpretation of results or the most statistically important findings in the user's
context. We are beginning to see these capabilities emerge in some existing data integration, BI and
analytics, and data science and machine-learning platforms, largely in response to, and as
imitations of, the innovations of disruptive startups (see the Representative Vendors section below).
Augmented analytics can reduce time-consuming exploration and the identification of false or less
relevant insights. Applying a range of algorithms and ensemble learning to data in parallel, and
explaining actionable findings to users, reduces the risk of missing important insights in the data, in
comparison to manual exploration. It also optimizes resulting decisions and actions. This paradigm
shift requires investment in data literacy throughout organizations, as insights are distributed to all
employees.
Page 6 of 36
Gartner, Inc. | G00326012
�
Figure 1. Disruption Points in the Analytics and Business Intelligence Market
Source: Gartner (July 2017)
Gartner, Inc. | G00326012
Page 7 of 36
�
Case study: How Salesforce Einstein Discovery showed that attendance at a top university is not
the main predictor of high earning power:
■
At Gartner's 2016 "BI Bake-Off" at the Data and Analytics Summit in Dallas, Texas, we gave
representatives of several modern BI and analytics platform vendors university and college
student demographic data, payroll data and a demo script. In addition to showcasing functional
differences across critical capabilities, we asked them to combine the datasets and derive
insights about which university graduates would have the most earning power 10 years after
graduation. Given the number of variables and combinations available to explore manually, the
representatives did what expert analysts typically do. They explored their own hypotheses first.
In this case, it was the "usual suspects" of leading universities — "because going to Harvard
means you out-earn those going to state universities, right?" While there was a relationship in
the data between attendance at top universities and earning power, all missed the most
important driver, one that is not intuitive. The biggest indicator of students' future earning power
in the data was not their university. It was their parents' income, and secondarily whether they
completed their degrees. We cannot say precisely why this is. Is it due to work and study habits
learned at home from high-performing parents? Is it because wealthier parents can pay for their
children to finish college, even if that means it takes five or six years? We can, however, say that
parental income was not a driver that the respondents knew to look for.
■ By contrast, although we gave all the vendors in the vendor exhibit hall the same dataset, only
Salesforce Einstein Discovery uncovered the main driver after just a few seconds of ingesting
the data, automatically analyzing it and generating a narrative about the results (see Figure 2).
How often do business people draw suboptimal conclusions from their data? How often do they
explore what they think are the key drivers or attributes of an outcome variable and stop when they
confirm their hypotheses? How many times might there be other more important factors affecting
the outcome variable that they have not thought to explore? This is the root of the challenge with
the current paradigm. The desire to overcome it will drive the transformational nature of the next
wave of market disruption, namely automation of all aspects of the analytics workflow in order to
improve the accuracy and timeliness of advanced analysis (in light of the human context), remove
bias, and elevate the skills of more users to citizen data scientists.
Since automation will enable expert data scientists to focus on specialized problems and on
operationalizing and embedding enterprise-grade models into applications, only the most accurate
and significant insights will be acted on by users. Expanded use of automation should also translate
into fewer errors from the bias inherent in manual exploration.
Page 8 of 36
Gartner, Inc. | G00326012
�




 2023年江西萍乡中考道德与法治真题及答案.doc
 2012年重庆南川中考生物真题及答案.doc
 2013年江西师范大学地理学综合及文艺理论基础考研真题.doc
 2020年四川甘孜小升初语文真题及答案I卷.doc
 2020年注册岩土工程师专业基础考试真题及答案.doc
 2023-2024学年福建省厦门市九年级上学期数学月考试题及答案.doc
 2021-2022学年辽宁省沈阳市大东区九年级上学期语文期末试题及答案.doc
 2022-2023学年北京东城区初三第一学期物理期末试卷及答案.doc
 2018上半年江西教师资格初中地理学科知识与教学能力真题及答案.doc
 2012年河北国家公务员申论考试真题及答案-省级.doc
 2020-2021学年江苏省扬州市江都区邵樊片九年级上学期数学第一次质量检测试题及答案.doc
 2022下半年黑龙江教师资格证中学综合素质真题及答案.doc