Contents at a Glance
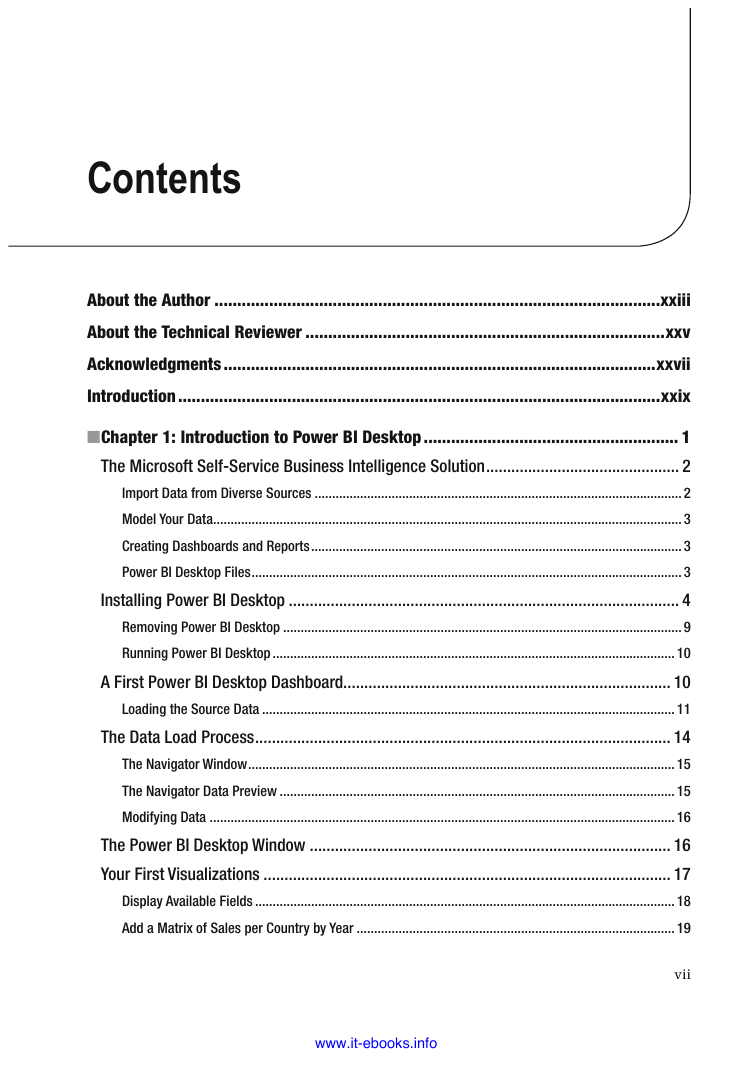
Contents
About the Author
About the Technical Reviewer
Acknowledgments
Introduction
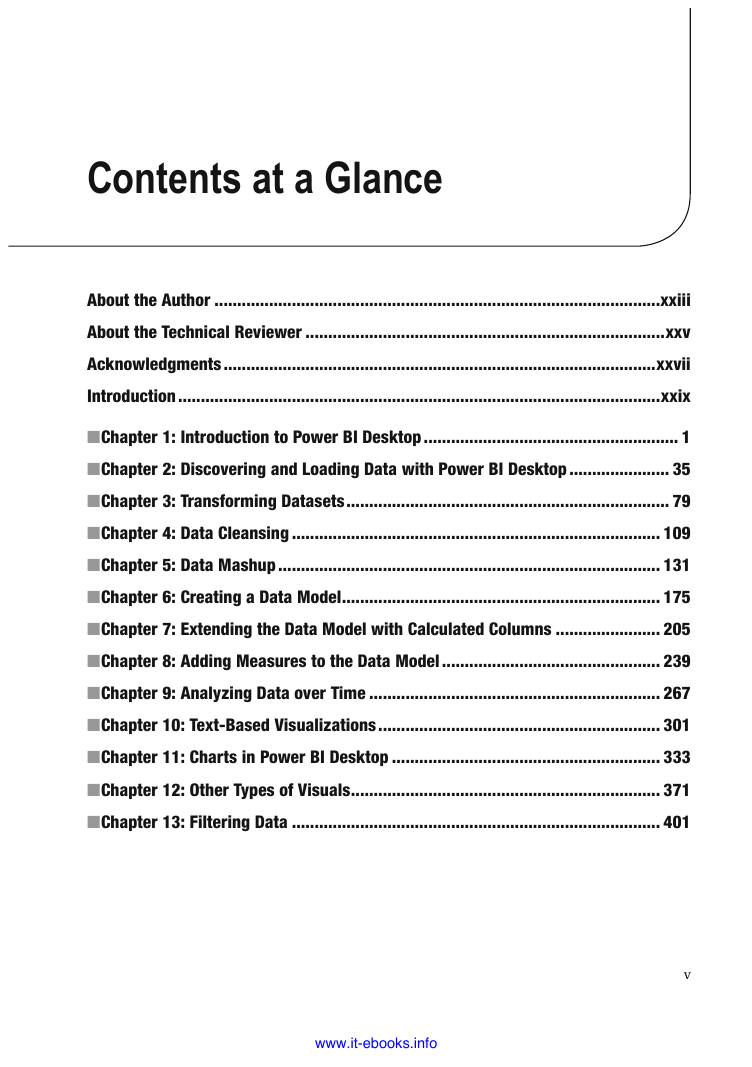
Chapter 1: Introduction to Power BI Desktop
The Microsoft Self-Service Business Intelligence Solution
Import Data from Diverse Sources
Model Your Data
Creating Dashboards and Reports
Power BI Desktop Files
Installing Power BI Desktop
Removing Power BI Desktop
Running Power BI Desktop
A First Power BI Desktop Dashboard
Loading the Source Data
The Data Load Process
The Navigator Window
The Navigator Data Preview
Modifying Data
The Power BI Desktop Window
Your First Visualizations
Display Available Fields
Add a Matrix of Sales per Country by Year
Add a Column Chart of Delivery Charge by Model
Add a Map of Labor Cost by Country
Add a Card Showing the Total Cost of Spare Parts
Add a Slicer by Make
Arranging the Dashboard
Moving a Visualization
Resizing a Visualization
Interactivity in Dashboards
Creating and Modifying Reports
Adding Pages
Renaming Pages
Deleting Pages
Moving Pages
Duplicating Pages
Scrolling through Collections of Pages
Importing Excel and Power View Items
Conclusion
Chapter 2: Discovering and Loading Data with Power BI Desktop
Data Sources
File Sources
Databases
Azure
Other Sources
Loading Data
Web Pages
CSV Files
What Is a CSV File?
Text Files
XML Files
Excel
Microsoft Access Databases
Relational Databases: SQL Server
Automatically Loading Related Tables
Database Options
Server Connection
Searching for Databases, Tables, and Views in Navigator
Database Security
Using an SQL Statement
Microsoft SQL Server Analysis Services Data Sources
Analysis Services Cube Tools
Add Items
Collapse Columns
Microsoft SQL Server Analysis Services Tabular Data Sources
Other Data Sources
Reusing Recent Data Sources
Reusing a Data Source
Pinning a Data Source
Refreshing Data
Refreshing a Query
Refreshing All the Queries in a Power BI Desktop File
Old Data
Connection Security
Conclusion
Chapter 3: Transforming Datasets
Power BI Desktop Queries
Editing Data After a Data Load
Transforming Data Before Loading
Query or Load?
The Power BI Desktop Query Editor
The Applied Steps List
Renaming a Step
Deleting a Step
The Power BI Desktop Query Editor Ribbons
The Home Ribbon
The Transform Ribbon
The Add Column Ribbon
The View Ribbon
Dataset Shaping
Renaming Columns
Reordering Columns
Removing Columns
Merging Columns
Removing Records
Keep Rows
Remove Rows
Remove Blank Rows
Removing Duplicate Records
Sorting Data
Reversing the Row Order
Filtering Data
Selecting Specific Values
Finding Elements in the Filter List
Filtering Text Ranges
Filtering Numeric Ranges
Filtering Date and Time Ranges
Filtering Data
Conclusion
Chapter 4: Data Cleansing
Viewing a Full Record
Power BI Desktop Query Editor Context Menus
Changing Data Type
Detecting Data Types
Replacing Values
Transforming Column Contents
Text Transformation
Removing Leading and Trailing Spaces
Number Transformations
Calculating Numbers
Date Transformations
Time Transformations
Duration
Filling Down
Using the First Row As Headers
Grouping Records
Conclusion
Chapter 5: Data Mashup
The Power BI Desktop View Ribbon
Extending Data
Duplicating Columns
Splitting Columns
Splitting Column by a Delimiter
Splitting Columns by Number of Characters
Merging Columns
Custom Columns
Index Columns
Merging Data
Adding Data
Aggregating Data During a Merge Operation
Types of Join
Use the Original Column Name As the Prefix
Search Columns to Expand
Joining on Multiple Columns
Preparing Datasets for Joins
Correct and Incorrect Joins
The Columns Do Not Map
The Columns Map, but the Result Is a Massive Table with Duplicate Records
Examining Joined Data
The Expand and Aggregate Buttons
Appending Data
Adding the Contents of One Query to Another
Adding Multiple Files from a Source Folder
Changing the Data Structure
Unpivoting Tables
Pivoting Tables
Transposing Rows and Columns
Managing the Transformation Process
Modifying a Step
Renaming a Step
Deleting a Step or a Series of Steps
Adding a Step
Altering Process Step Sequencing
An Approach to Sequencing
Error Records
Removing Errors
Managing Queries
Organizing Queries
Grouping Queries
Create a New Group
Add a Query to a Group
Duplicating Queries
Referencing Queries
Add a Column As a New Query
Enable Data Load
Enable Data Refresh
Pending Changes
Copying Data from Power BI Desktop
Conclusion
Chapter 6: Creating a Data Model
Data Modeling in the Power BI Desktop Environment
The Power BI Desktop Data View
Data Model or Query?
The Power BI Desktop Data View Ribbons
The Modeling Ribbon
Managing Power BI Desktop Data
Manipulating Tables
Renaming Tables
Deleting a Table
Selecting a Column from the List of Available Column Names
Manipulating Columns
Renaming a Column
Deleting Columns
Moving Columns
Setting Column Widths
Power BI Desktop Data Types
Formatting Power BI Desktop Data
Currency Formats
Preparing Data for Dashboards
Categorize Data
Apply a Default Summarization
Define Sort by Columns
Sorting Data in Power BI Desktop Tables
Adding Hierarchies
Designing a Power BI Desktop Data Model
Data View and Relationship View
Relationship View Display Options
Maximizing a Table
Minimizing a Table
Creating Relationships
Creating Relationships Manually
Creating Relationships Automatically
Deleting Relationships
Managing Relationships
Deactivating Relationships
Advanced Relationship Options
Conclusion
Chapter 7: Extending the Data Model with Calculated Columns
Types of Calculations
New Columns
Naming Columns
Concatenating Column Contents
Tweaking Text
Simple Calculations
Math Operators
Rounding Values
Calculating Across Tables
Choosing the Correct Table for Linked Calculations
Cascading Column Calculations
Refreshing Data
Using Functions in New Columns
Safe Division
Counting Reference Elements
Statistical Functions
Applying a Specific Format to a Calculation
Simple Logic: the IF() Function
Exception Indicators
Creating Alerts
Comparison Operators
Flagging Data
Nested IF() Functions
Creating Custom Groups Using Multiple Nested IF() Statements
Multiline Formulas
Complex Logic
DAX Logical and Information Functions
Logical Operators
Formatting Logical Results
Making Good Use of the Formula Bar
Conclusion
Chapter 8: Adding Measures to the Data Model
A First Measure: Number of Cars Sold
Basic Aggregations in Measures
Using Multiple Measures
Cross-Table Measures
More Advanced Aggregations
Filter Context
Row Context
Query Context
Filter Context
Filtering Data in Measures
Simple Filters
Text Filters
Numeric Filters
More Complex Filters
Multiple Criteria in Filters
Using Multiple Filters
Calculating Percentages of Totals
A Simple Percentage
Removing Multiple Filter Elements
Visual Totals
The ALLEXCEPT() Function
Filtering on Measures
Displaying Rank
A Few Comments and Notes on Using Measures
Calculation Options
Conclusion
Chapter 9: Analyzing Data over Time
Simple Date Calculations
Date and Time Formatting
Calculating the Age of Cars Sold
Calculating the Difference Between Two Dates
Adding Time Intelligence to a Data Model
Creating and Applying a Date Table
Creating the Date Table
Adding Sort By Columns to the Date Table
Date Table Techniques
Adding the Date Table to the Data Model
Applying Time Intelligence
YearToDate, QuarterToDate, and MonthToDate Calculations
Analyze Data As a Ratio over Time
Comparing a Metric with the Result from a Range of Dates
Comparisons with Previous Time Periods
Calculating Sales for the Previous Year
Comparison with a Parallel Period in Time
Comparing Data from Previous Years
Comparing with the Same Date Period from a Different Quarter, Month, or Year
Rolling Aggregations over a Period of Time
Conclusion
Chapter 10: Text-Based Visualizations
Power BI Desktop Dashboards
Switching to Report View
Tables
Creating a Basic Table
Deleting a Table
Copying a Table
Changing the Table Size and Position
Resizing a Table
Moving a Table
Changing Column Order
Removing Columns from a Table
Types of Data
Enhancing Tables
Row Totals
Formatting Columns of Numbers
Font Sizes in Tables
Changing Column Widths
Adding and Formatting Titles
Modifying the Table Background
Table Borders
Sorting by Column
Table Granularity
Creating a Matrix
Row Matrix
Column Matrix
Sorting Data in Matrices
Cards
Formatting Cards
Multirow Cards
Formatting Multirow Cards
Switching Between Table Types
Conclusion
Chapter 11: Charts in Power BI Desktop
A First Chart
Creating a First Chart
Deleting a Chart
Basic Chart Modification
Basic Chart Types
Column Charts
Line Charts
Pie Charts
Essential Chart Adjustments
Resizing Charts
Repositioning Charts
Sorting Chart Elements
Donut Charts
Funnel Charts
Multiple Data Values in Charts
100% Stacked Column and Bar Charts
Scatter Charts
Scatter Charts to Display Flattened Hierarchies
Bubble Charts
Waterfall Charts
Dual-Axis Charts
Line and Clustered Column Chart
Line and Stacked Column Chart
Data Details
Drill Down
Enhancing Charts
Chart Legends
Legend Display
Legend Position
Title Display
Chart Title
Chart Data Labels
Chart Background
Data Colors
Axis Modification
Modifying the X Axis
Modifying the Y Axis
Chart Borders
Chart Aspect Ratio
Bubble Chart Play Axis
Conclusion
Chapter 12: Other Types of Visuals
Maps
Bing Maps
Maps in Power BI Desktop
Using Geographical Data
Geographical Data Types
Define the Data Category in the Data Model
Add Multiple Levels of Geographical Information
Adjusting the Map Display in Power BI Desktop
Positioning the Map Elements
Zooming In or Out
Multivalue Series
Highlighting Map Data
Filled Maps
Formatting Maps
Tree Maps
Formatting Tree Maps
Legend
Data Colors
Category Labels
Title
Background
Lock Aspect
Gauges
Formatting Gauges
Additional Visuals
The Power BI Visuals Gallery
Loading Custom Visuals
Enabling Custom Visuals
A Rapid Overview of a Selection of Custom Visuals
Aster Plots
Radar Charts
Bullet Charts
Word Clouds
Sunburst Charts
Streamgraphs
Tornado Charts
Histograms
Chord Charts
Sankey Diagrams
Conclusion
Chapter 13: Filtering Data
Filters
Visual-Level Filters
The Filters Well
Adding Filters
Applying Filters
The (All) Filter
Clearing Filters
Filtering Different Data Types
Numeric Data
Range Filter Mode
Numeric Filter Options
Date and Time Data
Date and Time Filters
Date Filter Options
Other Data Types
Advanced Text Filters
Applying an Advanced Text Filter
Clearing an Advanced Filter
Reverting to Basic Filtering
Text Filter Options
Specific Visualization-Level Filters
Multiple Filters
Page-Level Filters
Report-Level Filters
Removing Filters
Filter Field Reuse
Using the Filter Hierarchy
Filtering Tips
Don’t Filter Too Soon
Annotate, Annotate, Annotate
Avoid Complex Filters
Conclusion
Chapter 14: Using Slicers
Slicers
Adding a Slicer
Applying Slicers
Clearing a Slicer
Deleting a Slicer
Modifying a Slicer
Formatting Slicers
Slicer Orientation
Modifying the Outline
Adjusting Selection Controls
Adding or Removing the Select All Box
Enabling Single Select
Setting the Exact Size and X and Y coordinates of a Slicer
Slicer Header
Slicer Items
Using Charts As Slicers
Charts As Slicers
Highlighting Chart Data
Cross-Chart Highlighting
Highlighting Data in Bubble Charts
Charts As Filters
Column and Bar Charts As Filters
Specifying Visual Interactions
Choosing the Correct Approach to Interactive Data Selection
Conclusion
Chapter 15: Enhancing Dashboards
Adding Text Boxes to Annotate a Report
Adding a Text Box
Moving Text Boxes
Formatting a Text Box
Adding a Hyperlink
Removing a Hyperlink
Deleting Text Boxes
Modifying the Page Background Color
Images
Image Sources
Adding an Image
Removing an Image
Resizing Images
Formatting Images
Background Images
Adding a Background Image
Images in Charts
Some Uses for Independent Images
Adding Shapes
Formatting Shapes
Lines in Shapes
Shape Fill
Shape Rotation
Removing Shapes
Standardizing Shapes
Organizing Visuals on the Page
Layering Visuals
Aligning Visuals
Distributing Visuals
Exporting Data from a Visualisation
Conclusion
Chapter 16: PowerBI.com
Publishing Reports to PowerBI.com
Creating a Power BI Account
Using Power BI Desktop Files in PowerBI.com
Logging on to PowerBI.com
Adding a Power BI Desktop File
Interacting with a Report on PowerBI.com
Printing PowerBI.com Reports
Creating PowerBI.com Dashboards
Creating a New Dashboard
Adding Tiles to PowerBI.com Dashboards
Editing Dashboard Tiles
Deleting Tiles
Modifying Tile Details
Exporting the Data Behind the Tile
Pinning the Tile to Another Dashboard
Modifying Dashboards
Resizing Tiles
Adding Other Widgets (Images, Text Boxes, or Other Web Content)
Displaying Dashboards in Full Screen Mode
Print Dashboards
Sharing Dashboards
Creating New Reports in PowerBI.com
The Power BI App on Tablet Devices
PowerBI.com Gateways
Downloading a Gateway
Configuring a Gateway
Ad Hoc Data Refresh
Scheduled Data Refresh
Conclusion
Appendix A: Sample Data
Sample Data
Downloading the Sample Data
Images
Sample Databases
The CarSalesData database
The Analysis Services Database
Index




 2023年江西萍乡中考道德与法治真题及答案.doc
 2012年重庆南川中考生物真题及答案.doc
 2013年江西师范大学地理学综合及文艺理论基础考研真题.doc
 2020年四川甘孜小升初语文真题及答案I卷.doc
 2020年注册岩土工程师专业基础考试真题及答案.doc
 2023-2024学年福建省厦门市九年级上学期数学月考试题及答案.doc
 2021-2022学年辽宁省沈阳市大东区九年级上学期语文期末试题及答案.doc
 2022-2023学年北京东城区初三第一学期物理期末试卷及答案.doc
 2018上半年江西教师资格初中地理学科知识与教学能力真题及答案.doc
 2012年河北国家公务员申论考试真题及答案-省级.doc
 2020-2021学年江苏省扬州市江都区邵樊片九年级上学期数学第一次质量检测试题及答案.doc
 2022下半年黑龙江教师资格证中学综合素质真题及答案.doc