Journal of Diabetes Mellitus, 2020, 10, 16-25
https://www.scirp.org/journal/jdm
ISSN Online: 2160-5858
ISSN Print: 2160-5831
Study of Lipid Abnormalities in Type 2
Diabetes Mellitus Patients with Nephropathy
in Eastern India
Sonalika Behera1, Andrew Abel Lamare2, Bijan Patnaik1, Roma Rattan2, Sidhartha Das1
1Department of Medicine, Sriram Chandra Bhanja Medical College, Cuttack.odisha, India
2Department of Biochemistry, Sriram Chandra Bhanja Medical College, Cuttack.odisha, India
How to cite this paper: Behera, S., Lamare,
A.A., Patnaik, B., Rattan, R. and Das, S.
(2020) Study of Lipid Abnormalities in
Type 2 Diabetes Mellitus Patients with
Nephropathy in Eastern India. Journal of
Diabetes Mellitus, 10, 16-25.
https://doi.org/10.4236/jdm.2020.101002
Received: January 16, 2020
Accepted: February 25, 2020
Published: February 28, 2020
Copyright © 2020 by author(s) and
Scientific Research Publishing Inc.
This work is licensed under the Creative
Commons Attribution-NonCommercial
International License (CC BY-NC 4.0).
http://creativecommons.org/licenses/by-nc/4.0/
Open Access
Abstract
Background: Diabetic nephropathy is one of the major complications of di-
abetes. Nephropathy patients must be evaluated for dyslipidemia as it is an
established risk factor for cardiovascular events. We compared the degree of
dyslipidemia among type 2 diabetes mellitus (T2DM) subjects with or with-
out nephropathy and analyzed the factors associated with nephropathy
among them. Methods: In this retrospective study, T2DM patients with overt
nephropathy were enrolled in the study group (n = 50); without nephropathy
were enrolled in the control group (n = 50). Both groups were matched for
age duration of diabetes. After taking informed consent anthropometrical
clinical examinations were done. Biochemical investigations (Total choles-
terol, TG, HDL, LDL, VLDL, sdLDL-C, S. urea, S. creatinine were done in
SCB MCH, Biochemistry department. Urine microalbumin per gm of creati-
nine was done. TG/HDL-C ratio, a surrogate marker for small, dense, LDL
particles (sdLDL), and estimated glomerular filtration rate (eGFR) were cal-
culated using equations. Results were analyzed statistically using SPSS version
20. Results: Mean Total cholesterol, TG, LDL, sdLDL are significantly high in
nephropathy patients with p values 0.026, 0.012, 0.014, 0.04 respectively. Es-
timated GFR has a significant positive correlation with TCHOL (r = −0.850, p =
0.01), TG (r = −0.14, p = 0.008), LDL (r = −0.62 p = 0.037). Estimated GFR
has a significant negative correlation with S. urea (r = −0.587, p ≤ 0.01), S.
creatinine (r = −0.59, p ≤ 0.01), UACR (r = −0.47, p ≤ 0.01). Dyslipidema
sdLDL is significantly more in nephropathy group in comparison to diabetic
group with p values 0.033, 0.045 respectively. Conclusion: Our study shows
that dyslipidemia was highly prevalent among subjects with nephropathy. So
cardiovascular risks can be averted by regular screening for dyslipidemia in
diabetic nephropathy patients.
DOI: 10.4236/jdm.2020.101002 Feb. 28, 2020
16
Journal of Diabetes Mellitus
�
S. Behera et al.
Keywords
Dyslipidemia, Diabetic Nephropathy, Insulin Resistance, sdLDL,
Atherogenic Dyslipidemia
1. Introduction
Austin colleagues first explained Atherogenic Dyslipidemia (AD) as a clinical
condition [1] characterized by elevated levels of serum triglyceride (TG) levels
small-dense low-density lipoprotein (sdLDL) particles with low levels of
high-density lipoprotein cholesterol (HDL-C) [2]. Dyslipidemia of metabolic
syndrome is considered as an important CVD (Cardiovascular disease) risk fac-
tor in these patients. Long-standing diabetes causes dysfunction of lipoprotein
lipase as a result increase in further TG level. TG level causes accumulation of
large TG-rich very low density lipoprotein particles, which in turn generate
sdLDL particles [3]. Hypertriglyceridaemia is the common dyslipidemia seen in
uncontrolled diabetic state, insulin resistant stage presence of nephropathy in
Type 2 diabetics. Diabetic nephropathy is one of the major complications of di-
abetes, characterized by proteinuria renal insufficiency, an established risk factor
for cardiovascular events as well as mortality [4] [5]. Dyslipidemia leads to pro-
gressive loss of renal function among diabetic patients [6] by causing damage to
vascular, mesangial, tubular cells of kidneys [7]. Dyslipidemia and nephropathy
act synergistically in worsening the clinical condition, increasing the risk of renal
or cardiovascular consequences among diabetic patients [8] [9]. In recent years
in Indian population AD and CVD are increasing compared to western popula-
tion, which may be due to adverse life style changes such as physical inactivity,
diet deficient in PUFA a higher genetic predisposition [10]. We conducted a re-
trospective analysis comparing the extent of dyslipidemia among diabetic neph-
ropathy patients, also evaluated the risk factors associated with nephropathy
among them.
2. Study
This study was a hospital based observational study.
2.1. Materials
Consecutive Patients of Type 2 Diabetes Mellitus (DM) with or without micro-
albuminuria attending SCB MEDICAL COLLEGE HOSPITAL Medical OPDs
inone year. Patients were subjected to blood and urine investigations patients
were divided in to two groups. Group 1 Type 2 Diabetes Mellitus without micro-
albuminuria as indicated by < 30 mg of albumin per gram of creatinine on spot
urine sample and in the three most recent lab reports. Type 2 DM was diagnosed
according to WHO guidelines: 1) Random Plasma Glucose more than 200 mg%
with classical symptoms of hyperglycaemias. Or 2) Fasting Plasma Glucose more
17
Journal of Diabetes Mellitus
DOI: 10.4236/jdm.2020.101002
�
S. Behera et al.
DOI: 10.4236/jdm.2020.101002
than 126 mg% or 3) 2-hour Plasma Glucose more than 200 mg% by oral glucose
tolerance test. or 4) HbA1c more than 6.5%. Group 2 included subjects with
nephropathy. Diabetic nephropathy patients were defined as on the basis of
Kidney Disease Improving Global Outcome (KDIGO) classification of chronic
kidney disease and GFR calculated using COCKRAUFT’S Formulae. Cockrauft’s
formulae: CCr = {((l40 − age) × weight)/(72 × SCr)} × 0.85 (if female). Exclusion
criteria: The subjects who did not able to underst sign the study specific in-
formed consent were excluded from study.
2.2. Methods
After getting consents anthropometric details such as height, weight, BMI de-
tailed clinical examinations were done. Details regarding their medications, diet
life style habits were also collected. Fasting post prandial venous blood was col-
lected and processed for biochemical tests. Plasma glucose levels were estimated
by GOD-POD (Glucose oxidase peroxidase) method adapted to autoanalyzer
(Toshiba 120FR, JAPAN). Serum total cholesterol is estimated by CHOD-PAP
(cholesterol oxidase-peroxidase) method adapted to autoanalyzer (Toshi-
ba120FR, AGGAPE, JAPAN). Estimation of Serum Triglyceride by Glyce-
rol-3-Phosphate-oxidase/Peroxidase method (GPO-TOPS) adapted to autoana-
lyzer (Toshiba 120FR. AGGAPE, JAPAN). Estimation of serum HDL cholesterol
by selective inhibition method adapted to autoanalyzer (Toshiba 120FR,
JAPAN). Serum LDL level was estimated by Friedewald formula. FRIEDEWALD
FORMULA, LDL = Total Cholesterol-[HDL + (Triglyceride/5)] Results were
expressed in mg/dL. Serum VLDL level was estimated by Friedewald formula.
FRIEDEWALD FORMULA, VLDL = Triglyceride/5. Results were expressed in
mg/dl. 1) Dyslipidemia: total cholesterol ≥ 200 mg/dL or triglycerides (TG) ≥
150 mg/dL or high density lipoprotein cholesterol (HDL-C) ≤ 35 mg/dL (for
men) ≤ 40 mg/dL (for women) or low density lipoprotein cholesterol ≥ 100
mg/dL or a combination of these conditions 2) sdLDL: TG/HDL-C ratio > 3, 3)
Atherogenic dyslipidemia: TG ≥ 150 mg/dL+HDL-C ≤ 35 mg/dL (for men) ≤ 40
mg/dL (for women) + sdLDL ratio > 3. Serum urea level was estimated by
(GLDH/KINETIC) method adapted to autoanalyzer (Toshiba 120FR, JAPAN).
Serum creatinine was estimated by enzymatic method adapted to autoanalyzer
(Toshiba 120FR). Glycated haemoglobin was done by High-performance liquid
chromatography. First-morning urine samples were collected under sterile
conditions. The same specimen was used for urinary the measurement of al-
bumin-creatinine ratio, ACR (μg/mg). ACR < 30 μg/mg was defined as nor-
moalbuminuria, 30 - 300 μg/mg as microalbuminuria, ACR > 300 μg/mg as
macroalbuminuria. Urine microalbumin were done in standard kits adapted to
semi auto analyser (Toshiba 120 FR, AGAPPE). Urine Albumin: Creatinine
Ratio (UACR) calculated by the formula, which has been approved by National
Kidney Disease Education Program. UACR in mg/g = Urine albumin
(mg/dL)/Urine creatinine (g/dL).
18
Journal of Diabetes Mellitus
�
S. Behera et al.
2.3. Statistical Analysis
Statistical analysis was done using SPSS package version 20.0 (SPSS Inc., Chica-
go, IL, USA). Quantitaive variables were described as mean ± standard deviation
unless otherwise indicated. Qualitative variables were mentioned as percentages.
Pearson’s correlation co-efficient, ANOVA with post Hoc analysis, logistic re-
gression analysis, multivariate analysis were used.
3. Result
Table 1 shows the male:female ratio was 70:22, 61:28 respectively for these
groups 1 and 2. Mean HBA1C is not significant in both groups. Both groups are
on regular treatment for diabetes. Both groups did not take any lipid lowering
drugs. Mean total cholesterol, TG, LDL levels are high in nephropathy group
with p values 0.026, 0.012, 0.014 respectively. sdLDL is calculated TG/HDL ratio.
Mean sdLDL are hign in nephropathy group. LDL/HDL level in both groups are
not significant. Serum urea was higher among nephropathy. Mean GFR (19.21 ±
9.51) is lower in nephropathy group with p value < 0.001. Mean UACR levels are
significant in nephropathy group with p values < 0.001.
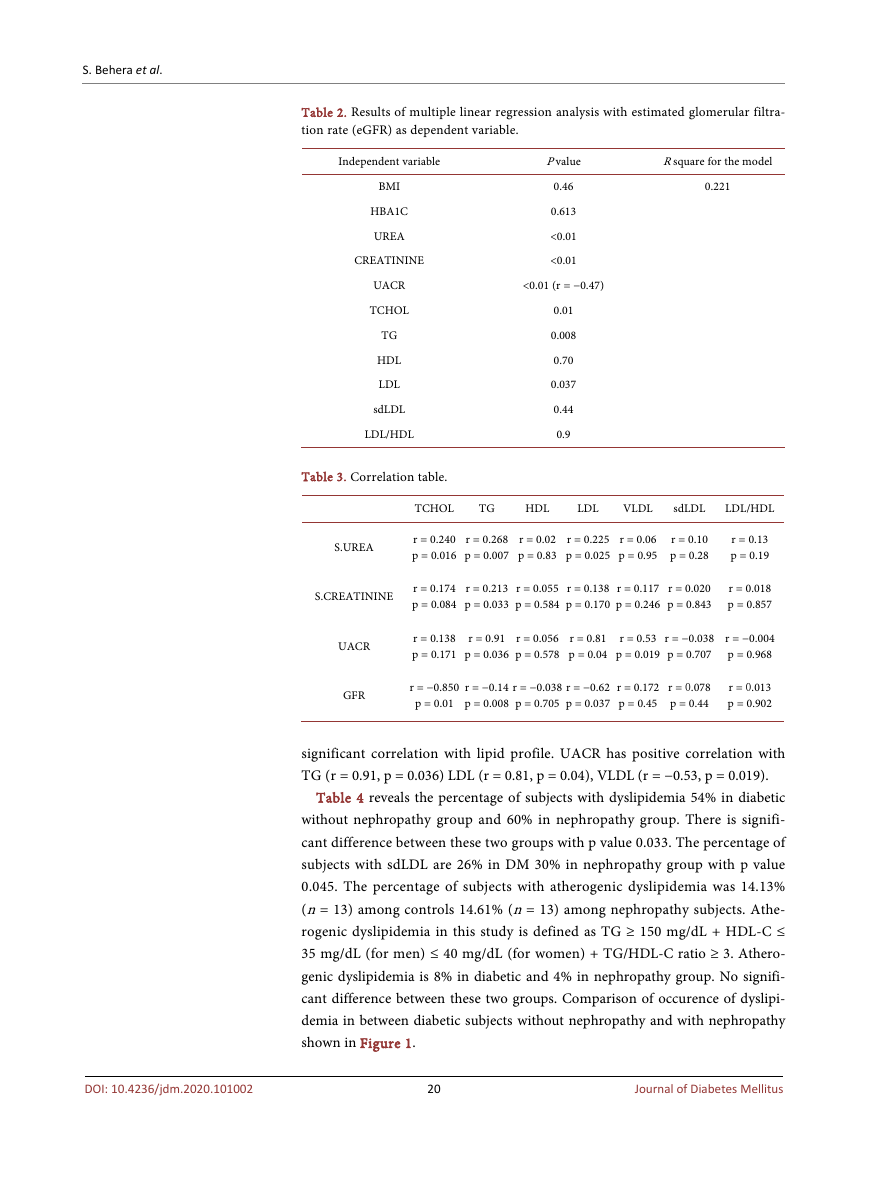
Table 2 shows shows eGFR as dependent variable has significant relation with
S.urea (p < 0.01), S.creatinine (p < 0.01), UACR (p < 0.01), T.cholesterol (p =
0.01), TG (p = 0.008) and LDL (p = 0.037) with p value < 0.05. eGFR has no sig-
nificant relation with HDL, sdLDL, LDL/HDL.
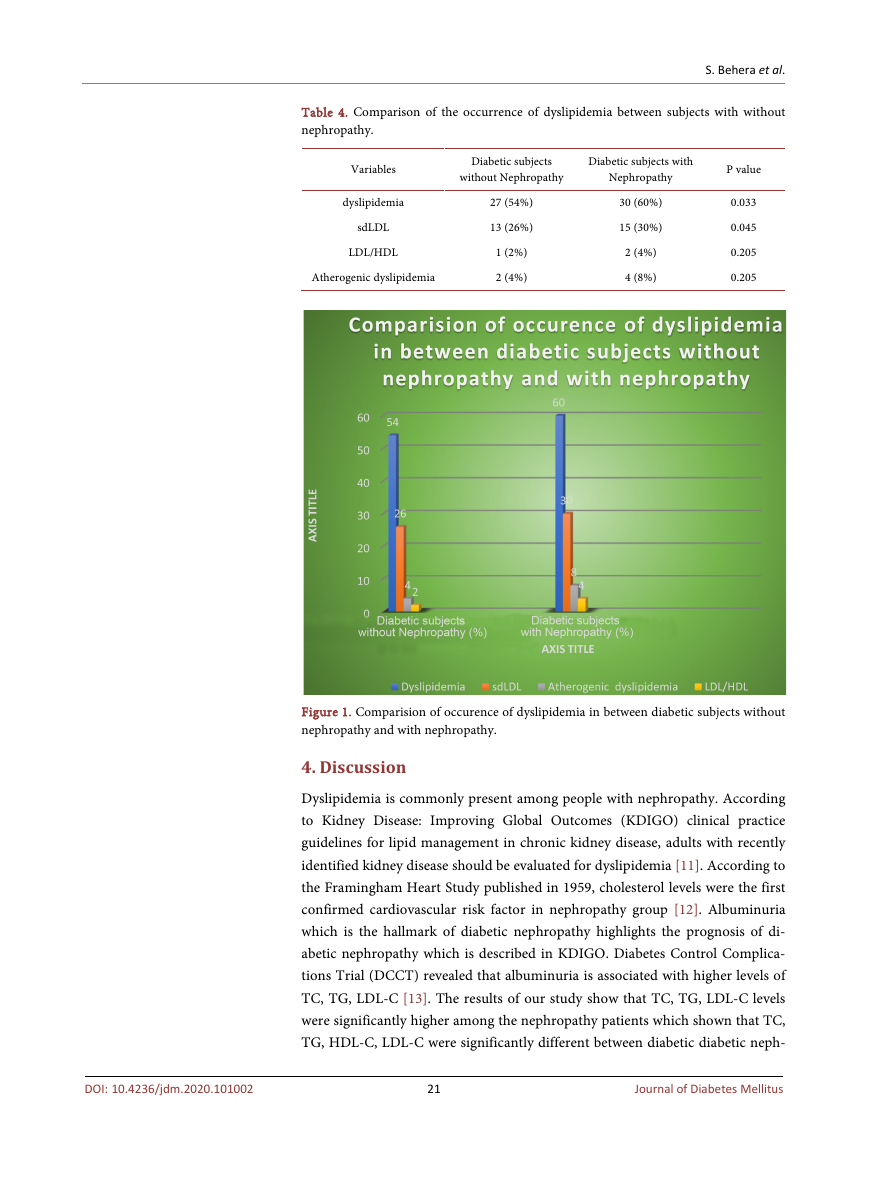
Table 3 shows eGFR has significant correlation with TCHOL (r = −0.850, p =
0.01), TG (r = −0.14, p = 0.008), LDL (r = −0.62, p = 0.037). eGFR has significant
negative correlation with s.urea (r = −0.587, p ≤ 0.01), s.creatinine (r = −0.59,
p ≤ 0.01), UACR (r = −0.47, p ≤ 0.01). Surea has positive correlation with
TCHOL, TG, LDL (p values mentioned in above table). S. creatinine has no
Table 1. Comparison of anthropometric measurements biochemical estimations between
Diabetes subjects with or without nephropathy.
Diabetes mellitus subjects
without Nephropathy
Diabetic subjects
With nephropathy
P VALUE
GFR (ml/mnt/1.73m2)
UACR (mg/g)
244.78 ± 163.38
25.21 ± 3.33
DOI: 10.4236/jdm.2020.101002
19
Journal of Diabetes Mellitus
Parameters
Age (yrs)
BMI (kg/m2)
HBA1C (%)
T.chol (mg/dl)
TG (mg/dl)
HDL (mg/dl)
LDL (mg/dl)
VLDL (mg/dl)
Sd LDL
LDL/HDL
51.02 ± 12.12
21.25 ± 2.32
7.93 ± 0.81
142.8 ± 48.99
132.3 ± 58.04
56.24 ± 25.91
59.68 ± 31.74
28.06 ± 11.52
2.28 ± 1.96
1.21 ± 0.82
50.10 ± 10.92
22.9 ± 2.59
8.05 ± 0.83
163.24 ± 41.25
177.02 ± 25.11
62.12 ± 21.77
108.72 ± 29.16
25.90 ± 8.69
2.89 ± 0.22
1.20 ± 0.62
19.21 ± 9.51
1156.97 ± 761.83
0.57
0.21
0.484
0.026
0.012
0.22
0.014
0.293
0.04
0.69
<0.001
<0.001
�
S. Behera et al.
Table 2. Results of multiple linear regression analysis with estimated glomerular filtra-
tion rate (eGFR) as dependent variable.
Independent variable
BMI
HBA1C
UREA
CREATININE
UACR
TCHOL
TG
HDL
LDL
sdLDL
LDL/HDL
Table 3. Correlation table.
P value
0.46
0.613
<0.01
<0.01
<0.01 (r = −0.47)
0.01
0.008
0.70
0.037
0.44
0.9
R square for the model
0.221
TCHOL
TG
HDL
LDL
VLDL
sdLDL
LDL/HDL
S.UREA
r = 0.240
p = 0.016
r = 0.268
p = 0.007
r = 0.02
p = 0.83
r = 0.225
p = 0.025
r = 0.06
p = 0.95
r = 0.10
p = 0.28
r = 0.13
p = 0.19
S.CREATININE
r = 0.174
p = 0.084
r = 0.213
p = 0.033
r = 0.055
p = 0.584
r = 0.138
p = 0.170
r = 0.117
p = 0.246
r = 0.020
p = 0.843
r = 0.018
p = 0.857
UACR
GFR
r = 0.138
p = 0.171
r = 0.91
p = 0.036
r = 0.056
p = 0.578
r = 0.81
p = 0.04
r = 0.53
p = 0.019
r = −0.038
p = 0.707
r = −0.004
p = 0.968
r = −0.850
p = 0.01
r = −0.14
p = 0.008
r = −0.038
p = 0.705
r = −0.62
p = 0.037
r = 0.172
p = 0.45
r = 0.078
p = 0.44
r = 0.013
p = 0.902
significant correlation with lipid profile. UACR has positive correlation with
TG (r = 0.91, p = 0.036) LDL (r = 0.81, p = 0.04), VLDL (r = −0.53, p = 0.019).
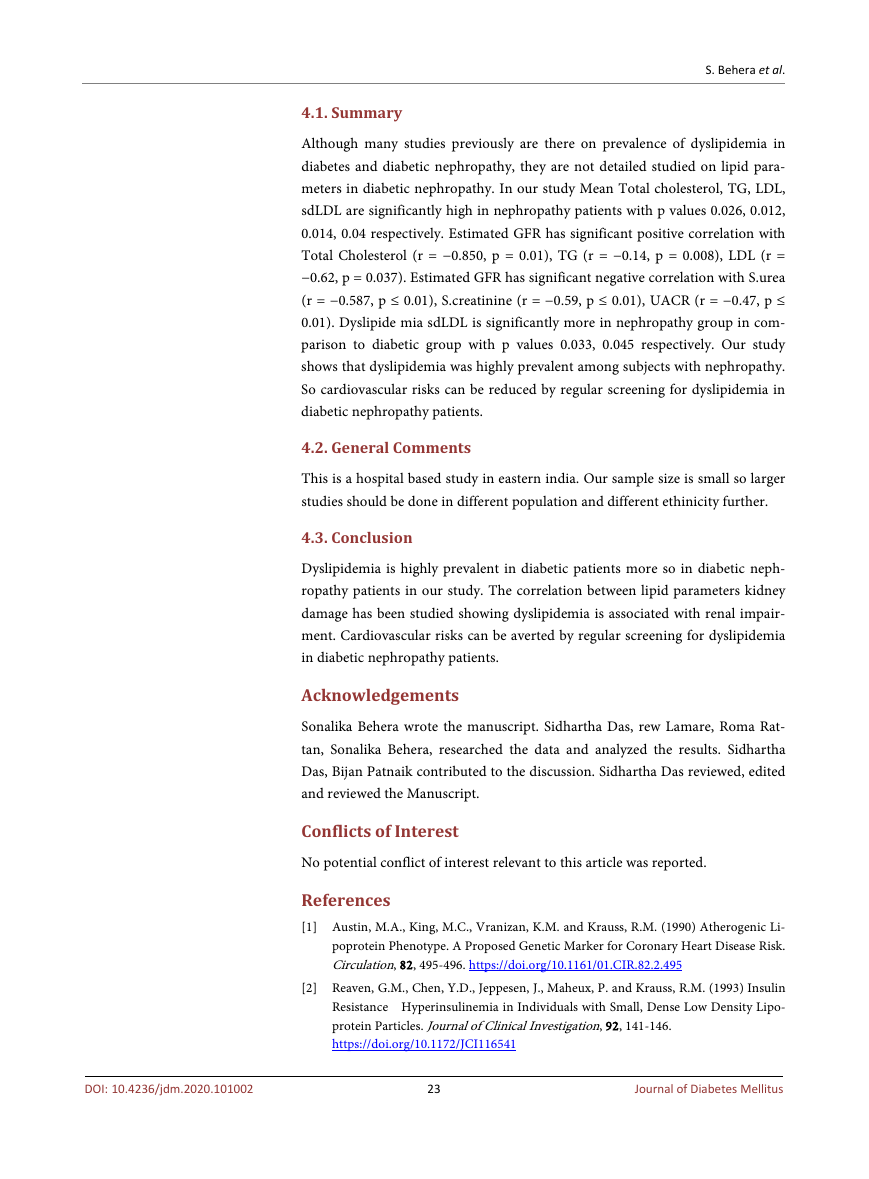
Table 4 reveals the percentage of subjects with dyslipidemia 54% in diabetic
without nephropathy group and 60% in nephropathy group. There is signifi-
cant difference between these two groups with p value 0.033. The percentage of
subjects with sdLDL are 26% in DM 30% in nephropathy group with p value
0.045. The percentage of subjects with atherogenic dyslipidemia was 14.13%
(n = 13) among controls 14.61% (n = 13) among nephropathy subjects. Athe-
rogenic dyslipidemia in this study is defined as TG ≥ 150 mg/dL + HDL-C ≤
35 mg/dL (for men) ≤ 40 mg/dL (for women) + TG/HDL-C ratio ≥ 3. Athero-
genic dyslipidemia is 8% in diabetic and 4% in nephropathy group. No signifi-
cant difference between these two groups. Comparison of occurence of dyslipi-
demia in between diabetic subjects without nephropathy and with nephropathy
shown in Figure 1.
20
Journal of Diabetes Mellitus
DOI: 10.4236/jdm.2020.101002
�
S. Behera et al.
Table 4. Comparison of the occurrence of dyslipidemia between subjects with without
nephropathy.
Variables
dyslipidemia
sdLDL
LDL/HDL
Atherogenic dyslipidemia
Diabetic subjects
without Nephropathy
Diabetic subjects with
Nephropathy
27 (54%)
13 (26%)
1 (2%)
2 (4%)
30 (60%)
15 (30%)
2 (4%)
4 (8%)
P value
0.033
0.045
0.205
0.205
Figure 1. Comparision of occurence of dyslipidemia in between diabetic subjects without
nephropathy and with nephropathy.
4. Discussion
Dyslipidemia is commonly present among people with nephropathy. According
to Kidney Disease: Improving Global Outcomes (KDIGO) clinical practice
guidelines for lipid management in chronic kidney disease, adults with recently
identified kidney disease should be evaluated for dyslipidemia [11]. According to
the Framingham Heart Study published in 1959, cholesterol levels were the first
confirmed cardiovascular risk factor in nephropathy group [12]. Albuminuria
which is the hallmark of diabetic nephropathy highlights the prognosis of di-
abetic nephropathy which is described in KDIGO. Diabetes Control Complica-
tions Trial (DCCT) revealed that albuminuria is associated with higher levels of
TC, TG, LDL-C [13]. The results of our study show that TC, TG, LDL-C levels
were significantly higher among the nephropathy patients which shown that TC,
TG, HDL-C, LDL-C were significantly different between diabetic diabetic neph-
21
Journal of Diabetes Mellitus
DOI: 10.4236/jdm.2020.101002
�
S. Behera et al.
DOI: 10.4236/jdm.2020.101002
ropathy patients [14]. In Indian subjects with diabetes, hypertriglyceridemia
with increased VLDL is more common dyslipidaemia than low high density li-
poprotein (HDL) cholesterol levels [3]. A study conducted even in a different
ethnic population has observed results similar to the present study [15]. Another
study showed that dyslipidemia associated with diabetic nephropathy is present
in both type 1 and type 2 diabetes mellitus patients. Poor glycemia is a major
cause of dyslipidemia. Recently, small dense low density lipoproteincholesterol
(sdLDL-C) considered as one of the lipoprotein risk factors for coronary heart
disease (CHD) as the best marker of carotid atherosclerosis [16] [17]. The per-
centage of subjects with sdLDL, indicated by TG/HDL-C ratio, was high among
both groups in this study population and the percentage differed significantly
between the two groups with p value 0.045 shown in Table 4. In patients with
poor glycemic control, levels of TG rich lipoproteins are higher. This rise is not
only due to over production of VLDL but also poor peripheral clearance conse-
quent to lesser expression of ApoB100 receptors on endothelial cell surface. In
uncontrolled patients with Type-2 DM, the recycling of receptors is also slow.
Glycated ApoB100 has longer interaction with its receptors so prolongs the half
life of both LDL VLDL molecules (S.Das). But a study including diabetic Japa-
nese subjects had shown that LDL particle size was significantly lower in neph-
ropathy patients compared to subjects without nephropathy [18]. LDL/HDL also
varies between diabetic and nephropathy group but in our study this is not sig-
nificantly different. The correlation between lipid parameters kidney function
parameters in the current study implies that dyslipidemia is associated with ren-
al insufficiency in this population. Various prospective studies have shown that
there is a significant correlation between renal outcome dyslipidemia [19]. The-
rapeutic intervention using statins to reduce cholesterol level has been recog-
nized to reduce the risk for adverse cardiovascular events among subjects with
kidney disease [20]. These data of previous studies have shown that TChol level
was associated with a higher risk of mortality in patients with chronic renal fail-
ure [19] [20] [21]. Chen et al. [21] in a more recent large-scale study among
3303 patients with chronic kidney disease stages 3 to 5 observed that the associa-
tion between TC mortality is different among patients with different levels of
proteinuria. Correlation table shows TCHOL has significant negative correlation
with GFR (P VALUE 0.01) shown in Table 3. As the GFR level declines T.CHOL
level increases. Our study also states this same. Physicians Health Study had
demonstrated that the risk for deterioration of renal function was significant
among subjects with elevated cholesterol or low HDL-C, even at mildly elevated
serum creatinine values [22] [23]. In our study S. creatinine has no significant
correlation with lipid profile parameters [24]. Dyslipidemia of metabolic syn-
drome is considered as an important CVD (Cardiovascular disease) risk factor in
these patients [25]. Despite being a retrospective analysis of small sample size,
the study has been able to obtain useful data on the prevalence of dyslipidemia
among diabetic nephropathy patients.
22
Journal of Diabetes Mellitus
�
S. Behera et al.
4.1. Summary
Although many studies previously are there on prevalence of dyslipidemia in
diabetes and diabetic nephropathy, they are not detailed studied on lipid para-
meters in diabetic nephropathy. In our study Mean Total cholesterol, TG, LDL,
sdLDL are significantly high in nephropathy patients with p values 0.026, 0.012,
0.014, 0.04 respectively. Estimated GFR has significant positive correlation with
Total Cholesterol (r = −0.850, p = 0.01), TG (r = −0.14, p = 0.008), LDL (r =
−0.62, p = 0.037). Estimated GFR has significant negative correlation with S.urea
(r = −0.587, p ≤ 0.01), S.creatinine (r = −0.59, p ≤ 0.01), UACR (r = −0.47, p ≤
0.01). Dyslipide mia sdLDL is significantly more in nephropathy group in com-
parison to diabetic group with p values 0.033, 0.045 respectively. Our study
shows that dyslipidemia was highly prevalent among subjects with nephropathy.
So cardiovascular risks can be reduced by regular screening for dyslipidemia in
diabetic nephropathy patients.
4.2. General Comments
This is a hospital based study in eastern india. Our sample size is small so larger
studies should be done in different population and different ethinicity further.
4.3. Conclusion
Dyslipidemia is highly prevalent in diabetic patients more so in diabetic neph-
ropathy patients in our study. The correlation between lipid parameters kidney
damage has been studied showing dyslipidemia is associated with renal impair-
ment. Cardiovascular risks can be averted by regular screening for dyslipidemia
in diabetic nephropathy patients.
Acknowledgements
Sonalika Behera wrote the manuscript. Sidhartha Das, rew Lamare, Roma Rat-
tan, Sonalika Behera, researched the data and analyzed the results. Sidhartha
Das, Bijan Patnaik contributed to the discussion. Sidhartha Das reviewed, edited
and reviewed the Manuscript.
Conflicts of Interest
No potential conflict of interest relevant to this article was reported.
References
[1] Austin, M.A., King, M.C., Vranizan, K.M. and Krauss, R.M. (1990) Atherogenic Li-
poprotein Phenotype. A Proposed Genetic Marker for Coronary Heart Disease Risk.
Circulation, 82, 495-496. https://doi.org/10.1161/01.CIR.82.2.495
[2] Reaven, G.M., Chen, Y.D., Jeppesen, J., Maheux, P. and Krauss, R.M. (1993) Insulin
Resistance Hyperinsulinemia in Individuals with Small, Dense Low Density Lipo-
protein Particles. Journal of Clinical Investigation, 92, 141-146.
https://doi.org/10.1172/JCI116541
23
Journal of Diabetes Mellitus
DOI: 10.4236/jdm.2020.101002
�



 2023年江西萍乡中考道德与法治真题及答案.doc
 2012年重庆南川中考生物真题及答案.doc
 2013年江西师范大学地理学综合及文艺理论基础考研真题.doc
 2020年四川甘孜小升初语文真题及答案I卷.doc
 2020年注册岩土工程师专业基础考试真题及答案.doc
 2023-2024学年福建省厦门市九年级上学期数学月考试题及答案.doc
 2021-2022学年辽宁省沈阳市大东区九年级上学期语文期末试题及答案.doc
 2022-2023学年北京东城区初三第一学期物理期末试卷及答案.doc
 2018上半年江西教师资格初中地理学科知识与教学能力真题及答案.doc
 2012年河北国家公务员申论考试真题及答案-省级.doc
 2020-2021学年江苏省扬州市江都区邵樊片九年级上学期数学第一次质量检测试题及答案.doc
 2022下半年黑龙江教师资格证中学综合素质真题及答案.doc