Advances in Parkinson’s Disease, 2018, 7, 31-42
http://www.scirp.org/journal/apd
ISSN Online: 2169-9720
ISSN Print: 2169-9712
On Heredity Factors of Parkinson’s Disease: A
Parametric and Bayesian Analysis
Abolfazl Saghafi1, Chris P. Tsokos2, Rebecca D. Wooten3
1Department of Mathematics, Physics and Statistics, University of the Sciences, Philadelphia, PA, USA
2Department of Mathematics and Statistics, University of South Florida, Tampa, FL, USA
3Department of Mathematics, Florida Southern College, Lakeland, FL, USA
How to cite this paper: Saghafi, A., Tso-
kos, C.P. and Wooten, R.D. (2018) On
Heredity Factors of Parkinson’s Disease: A
Parametric and Bayesian Analysis. Ad-
vances in Parkinson’s Disease, 7, 31-42.
https://doi.org/10.4236/apd.2018.73004
Received: August 12, 2018
Accepted: August 28, 2018
Published: August 31, 2018
Copyright © 2018 by authors and
Scientific Research Publishing Inc.
This work is licensed under the Creative
Commons Attribution International
License (CC BY 4.0).
http://creativecommons.org/licenses/by/4.0/
Open Access
Abstract
Hereditary is one of the key risk factors of the Parkinson’s disease (PD) and
children of individuals with the Parkinson’s carry a two-fold risk for the dis-
ease. In this article, chance of developing the Parkinson’s disease is estimated
for an individual in five types of families. That is, families with negative his-
tory of the PD (I), families with positive history where neither one of the
parents (II), one of the parents (III-IV), or both parents (V) are diagnosed
with the disease. After a sophisticated modeling, Maximum Likelihood and
Bayesian Approach are used to estimate the chance of developing the Parkin-
son’s in the five mentioned family types. It is extremely important knowing
such probabilities as the individual can take precautionary measures to defy
the odds. While many physicians have provided medical opinions on chance
of developing the PD, our study is one of the first to provide statistical mod-
eling and analysis with real data to support the conclusions.
Keywords
Parkinson’s Disease, Heredity, Bayesian Estimation, Maximum Likelihood,
Statistical Modelling
1. Introduction
Parkinson’s disease (PD) is a chronic and progressive movement disorder, mean-
ing that symptoms continue and worsen over time. Nearly one million Ameri-
cans are living with Parkinson’s disease and approximately 60,000 are diagnosed
with PD each year. This number does not reflect thousands of cases that remain
undetected. The cause for the PD is unknown, and although there is presently no
cure, there are available treatments such as medication and surgery to manage its
symptoms [1].
DOI: 10.4236/apd.2018.73004 Aug. 31, 2018
31
Advances in Parkinson’s Disease
�
A. Saghafi et al.
DOI: 10.4236/apd.2018.73004
The diagnosis of PD depends upon the presence of one or more of the four
most common motor symptoms of the disease. That is, tremor, bradykinesia, rigidi-
ty, and postural instability. In addition, there are other secondary and non-motor
symptoms that affect many people and are increasingly recognized by doctors as
important to diagnosing Parkinson’s. These symptoms contribute to severe dis-
ability and impaired quality of life in advanced Parkinson’s cases. Symptoms in-
clude anxiety, depression, cognitive mood swings, dementia, constipation, pain,
genitourinary problems, sudden drop in blood pressure upon standing, excessive
sweating, sleep disturbances, sense of smell, vision, memory, weight loss, psy-
chosis, hallucinations and loss of energy, among others [2].
There are several research centers and foundations that study Parkinson’s
disease with the aim of providing education to the society about Parkinson’s,
providing facilities for people with Parkinson’s, better understanding of the Par-
kinson’s disease, reducing its effect in patients, and potentially finding a cure for
the Parkinson’s. Among them are National Parkinson Foundation, Parkinson’s
Disease Foundation, American Parkinson Disease Association, Davis Phinney
Foundation, and Michael J. Fox Foundation for Parkinson’s Research.
Through contact with The Michael J. Fox Foundation for Parkinson’s Re-
search, we were granted access to the vast database of Parkinson’s Progression
Markers Initiative (PPMI) [3] on different factors related to registered people
with PD. Our aim is to study the heredity factors leading to Parkinson’s by sta-
tistically modeling the existing data on healthy individuals and patients with
Parkinson’s disease. The total sample size in our study was 1258; 751 males and
507 females. However, more information was available through individual’s rel-
atives.
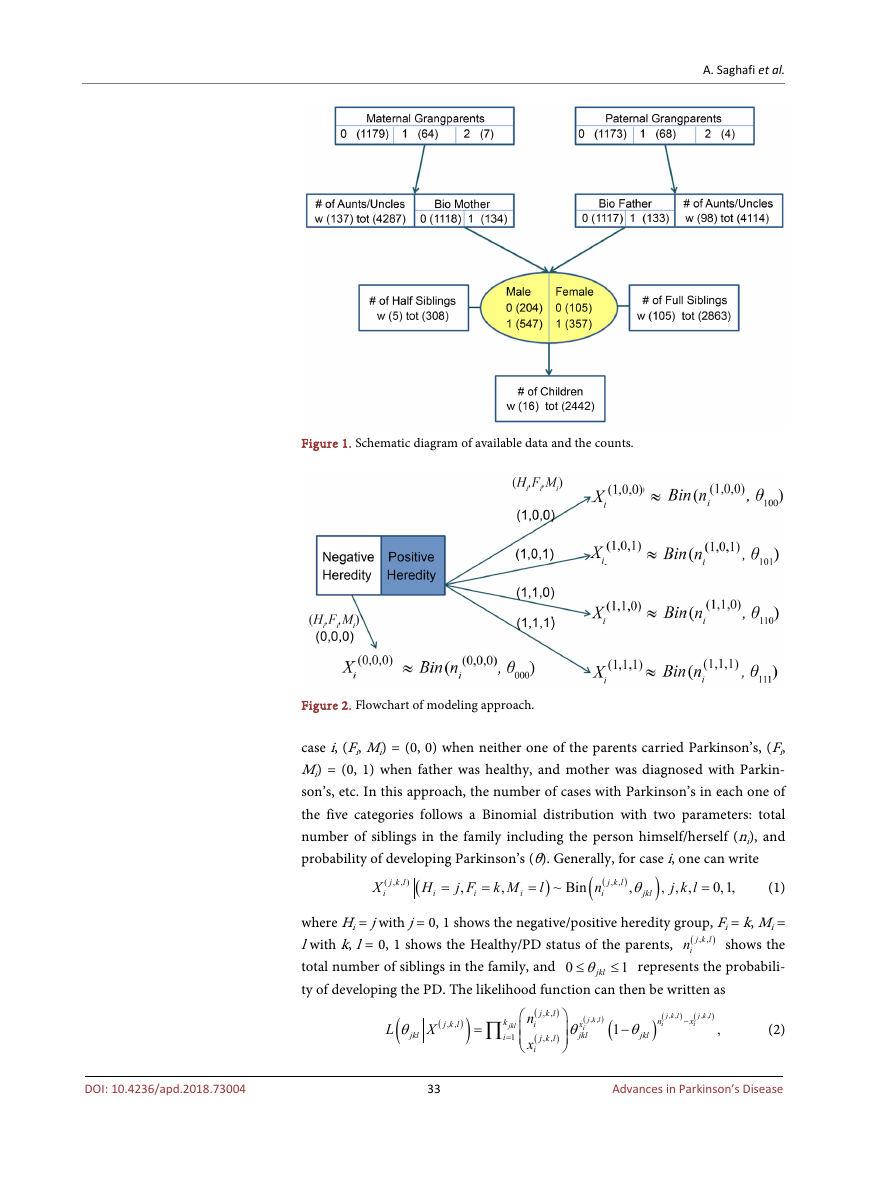
Figure 1 shows the outline of the available data to carry out this study. The
available information included whether either one of the paternal/maternal
grandparents had PD (0 for neither, 1 for either one, 2 for both), whether the bi-
ological father/mother had PD (0 for no, 1 for yes), number of paternal/maternal
aunts/uncles with PD and in total, number of full/half siblings with PD and in
total, and number of children so far diagnosed with PD. Note that the person
himself/herself could be healthy or diagnosed with PD. The numbers in paren-
thesis shows the number of cases in each category. There was not enough infor-
mation available on gender to perform gender related tests and comparisons.
2. Methods
2.1. Maximum Likelihood
The approach shown in Figure 2 is followed which emphasizes discovering the
hereditary importance of the PD. The data is first divided into two exclusive
groups based on the heredity status; negative heredity (H = 0) and positive he-
redity (H = 1). Heredity is considered positive if at least one individual out of
grandparents, parents, aunts/uncles, or full siblings carried the PD. Then, cases
in positive heredity group categorized based on the disease status of parents. For
32
Advances in Parkinson’s Disease
�
A. Saghafi et al.
Figure 1. Schematic diagram of available data and the counts.
Figure 2. Flowchart of modeling approach.
case i, (Fi, Mi) = (0, 0) when neither one of the parents carried Parkinson’s, (Fi,
Mi) = (0, 1) when father was healthy, and mother was diagnosed with Parkin-
son’s, etc. In this approach, the number of cases with Parkinson’s in each one of
the five categories follows a Binomial distribution with two parameters: total
number of siblings in the family including the person himself/herself (ni), and
probability of developing Parkinson’s (θ). Generally, for case i, one can write
X
j k l
( ,
, )
i
(
H
i
=
j F
,
i
=
k M l
,
=
i
)
~ Bin
j k l
,
,
)
(
n
i
,
θ
jkl
j k l
, ,
,
=
0,1,
(1)
(
)
where Hi = j with j = 0, 1 shows the negative/positive heredity group, Fi = k, Mi =
l with k, l = 0, 1 shows the Healthy/PD status of the parents,
shows the
total number of siblings in the family, and 0
≤ represents the probabili-
ty of developing the PD. The likelihood function can then be written as
jklθ≤
(
in
j k l
,
,
)
1
DOI: 10.4236/apd.2018.73004
(
θ
jkl
L
(
j k l
,
,
)
X
)
=
∏
k
jkl
i
1
=
j k l
,
,
j k l
,
,
)
)
(
n
i
(
x
i
(
x
θ
i
jkl
j k l
,
,
) (
1
−
θ
jkl
n
i
) (
j k l
,
,
)
(
x
i
−
j k l
,
,
)
,
(2)
33
Advances in Parkinson’s Disease
�
A. Saghafi et al.
jklk
where
is the number of cases in each of the five family types represented by
Hi = j, Fi = k, Mi = l. Furthermore, it is easy to arrive at the following maximum
likelihood estimator
j k l
,
,
)
θ = ∑
ˆ
∑
jkl
i
i
(
X
i
(
n
i
(3)
)
j k l
,
,
jklk
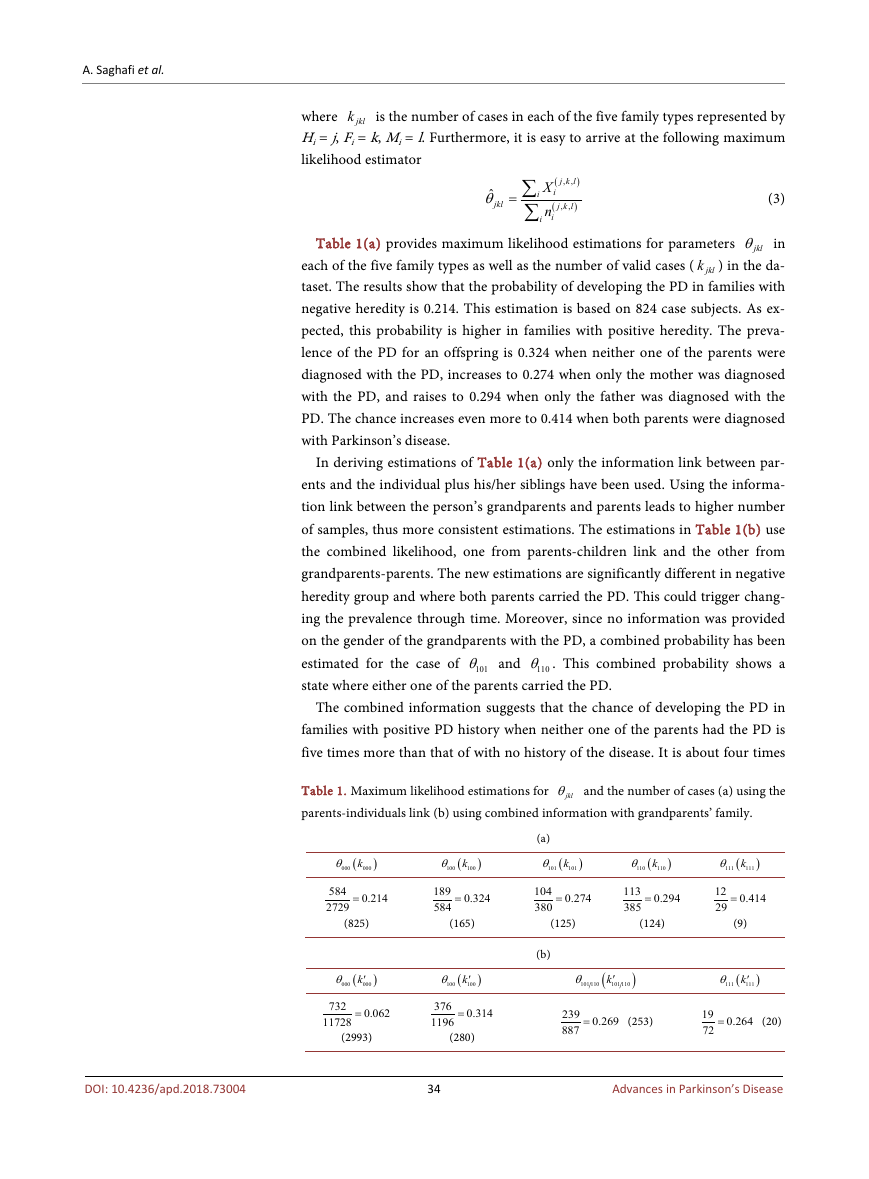
Table 1(a) provides maximum likelihood estimations for parameters
jklθ in
each of the five family types as well as the number of valid cases (
) in the da-
taset. The results show that the probability of developing the PD in families with
negative heredity is 0.214. This estimation is based on 824 case subjects. As ex-
pected, this probability is higher in families with positive heredity. The preva-
lence of the PD for an offspring is 0.324 when neither one of the parents were
diagnosed with the PD, increases to 0.274 when only the mother was diagnosed
with the PD, and raises to 0.294 when only the father was diagnosed with the
PD. The chance increases even more to 0.414 when both parents were diagnosed
with Parkinson’s disease.
In deriving estimations of Table 1(a) only the information link between par-
ents and the individual plus his/her siblings have been used. Using the informa-
tion link between the person’s grandparents and parents leads to higher number
of samples, thus more consistent estimations. The estimations in Table 1(b) use
the combined likelihood, one from parents-children link and the other from
grandparents-parents. The new estimations are significantly different in negative
heredity group and where both parents carried the PD. This could trigger chang-
ing the prevalence through time. Moreover, since no information was provided
on the gender of the grandparents with the PD, a combined probability has been
estimated for the case of
110θ . This combined probability shows a
state where either one of the parents carried the PD.
101θ and
The combined information suggests that the chance of developing the PD in
families with positive PD history when neither one of the parents had the PD is
five times more than that of with no history of the disease. It is about four times
Table 1. Maximum likelihood estimations for
parents-individuals link (b) using combined information with grandparents’ family.
jklθ and the number of cases (a) using the
(a)
000kθ
000
(
)
100kθ
100
(
)
101kθ
101
(
)
110kθ
110
(
)
111kθ
111
(
)
584
2729
=
0.214
(825)
189
584
=
0.324
(165)
104
380
=
0.274
(125)
113
385
=
0.294
(124)
12
29
=
0.414
(9)
000kθ ′
000
(
)
732
11728
0.062
=
(2993)
DOI: 10.4236/apd.2018.73004
(b)
)
θ
101 110
(
100kθ ′
100
(
k
′
101 110
376
1196
=
0.314
(280)
239
887
=
0.269
)
(253)
111kθ ′
111
(
19
72
=
0.264
)
(20)
34
Advances in Parkinson’s Disease
�
A. Saghafi et al.
more when one or both parents carry the disease. Surprisingly, the chances for
developing the PD when neither one of the parents were diagnosed with the PD
are significantly higher than the case where one or both parents are diagnosed
with the disease (p-value = 0.00014 for Binomial test). This could suggest a dor-
mant gene effect for the Parkinson’s.
2.2. Bayesian Approach
The chance of passing the PD to next generations depends on many factors and
could vary from one family to another. This random nature justifies using Baye-
sian approach for estimations. Moreover, one can use sets of hierarchical infor-
mation as prior-likelihood and update prior information anytime new observa-
tions are added to the dataset.
To conduct a Bayesian approach, data in Table 1(a) that utilizes the informa-
tion link between individuals plus full siblings and their biological parents is
used as likelihood. There is available information on whether paternal/maternal
aunts/uncles are diagnosed with the PD and whether grandparents had the dis-
ease. This information is utilized to derive Bayesian estimations for the model
jklθ following two approaches. In the first method, the frequency of
parameters
the PD in each of the paternal and maternal grandparents’ family is used as dis-
crete prior. In the second method, this data is mixed with the information re-
garding the individual’s family as likelihood and a uniform prior is utilized to
derive estimations.
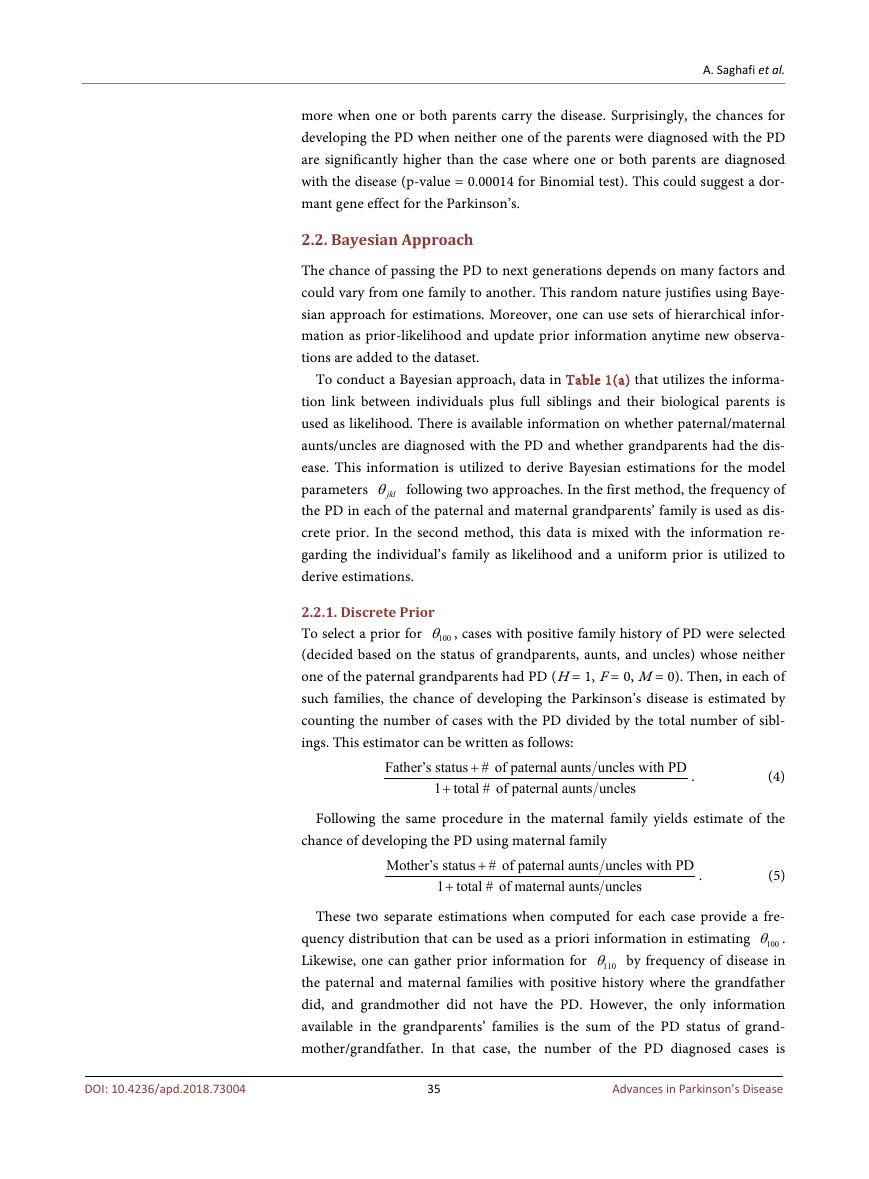
2.2.1. Discrete Prior
100θ , cases with positive family history of PD were selected
To select a prior for
(decided based on the status of grandparents, aunts, and uncles) whose neither
one of the paternal grandparents had PD (H = 1, F = 0, M = 0). Then, in each of
such families, the chance of developing the Parkinson’s disease is estimated by
counting the number of cases with the PD divided by the total number of sibl-
ings. This estimator can be written as follows:
Father s status # of paternal aunts uncles with PD
+
’
1 total # of paternal aunts un e
cl s
+
. (4)
Following the same procedure in the maternal family yields estimate of the
chance of developing the PD using maternal family
Mother s status # of paternal aunts uncles with PD
+
’
1 total # of maternal aunts un e
cl s
+
. (5)
These two separate estimations when computed for each case provide a fre-
100θ .
quency distribution that can be used as a priori information in estimating
Likewise, one can gather prior information for
110θ by frequency of disease in
the paternal and maternal families with positive history where the grandfather
did, and grandmother did not have the PD. However, the only information
available in the grandparents’ families is the sum of the PD status of grand-
mother/grandfather. In that case, the number of the PD diagnosed cases is
35
Advances in Parkinson’s Disease
DOI: 10.4236/apd.2018.73004
�
A. Saghafi et al.
101θ and
counted but the prior for
110θ is set to be the same. Prior information
for
111θ can be derived using the same technique but in different families with
respect to grandparents’ status. The same approach is used to derive prior for
000θ . Table 2 provides the frequency distribution of the PD occurrences utilizing
the above approach.
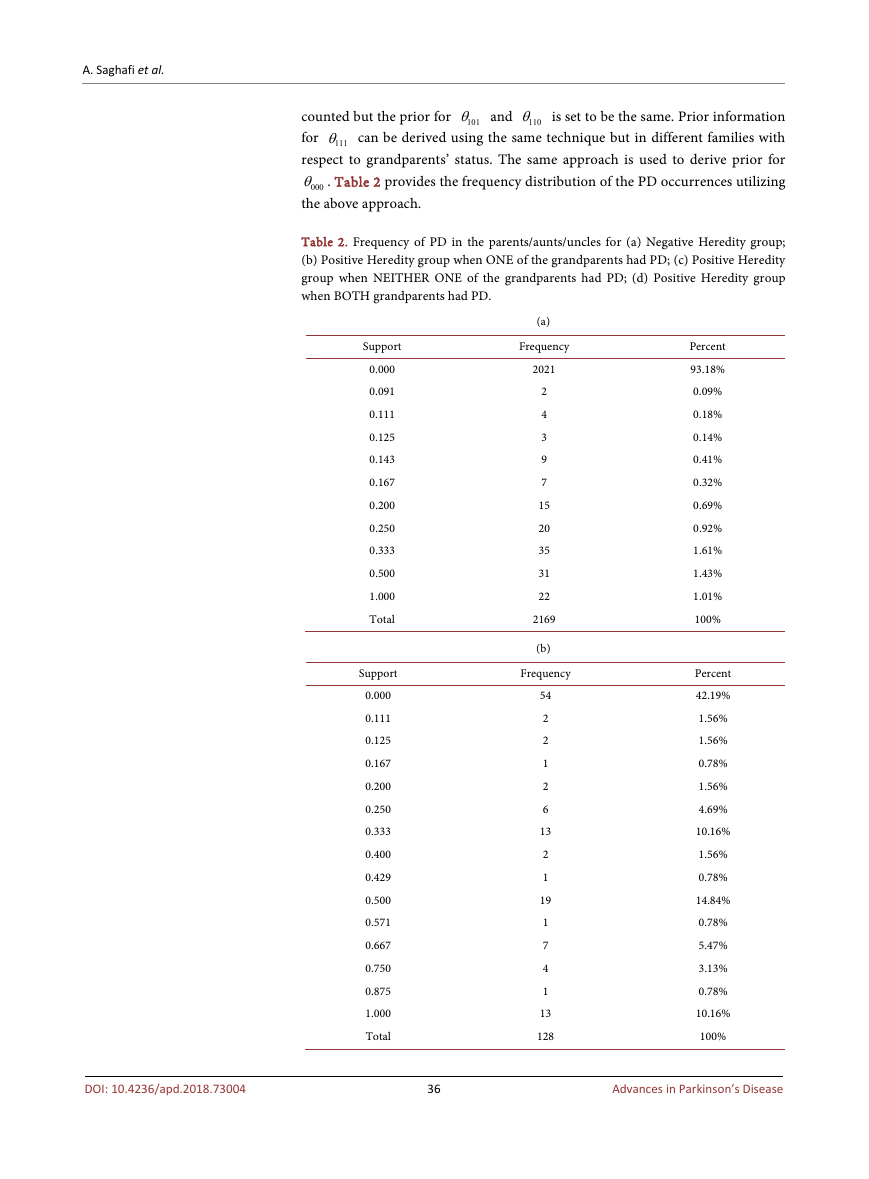
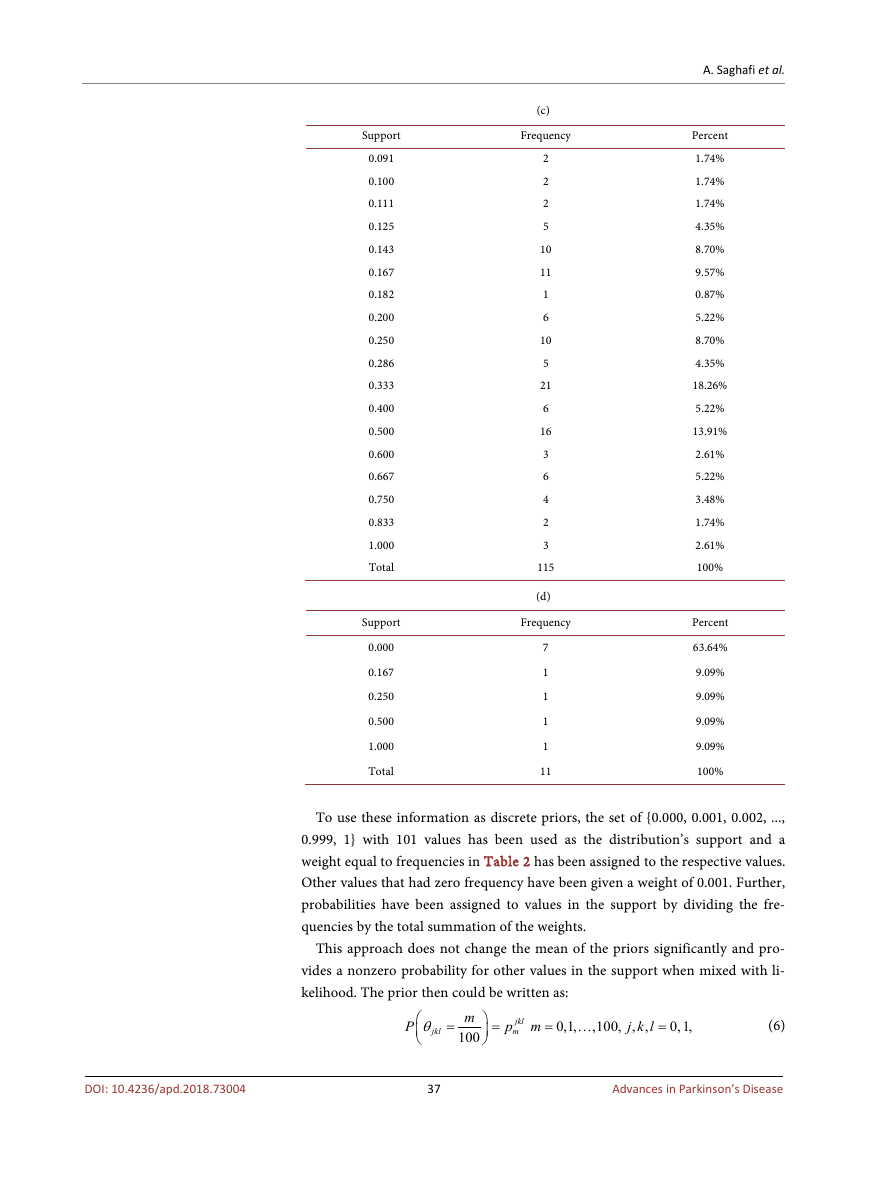
Table 2. Frequency of PD in the parents/aunts/uncles for (a) Negative Heredity group;
(b) Positive Heredity group when ONE of the grandparents had PD; (c) Positive Heredity
group when NEITHER ONE of the grandparents had PD; (d) Positive Heredity group
when BOTH grandparents had PD.
Support
0.000
0.091
0.111
0.125
0.143
0.167
0.200
0.250
0.333
0.500
1.000
Total
Support
0.000
0.111
0.125
0.167
0.200
0.250
0.333
0.400
0.429
0.500
0.571
0.667
0.750
0.875
1.000
Total
(a)
Frequency
2021
2
4
3
9
7
15
20
35
31
22
2169
(b)
Frequency
54
2
2
1
2
6
13
2
1
19
1
7
4
1
13
128
Percent
93.18%
0.09%
0.18%
0.14%
0.41%
0.32%
0.69%
0.92%
1.61%
1.43%
1.01%
100%
Percent
42.19%
1.56%
1.56%
0.78%
1.56%
4.69%
10.16%
1.56%
0.78%
14.84%
0.78%
5.47%
3.13%
0.78%
10.16%
100%
DOI: 10.4236/apd.2018.73004
36
Advances in Parkinson’s Disease
�
Support
0.091
0.100
0.111
0.125
0.143
0.167
0.182
0.200
0.250
0.286
0.333
0.400
0.500
0.600
0.667
0.750
0.833
1.000
Total
Support
0.000
0.167
0.250
0.500
1.000
Total
(c)
Frequency
2
2
2
5
10
11
1
6
10
5
21
6
16
3
6
4
2
3
115
(d)
Frequency
7
1
1
1
1
11
A. Saghafi et al.
Percent
1.74%
1.74%
1.74%
4.35%
8.70%
9.57%
0.87%
5.22%
8.70%
4.35%
18.26%
5.22%
13.91%
2.61%
5.22%
3.48%
1.74%
2.61%
100%
Percent
63.64%
9.09%
9.09%
9.09%
9.09%
100%
To use these information as discrete priors, the set of {0.000, 0.001, 0.002, ...,
0.999, 1} with 101 values has been used as the distribution’s support and a
weight equal to frequencies in Table 2 has been assigned to the respective values.
Other values that had zero frequency have been given a weight of 0.001. Further,
probabilities have been assigned to values in the support by dividing the fre-
quencies by the total summation of the weights.
This approach does not change the mean of the priors significantly and pro-
vides a nonzero probability for other values in the support when mixed with li-
kelihood. The prior then could be written as:
P
θ
jkl
=
m
10
0
=
jkl
p m
m
= …
0,1,
,100, ,
j k l
,
=
0,1,
(6)
37
Advances in Parkinson’s Disease
DOI: 10.4236/apd.2018.73004
�
A. Saghafi et al.
jkl
where
mp is derived from Table 2 after adding nonzero weights as described
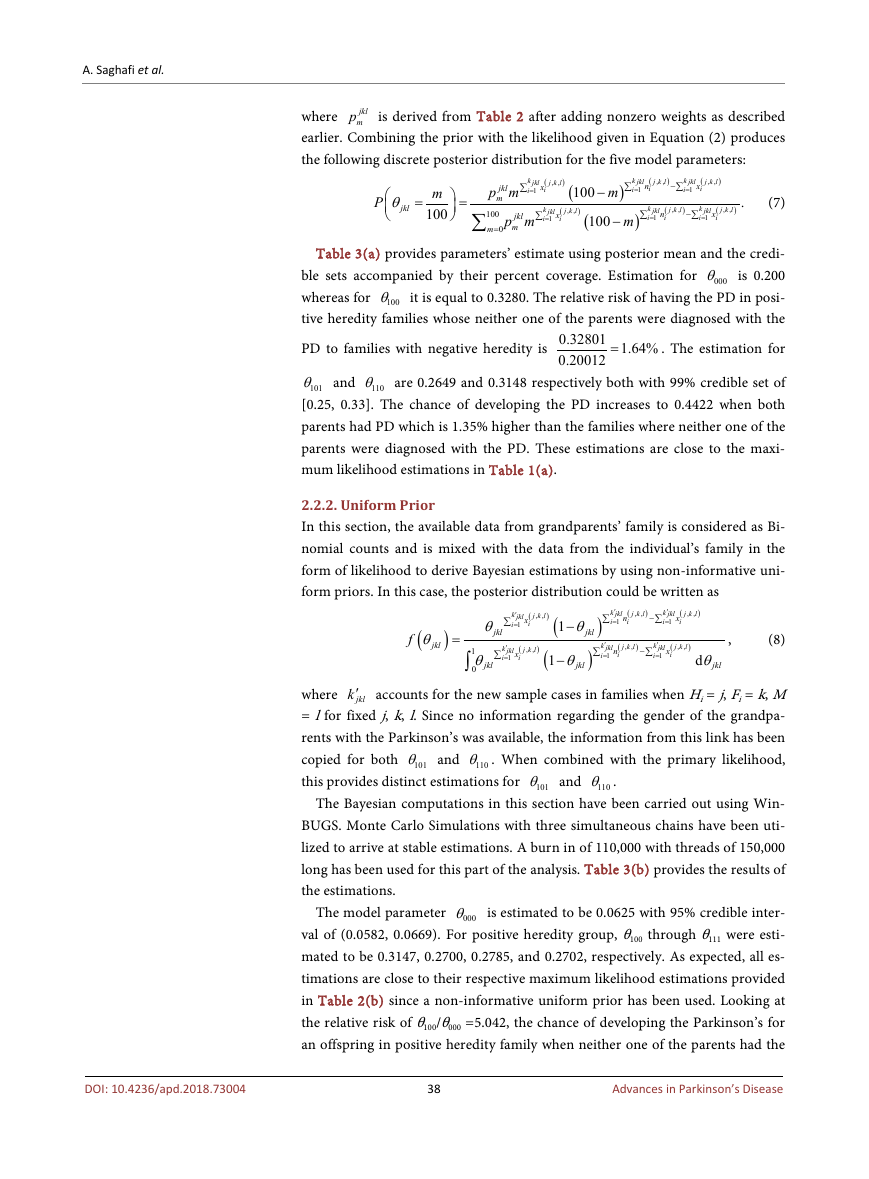
earlier. Combining the prior with the likelihood given in Equation (2) produces
the following discrete posterior distribution for the five model parameters:
P
θ
jkl
=
m
100
=
∑
∑
jkl
p m
m
100
jkl
p m
m
m
0
=
k
jkl
i
1
=
j k l
,
,
(
x
i
k
jkl
i
1
=
(
x
i
∑
∑
−
) (
)
m
100
) (
j k l
,
,
m
100
−
k
jkl
i
1
=
(
n
i
j k l
,
,
)
−
∑
k
jkl
i
1
=
(
x
i
j k l
,
,
)
k
jkl
i
1
=
(
n
i
∑
j k l
,
,
)
−
∑
k
jkl
i
1
=
(
x
i
j k l
,
,
)
)
.
(7)
Table 3(a) provides parameters’ estimate using posterior mean and the credi-
000θ is 0.200
100θ it is equal to 0.3280. The relative risk of having the PD in posi-
ble sets accompanied by their percent coverage. Estimation for
whereas for
tive heredity families whose neither one of the parents were diagnosed with the
PD to families with negative heredity is
. The estimation for
0.32801 1.64%
0.20012
=
101θ and
110θ are 0.2649 and 0.3148 respectively both with 99% credible set of
[0.25, 0.33]. The chance of developing the PD increases to 0.4422 when both
parents had PD which is 1.35% higher than the families where neither one of the
parents were diagnosed with the PD. These estimations are close to the maxi-
mum likelihood estimations in Table 1(a).
2.2.2. Uniform Prior
In this section, the available data from grandparents’ family is considered as Bi-
nomial counts and is mixed with the data from the individual’s family in the
form of likelihood to derive Bayesian estimations by using non-informative uni-
form priors. In this case, the posterior distribution could be written as
(
θ
jkl
)
f
=
∫
∑
θ
jkl
′
k
jkl
i
1
=
∑
1
θ
jkl
0
′
k
jkl
i
1
=
(
x
i
j k l
,
,
(
x
i
j k l
,
,
) (
1
) (
1
−
−
θ
jkl
)
θ
jkl
′
k
jkl
i
1
=
(
n
i
∑
j k l
,
,
)
−
∑
′
k
jkl
i
1
=
(
x
i
j k l
,
,
)
)
∑
′
k
jkl
i
1
=
(
n
i
j k l
,
,
)
−
∑
′
k
jkl
i
1
=
(
x
i
j k l
,
,
)
d
θ
jkl
, (8)
jklk′
where
accounts for the new sample cases in families when Hi = j, Fi = k, M
= l for fixed j, k, l. Since no information regarding the gender of the grandpa-
rents with the Parkinson’s was available, the information from this link has been
copied for both
110θ . When combined with the primary likelihood,
this provides distinct estimations for
101θ and
101θ and
110θ .
The Bayesian computations in this section have been carried out using Win-
BUGS. Monte Carlo Simulations with three simultaneous chains have been uti-
lized to arrive at stable estimations. A burn in of 110,000 with threads of 150,000
long has been used for this part of the analysis. Table 3(b) provides the results of
the estimations.
The model parameter
000θ is estimated to be 0.0625 with 95% credible inter-
val of (0.0582, 0.0669). For positive heredity group, θ100 through θ111 were esti-
mated to be 0.3147, 0.2700, 0.2785, and 0.2702, respectively. As expected, all es-
timations are close to their respective maximum likelihood estimations provided
in Table 2(b) since a non-informative uniform prior has been used. Looking at
the relative risk of θ100/θ000 =5.042, the chance of developing the Parkinson’s for
an offspring in positive heredity family when neither one of the parents had the
38
Advances in Parkinson’s Disease
DOI: 10.4236/apd.2018.73004
�


 2023年江西萍乡中考道德与法治真题及答案.doc
 2012年重庆南川中考生物真题及答案.doc
 2013年江西师范大学地理学综合及文艺理论基础考研真题.doc
 2020年四川甘孜小升初语文真题及答案I卷.doc
 2020年注册岩土工程师专业基础考试真题及答案.doc
 2023-2024学年福建省厦门市九年级上学期数学月考试题及答案.doc
 2021-2022学年辽宁省沈阳市大东区九年级上学期语文期末试题及答案.doc
 2022-2023学年北京东城区初三第一学期物理期末试卷及答案.doc
 2018上半年江西教师资格初中地理学科知识与教学能力真题及答案.doc
 2012年河北国家公务员申论考试真题及答案-省级.doc
 2020-2021学年江苏省扬州市江都区邵樊片九年级上学期数学第一次质量检测试题及答案.doc
 2022下半年黑龙江教师资格证中学综合素质真题及答案.doc