________________________________________________________________________
LNA Design Using SpectreRF
Measurements Using SpectreRF
To test an LNA, place it into the testbenches described in page 6. You can then perform
various analyses to determine the gain, noise, power, linearity, stability, and matching
performance for the LNA.
This section demonstrates how to set up the required SpectreRF analyses and to make
measurements on LNAs. It explains how to extract the design parameters from the data
generated by the analyses.
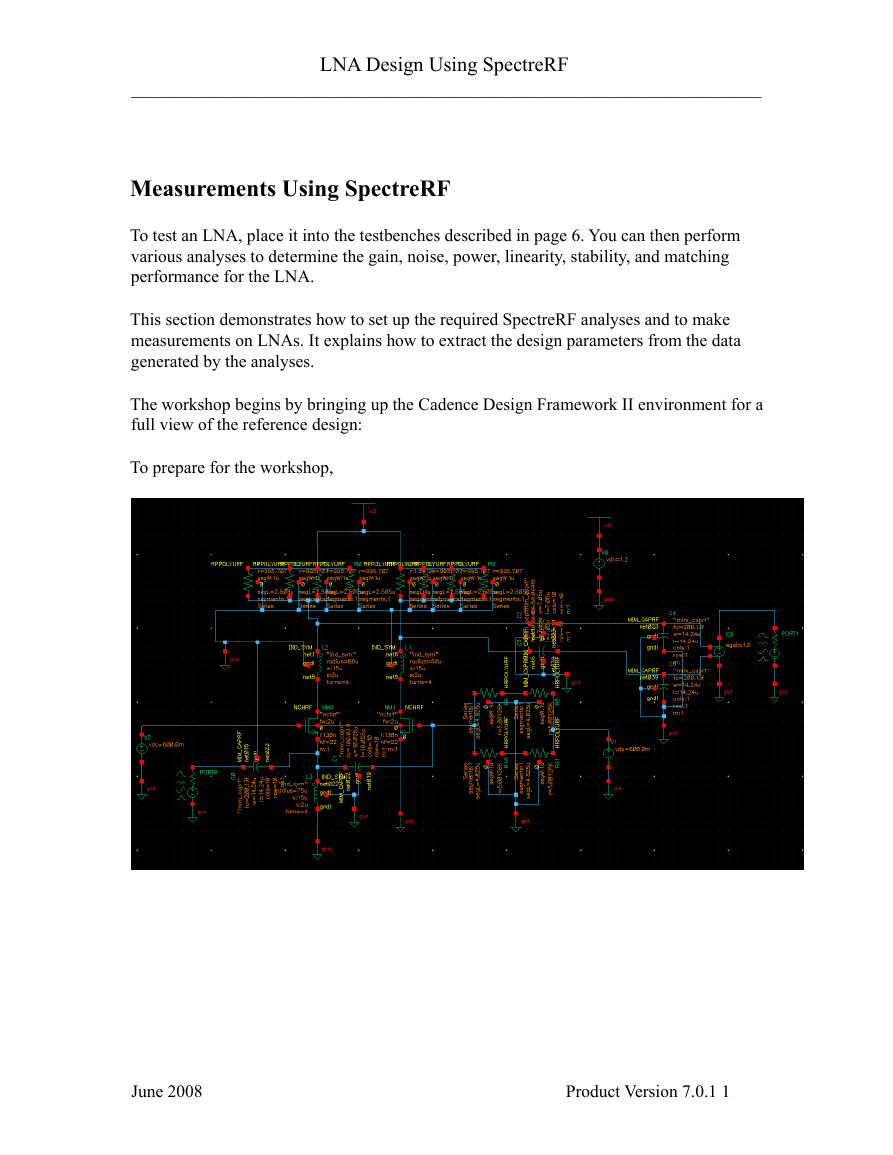
The workshop begins by bringing up the Cadence Design Framework II environment for a
full view of the reference design:
To prepare for the workshop,
June 2008 Product Version 7.0.1 1
�
________________________________________________________________________
LNA Design Using SpectreRF
Lab 1: Small Signal Gain (SP)
The S Parameter (SP) analysis is the most useful linear small signal analysis for LNAs. In
the following actions, you set up an SP analysis by specifying the input and output ports and
the range of sweep frequencies.
Action:
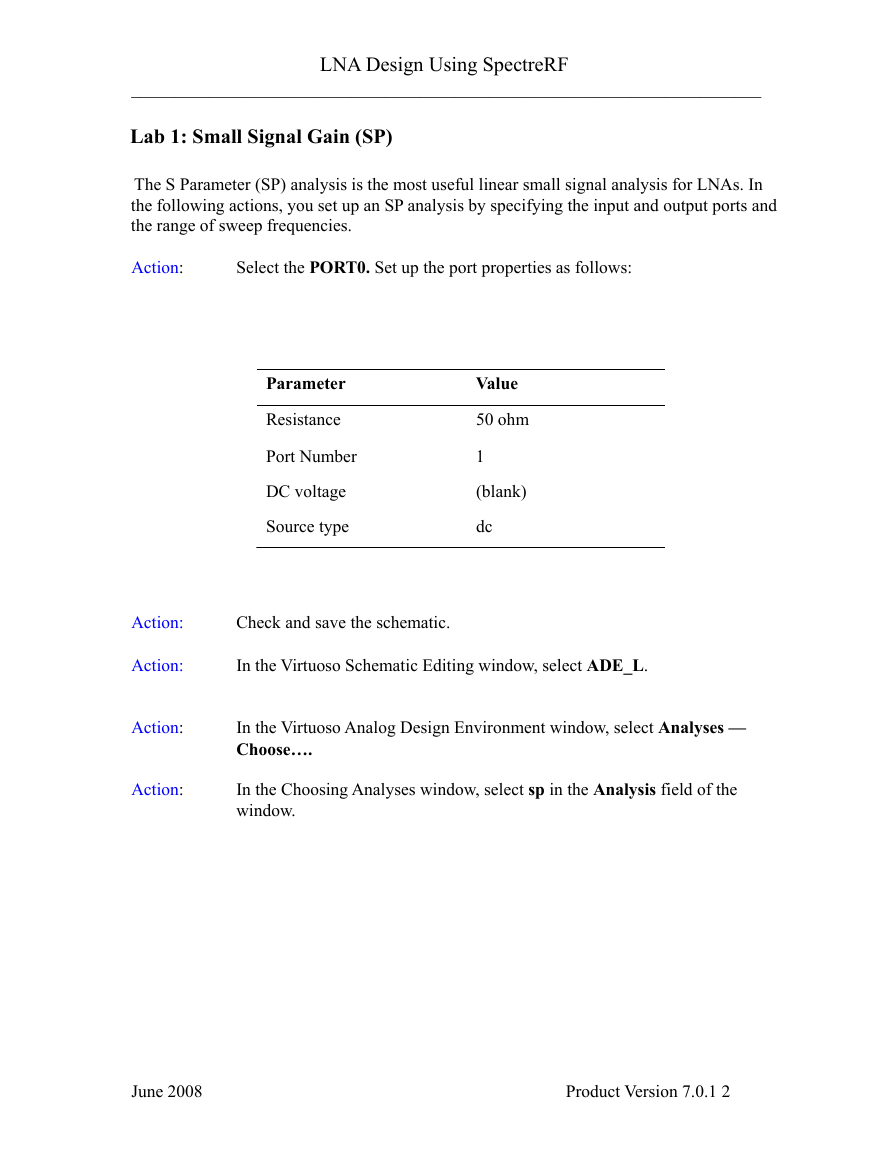
Select the PORT0. Set up the port properties as follows:
Parameter
Resistance
Value
50 ohm
Port Number
1
DC voltage
Source type
(blank)
dc
Action:
Action:
Action:
Action:
Check and save the schematic.
In the Virtuoso Schematic Editing window, select ADE_L.
In the Virtuoso Analog Design Environment window, select Analyses —
Choose….
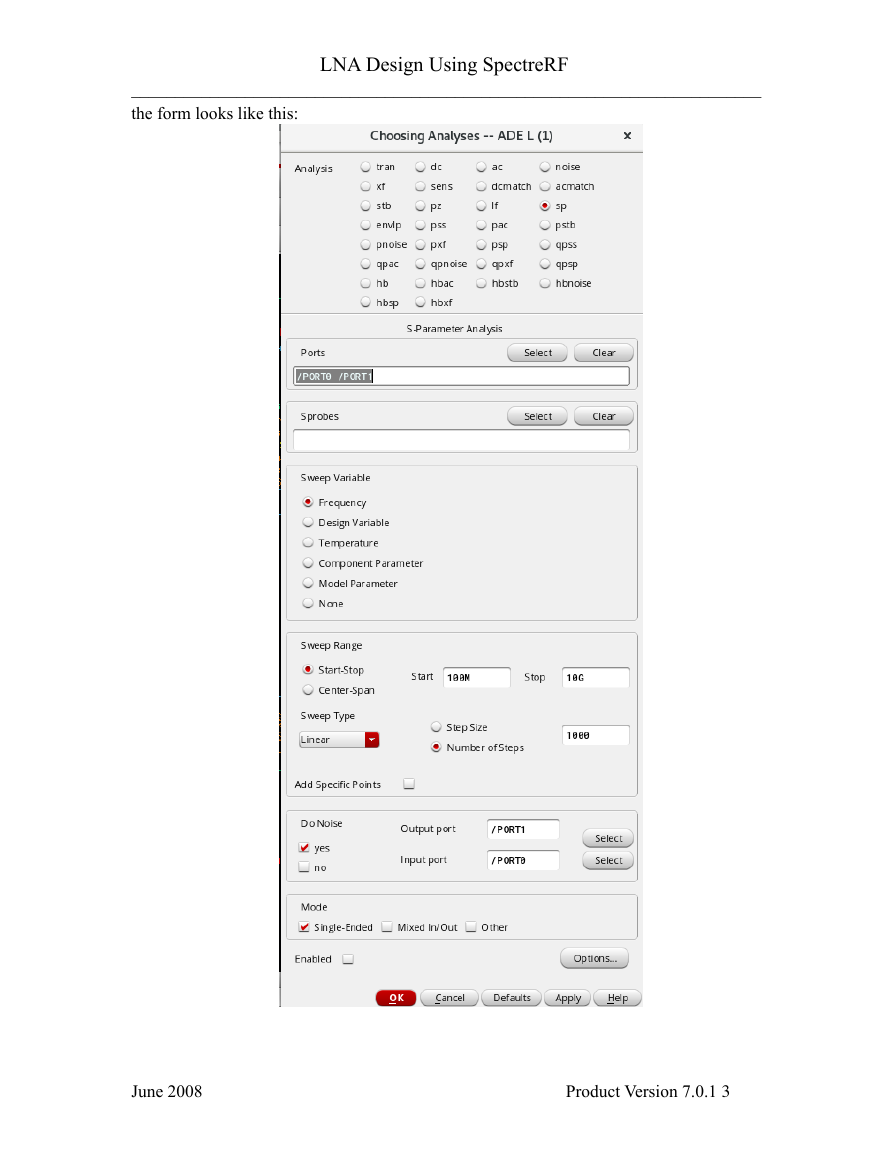
In the Choosing Analyses window, select sp in the Analysis field of the
window.
June 2008 Product Version 7.0.1 2
�
________________________________________________________________________
LNA Design Using SpectreRF
the form looks like this:
June 2008 Product Version 7.0.1 3
�
________________________________________________________________________
LNA Design Using SpectreRF
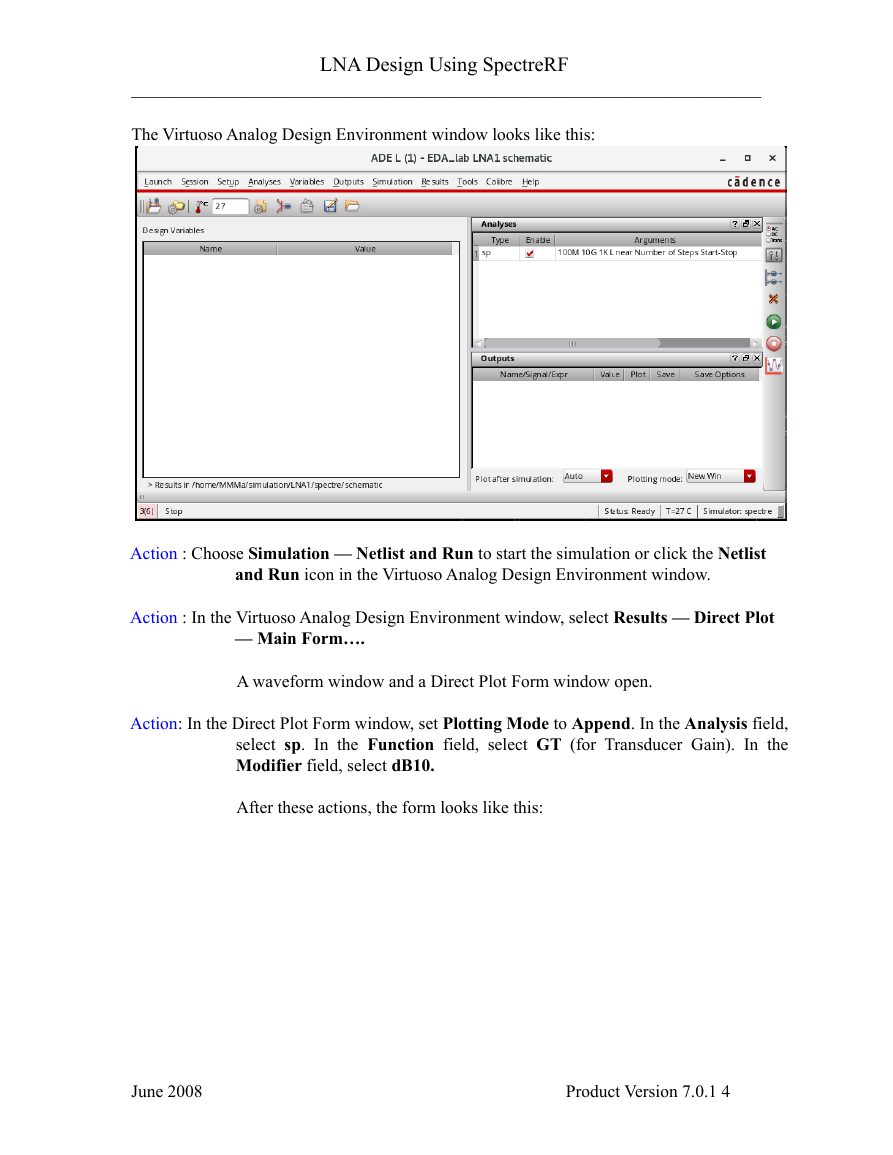
The Virtuoso Analog Design Environment window looks like this:
Action : Choose Simulation — Netlist and Run to start the simulation or click the Netlist
and Run icon in the Virtuoso Analog Design Environment window.
Action : In the Virtuoso Analog Design Environment window, select Results — Direct Plot
— Main Form….
A waveform window and a Direct Plot Form window open.
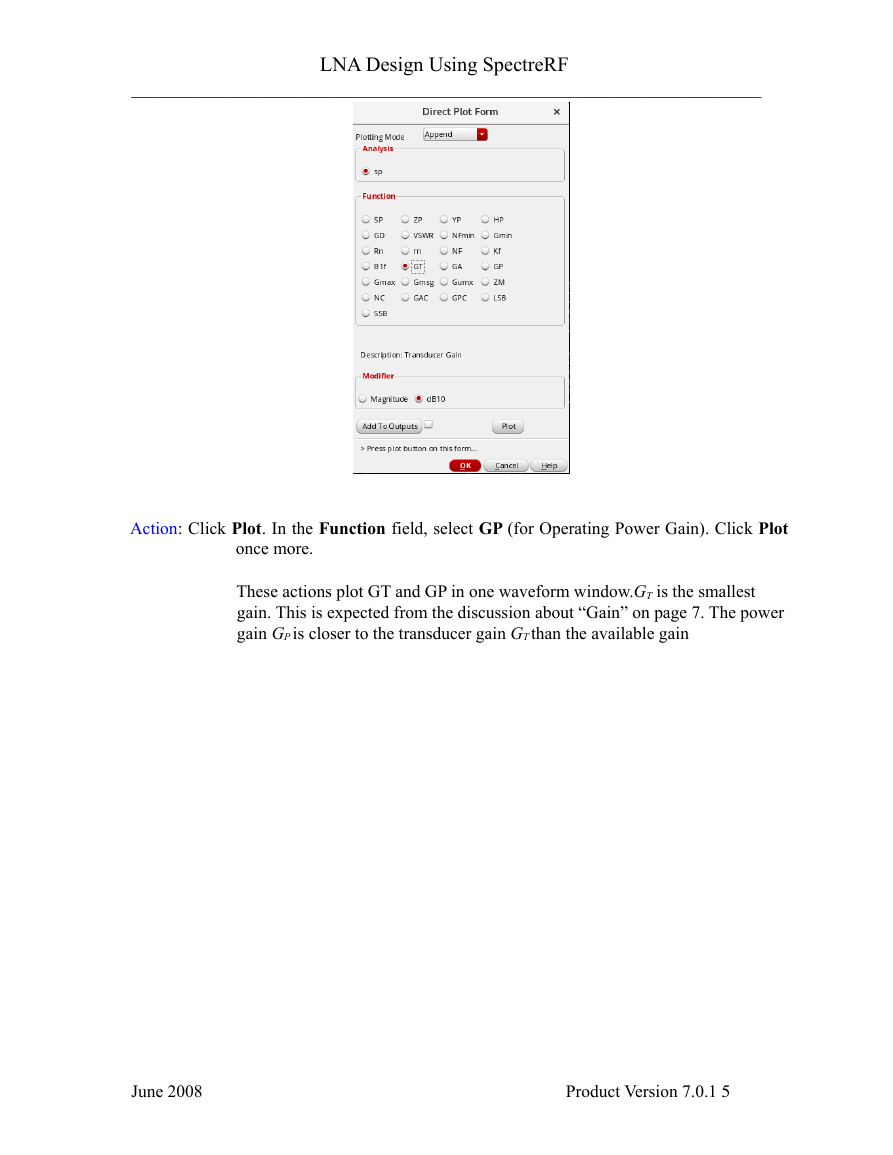
Action: In the Direct Plot Form window, set Plotting Mode to Append. In the Analysis field,
select sp. In the Function field, select GT (for Transducer Gain). In the
Modifier field, select dB10.
After these actions, the form looks like this:
June 2008 Product Version 7.0.1 4
�
________________________________________________________________________
LNA Design Using SpectreRF
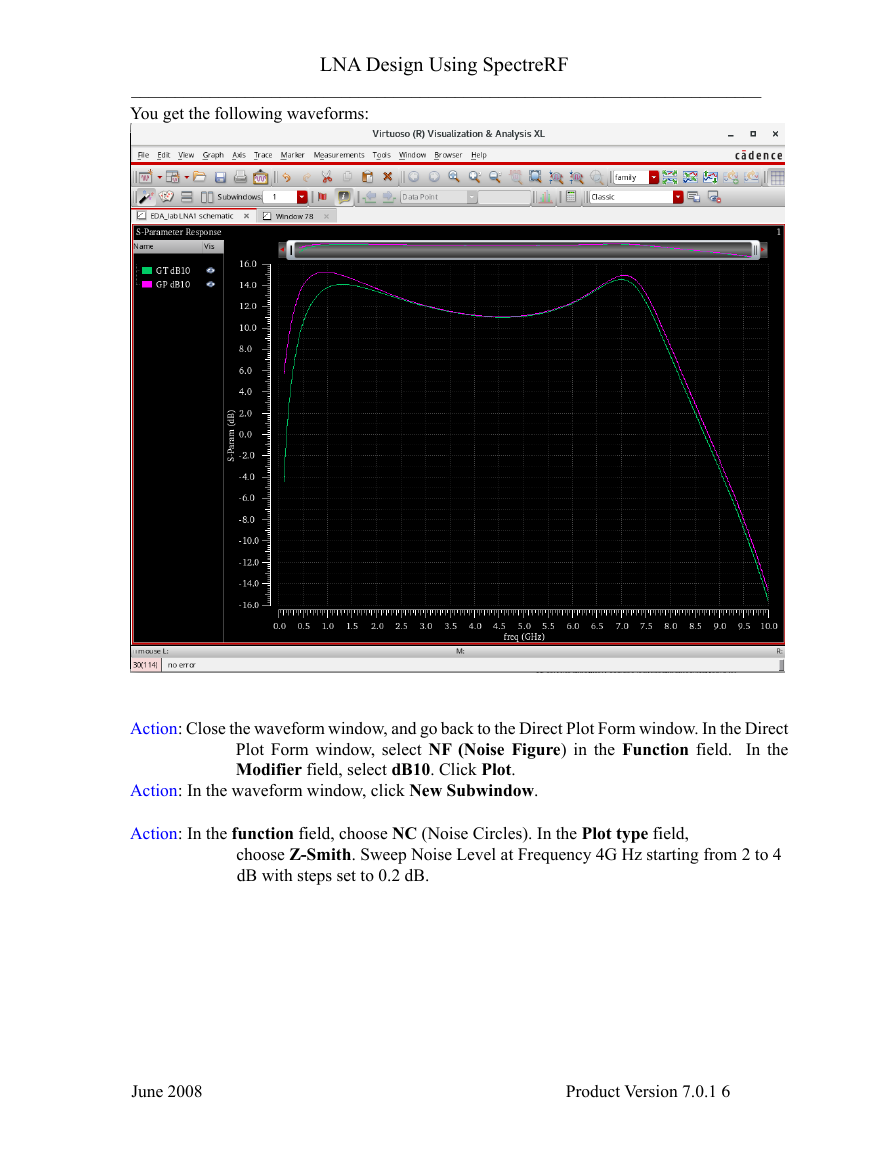
Action: Click Plot. In the Function field, select GP (for Operating Power Gain). Click Plot
once more.
These actions plot GT and GP in one waveform window.GT is the smallest
gain. This is expected from the discussion about “Gain” on page 7. The power
gain GP is closer to the transducer gain GT than the available gain
June 2008 Product Version 7.0.1 5
�
________________________________________________________________________
LNA Design Using SpectreRF
You get the following waveforms:
Action: Close the waveform window, and go back to the Direct Plot Form window. In the Direct
Plot Form window, select NF (Noise Figure) in the Function field. In the
Modifier field, select dB10. Click Plot.
Action: In the waveform window, click New Subwindow.
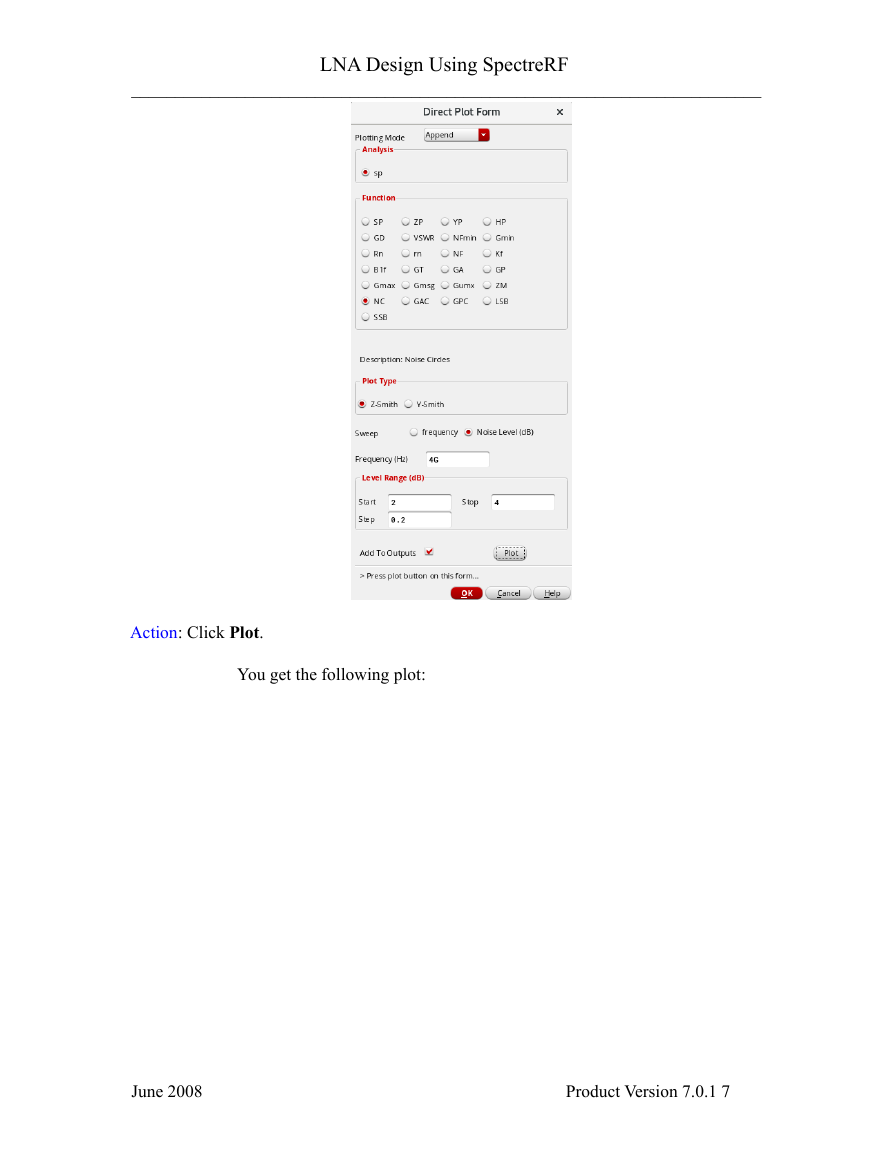
Action: In the function field, choose NC (Noise Circles). In the Plot type field,
choose Z-Smith. Sweep Noise Level at Frequency 4G Hz starting from 2 to 4
dB with steps set to 0.2 dB.
June 2008 Product Version 7.0.1 6
�
________________________________________________________________________
LNA Design Using SpectreRF
Action: Click Plot.
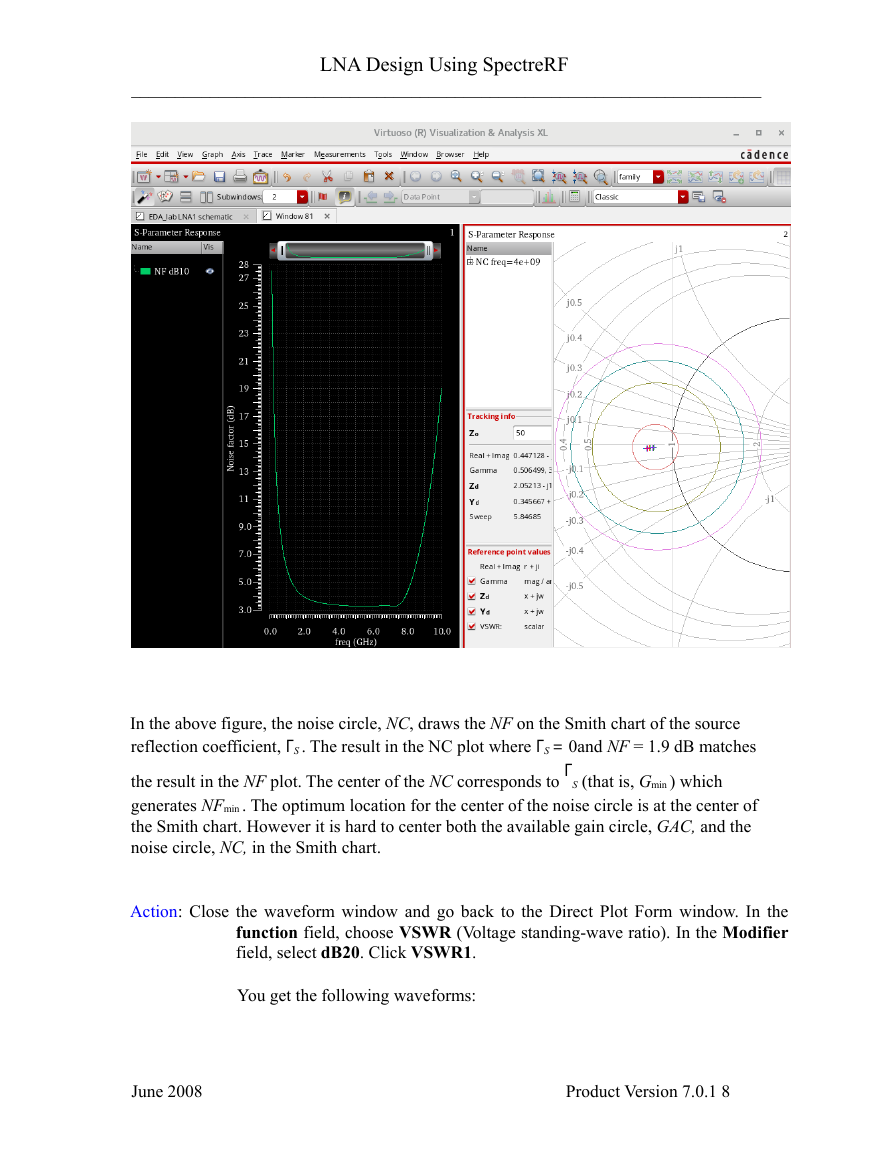
You get the following plot:
June 2008 Product Version 7.0.1 7
�
________________________________________________________________________
LNA Design Using SpectreRF
In the above figure, the noise circle, NC, draws the NF on the Smith chart of the source
reflection coefficient, ΓS . The result in the NC plot where ΓS = 0and NF = 1.9 dB matches
the result in the NF plot. The center of the NC corresponds to
S (that is, Gmin ) which
Γ
generates NFmin . The optimum location for the center of the noise circle is at the center of
the Smith chart. However it is hard to center both the available gain circle, GAC, and the
noise circle, NC, in the Smith chart.
Action: Close the waveform window and go back to the Direct Plot Form window. In the
function field, choose VSWR (Voltage standing-wave ratio). In the Modifier
field, select dB20. Click VSWR1.
You get the following waveforms:
June 2008 Product Version 7.0.1 8
�


 2023年江西萍乡中考道德与法治真题及答案.doc
 2012年重庆南川中考生物真题及答案.doc
 2013年江西师范大学地理学综合及文艺理论基础考研真题.doc
 2020年四川甘孜小升初语文真题及答案I卷.doc
 2020年注册岩土工程师专业基础考试真题及答案.doc
 2023-2024学年福建省厦门市九年级上学期数学月考试题及答案.doc
 2021-2022学年辽宁省沈阳市大东区九年级上学期语文期末试题及答案.doc
 2022-2023学年北京东城区初三第一学期物理期末试卷及答案.doc
 2018上半年江西教师资格初中地理学科知识与教学能力真题及答案.doc
 2012年河北国家公务员申论考试真题及答案-省级.doc
 2020-2021学年江苏省扬州市江都区邵樊片九年级上学期数学第一次质量检测试题及答案.doc
 2022下半年黑龙江教师资格证中学综合素质真题及答案.doc