logo资料库

Handbook_of_Functional_MRI_Data_Analysis_(0521517664).pdf

第1页 / 共239页
第2页 / 共239页
第3页 / 共239页
第4页 / 共239页
第5页 / 共239页
第6页 / 共239页
第7页 / 共239页
第8页 / 共239页
资料共239页,剩余部分请下载后查看
Title
Copyright
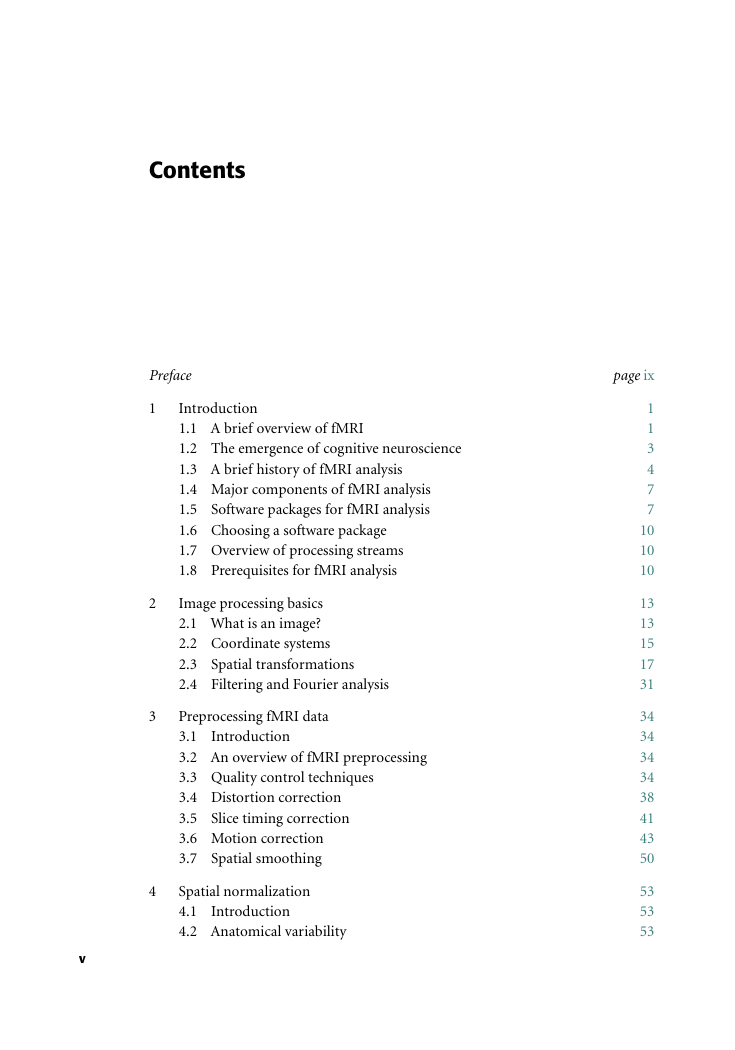
Contents
Preface
1 Introduction
1.1 A brief overview of fMRI
1.2 The emergence of cognitive neuroscience
1.3 A brief history of fMRI analysis
1.4 Major components of fMRI analysis
1.5 Software packages for fMRI analysis
1.6 Choosing a software package
1.7 Overview of processing streams
1.8 Prerequisites for fMRI analysis
2 Image processing basics
2.1 What is an image?
2.2 Coordinate systems
2.3 Spatial transformations
2.4 Filtering and Fourier analysis
3 Preprocessing fMRI data
3.1 Introduction
3.2 An overview of fMRI preprocessing
3.3 Quality control techniques
3.4 Distortion correction
3.5 Slice timing correction
3.6 Motion correction
3.7 Spatial smoothing
4 Spatial normalization
4.1 Introduction
4.2 Anatomical variability
4.3 Coordinate spaces for neuroimaging
4.4 Atlases and templates
4.4.1 The Talairach atlas
4.4.2 The MNI templates
4.5 Preprocessing of anatomical images
4.5.1 Bias field correction
4.5.2 Brain extraction
4.5.3 Tissue segmentation
4.6 Processing streams for fMRI normalization
4.7 Spatial normalization methods
4.7.1 Landmark-based methods
4.7.2 Volume-based registration
4.7.3 Computational anatomy
4.8 Surface-based methods
4.9 Choosing a spatial normalization method
4.10 Quality control for spatial normalization
4.11 Troubleshooting normalization problems
4.12 Normalizing data from special populations
5 Statistical modeling: Single subject analysis
5.1 The BOLD signal
5.2 The BOLD noise
5.2.1 Characterizing the noise
5.2.2 High-pass filtering
5.2.3 Prewhitening
5.2.4 Precoloring
5.3 Study design and modeling strategies
6 Statistical modeling: Group analysis
6.1 The mixed effects model
6.1.1 Motivation
6.1.2 Mixed effects modeling approach used in fMRI
6.1.3 Fixed effects models
6.2 Mean centering continuous covariates
6.2.1 Single group
6.2.2 Multiple groups
7 Statistical inference on images
7.1 Basics of statistical inference
7.2 Features of interest in images
7.3 The multiple testing problem and solutions
7.3.1 Familywise error rate
7.3.1.1 Bonferroni correction
7.3.1.2 Random field theory
7.3.1.3 Parametric simulations
7.3.1.4 Nonparametric approaches
7.3.2 False discovery rate
7.3.3 Inference example
7.4 Combining inferences: masking and conjunctions
7.5 Use of region of interest masks
7.6 Computing statistical power
8 Modeling brain connectivity
8.1 Introduction
8.2 Functional connectivity
8.2.1 Seed voxel correlation: Between-subjects
8.2.2 Seed voxel correlation: Within-subjects
8.2.2.1 Avoiding activation-induced correlations
8.2.3 Beta-series correlation
8.2.4 Psychophysiological interaction
8.2.4.1 Creating the PPI regressor
8.2.4.2 Potential problems with PPI
8.2.5 Multivariate decomposition
8.2.5.1 Principal components analysis
8.2.5.2 Independent components analysis
8.2.5.3 Performing ICA/PCA on group data
8.2.6 Partial least squares
8.3 Effective connectivity
8.4 Network analysis and graph theory
8.4.1 Small world networks
8.4.2 Modeling networks with resting-state fMRI data
8.4.3 Preprocessing for connectivity analysis
9 Multivoxel pattern analysis and machine learning
9.1 Introduction to pattern classification
9.1.1 An overview of the machine learning approach
9.1.1.1 Features, observations, and the “curse of dimensionality”
9.1.1.2 Overfitting
9.2 Applying classifiers to fMRI data
9.3 Data extraction
9.4 Feature selection
9.5 Training and testing the classifier
9.5.1 Feature selection/elimination
9.5.2 Classifiers for fMRI data
9.5.2.1 Linear vs. nonlinear classifiers
9.5.2.2 Computational limitations
9.5.2.3 Tendency to overfit
9.5.3 Which classifier is best?
9.5.4 Assessing classifier accuracy
9.6 Characterizing the classifier
10 Visualizing, localizing, and reporting fMRI data
10.1 Visualizing activation data
10.2 Localizing activation
10.2.1 The Talairach atlas
10.2.2 Anatomical atlases
10.2.3 Probabilistic atlases
10.2.4 Automated anatomical labeling
10.3 Localizing and reporting activation
10.4 Region of interest analysis
10.4.1 ROIs for statistical control
10.4.2 Defining ROIs
10.4.3 Quantifying signals within an ROI
10.4.3.1 Voxel-counting
10.4.3.2 Extracting signals for ROI analysis
10.4.3.3 Computing percent signal change
10.4.3.4 Summarizing data within an ROI
Appendix A: Review of the General Linear Model
A.1 Estimating GLM parameters
A.2 Hypothesis testing
A.3 Correlation and heterogeneous variances
A.4 Why "general'' linear model?
Appendix B: Data organization and management
B.1 Computing for fMRI analysis
B.2 Data organization
B.3 Project management
B.4 Scripting for data analysis
Appendix C: Image formats
C.1 Data storage
C.2 File formats
Bibliography
Index

Handbook of Functional MRI Data Analysis Functional magnetic resonance imaging (fMRI) has become the most popular method for imaging brain function. Handbook of Functional MRI Data Analysis provides a comprehensive and practical introduction to the methods used for fMRI data analysis. Using minimal jargon, this book explains the concepts behind processing fMRI data, focusing on the techniques that are most commonly used in the field. This book provides background about the methods employed by common data analysis packages including FSL, SPM, and AFNI. Some of the newest cutting-edge techniques, including pattern classification analysis, connectivity modeling, and resting state network analysis, are also discussed. Readers of this book, whether newcomers to the field or experienced researchers, will obtain a deep and effective knowledge of how to employ fMRI analysis to ask scientific questions and become more sophisticated users of fMRI analysis software. Dr. Russell A. Poldrack is the director of the Imaging Research Center and professor of Psychology and Neurobiology at the University of Texas at Austin. He has published more than 100 articles in the field of cognitive neuroscience, in journals including Science, Nature, Neuron, Nature Neuroscience, and PNAS. He is well known for his writings on how neuroimaging can be used to make inferences about psychological function, as well as for his research using fMRI and other imaging techniques to understand the brain systems that support learning and memory, decision making, and executive function. Dr. Jeanette A. Mumford is a research assistant professor in the Department of Psychology at the University of Texas at Austin. Trained in biostatistics, her research has focused on the development and characterization of new methods for statistical modeling and analysis of fMRI data. Her work has examined the impact of different group modeling strategies and developed new tools for modeling network structure in resting-state fMRI data. She is the developer of the fmriPower software package, which provides power analysis tools for fMRI data. Dr. Thomas E. Nichols is the head of Neuroimaging Statistics at the University of Warwick, United Kingdom. He has been working in functional neuroimaging since 1992, when he joined the University of Pittsburgh’s PET facility as programmer and statistician. He is known for his work on inference in brain imaging, using both parametric and nonparametric methods, and he is an active contributor to the FSL and SPM software packages. In 2009 he received the Wiley Young Investigator Award from the Organization for Human Brain Mapping in recognition for his contributions to statistical modeling and inference of neuroimaging data.
Handbook of Functional MRI Data Analysis Russell A. Poldrack University of Texas at Austin, Imaging Research Center Jeanette A. Mumford University of Texas at Austin Thomas E. Nichols University of Warwick
c a m b r i d g e u n i v e r s i t y p r e s s Cambridge, New York, Melbourne, Madrid, Cape Town, Singapore, São Paulo, Delhi, Tokyo, Mexico City Cambridge University Press 32 Avenue of the Americas, New York, NY 10013-2473, USA www.cambridge.org Informationonthistitle:www.cambridge.org/9780521517669 © Russell A. Poldrack, Jeanette A. Mumford, and Thomas E. Nichols, 2011 This publication is in copyright. Subject to statutory exception and to the provisions of relevant collective licensing agreements, no reproduction of any part may take place without the written permission of Cambridge University Press. First published 2011 Printed in China by Everbest A catalog record for this publication is available from the British Library. Library of Congress Cataloging in Publication data Poldrack, Russell A. Handbook of functional MRI data analysis / Russell A. Poldrack, Jeanette A. Mumford, Thomas E. Nichols. p. ; cm. Includes bibliographical references and index. ISBN 978-0-521-51766-9 (hardback) 1. Brain mapping – Statistical methods. 3. Magnetic resonance imaging. II. Nichols, Thomas E. [DNLM: Statistical. RC386.6.B7P65 2011 616.8 1. Magnetic Resonance Imaging. III. Title. 047548–dc22 2011010349 2. Brain – Imaging – Statistical methods. I. Mumford, Jeanette A., 1975– 4. Image Processing, Computer-Assisted – methods. WN 185] 2. Brain Mapping. 3. Data Interpretation, ISBN 978-0-521-51766-9 Hardback Cambridge University Press has no responsibility for the persistence or accuracy of URLs for external or third-party Internet Web sites referred to in this publication and does not guarantee that any content on such Web sites is, or will remain, accurate or appropriate.
Contents Preface page ix 1 2 3 4 Introduction 1.1 A brief overview of fMRI 1.2 The emergence of cognitive neuroscience 1.3 A brief history of fMRI analysis 1.4 Major components of fMRI analysis 1.5 Software packages for fMRI analysis 1.6 Choosing a software package 1.7 Overview of processing streams 1.8 Prerequisites for fMRI analysis Image processing basics 2.1 What is an image? 2.2 Coordinate systems 2.3 Spatial transformations 2.4 Filtering and Fourier analysis Preprocessing fMRI data 3.1 Introduction 3.2 An overview of fMRI preprocessing 3.3 Quality control techniques 3.4 Distortion correction 3.5 Slice timing correction 3.6 Motion correction 3.7 Spatial smoothing Spatial normalization 4.1 Introduction 4.2 Anatomical variability v 1 1 3 4 7 7 10 10 10 13 13 15 17 31 34 34 34 34 38 41 43 50 53 53 53
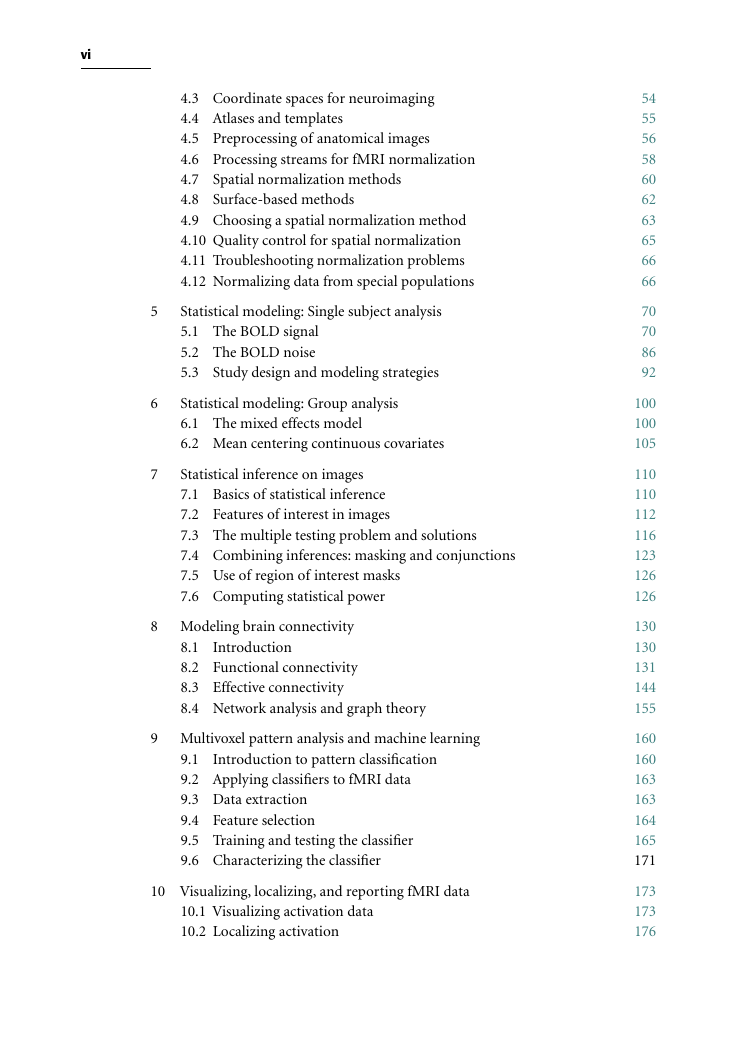
vi 4.3 Coordinate spaces for neuroimaging 4.4 Atlases and templates 4.5 Preprocessing of anatomical images 4.6 Processing streams for fMRI normalization 4.7 Spatial normalization methods 4.8 Surface-based methods 4.9 Choosing a spatial normalization method 4.10 Quality control for spatial normalization 4.11 Troubleshooting normalization problems 4.12 Normalizing data from special populations Statistical modeling: Single subject analysis 5.1 The BOLD signal 5.2 The BOLD noise 5.3 Study design and modeling strategies Statistical modeling: Group analysis 6.1 The mixed effects model 6.2 Mean centering continuous covariates Statistical inference on images 7.1 Basics of statistical inference 7.2 Features of interest in images 7.3 The multiple testing problem and solutions 7.4 Combining inferences: masking and conjunctions 7.5 Use of region of interest masks 7.6 Computing statistical power 5 6 7 8 Modeling brain connectivity 8.1 Introduction 8.2 Functional connectivity 8.3 Effective connectivity 8.4 Network analysis and graph theory 9 Multivoxel pattern analysis and machine learning 9.1 Introduction to pattern classification 9.2 Applying classifiers to fMRI data 9.3 Data extraction 9.4 Feature selection 9.5 Training and testing the classifier 9.6 Characterizing the classifier 10 Visualizing, localizing, and reporting fMRI data 10.1 Visualizing activation data 10.2 Localizing activation 54 55 56 58 60 62 63 65 66 66 70 70 86 92 100 100 105 110 110 112 116 123 126 126 130 130 131 144 155 160 160 163 163 164 165 171 173 173 176
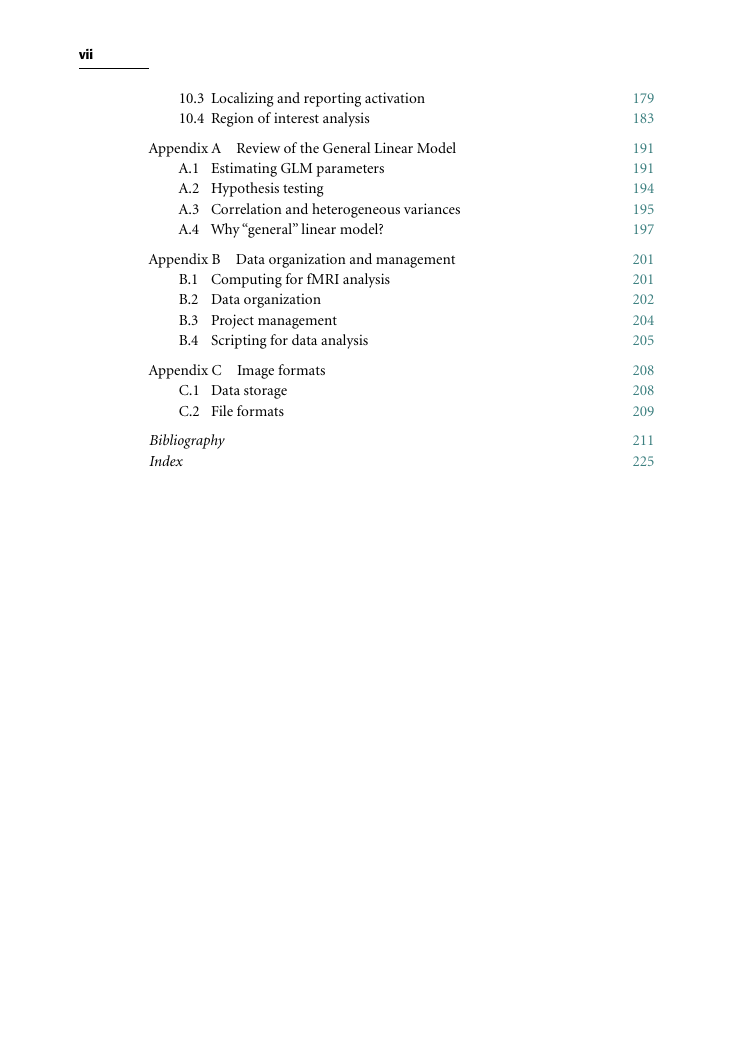
vii 10.3 Localizing and reporting activation 10.4 Region of interest analysis Appendix A Review of the General Linear Model A.1 Estimating GLM parameters A.2 Hypothesis testing A.3 Correlation and heterogeneous variances A.4 Why “general” linear model? Appendix B Data organization and management B.1 Computing for fMRI analysis B.2 Data organization B.3 Project management B.4 Scripting for data analysis Appendix C Image formats C.1 Data storage C.2 File formats Bibliography Index 179 183 191 191 194 195 197 201 201 202 204 205 208 208 209 211 225
分享到:
收藏