Journal of Computer and Communications, 2019, 7, 54-64
https://www.scirp.org/journal/jcc
ISSN Online: 2327-5227
ISSN Print: 2327-5219
Design and Implementation of NBA Playoff
Prediction Method Based on ELO Algorithm and
Graph Database
Song Yan, Siyuan Meng, Qiwei Liu, Jing Li*
Department of Computer Science and Technology, Shandong University of Technology, Zibo, China
How to cite this paper: Yan, S., Meng,
S.Y., Liu, Q.W. and Li, J. (2019) Design and
Implementation of NBA Playoff Prediction
Method Based on ELO Algorithm and Graph
Database. Journal of Computer and Com-
munications, 7, 54-64.
https://doi.org/10.4236/jcc.2019.711004
Received: September 10, 2019
Accepted: November 2, 2019
Published: November 5, 2019
Copyright © 2019 by author(s) and
Scientific Research Publishing Inc.
This work is licensed under the Creative
Commons Attribution International
License (CC BY 4.0).
http://creativecommons.org/licenses/by/4.0/
Abstract
With the globalization of NBA, all eyes on the NBA playoffs are around the
world. Ones celebrate the winning of their team which they like. Especially,
NBA fans keep on predicting the playoffs game results. However, prediction
of winning probability of teams in NBA playoffs is challenging. In order to
meet the challenges, we proposed a method using ELO algorithm for predic-
tion and leveraging Graph Database, Neo4j, for implementation. Experiment
results show that, the design and implementation of the prediction system
could work to some degree.
Keywords
The NBA Playoffs, Graph Database, Neo4j, ELO Algorithm
Open Access
1. Introduction
Physical fitness has become a simple and effective way to keep fit in our daily
life. It not only allows people to release and entertain themselves in today’s
fast-paced life but also makes their bodies stronger. As a sport, basketball is very
popular among teenagers. As the highest level basketball game in the world, the
NBA attracts billions of audiences every year in the playoffs, and the wins and
losses of each game also create a very considerable operating profit for the gam-
bling companies. The gambling companies give the winning odds of each team
according to their unique prediction algorithm. Pan et al. put forward a method
of NBA playoff prediction based on support vector machine, which has good
prediction effect [1]. Qiu et al. put forward a new method for calculating the
team’s comprehensive strength, and established the Logistic model and Bayes
DOI: 10.4236/jcc.2019.711004 Nov. 5, 2019
54
Journal of Computer and Communications
�
S. Yan et al.
discriminant model [2]. The forecasting method we proposed is different from
the above. We use graph database to implement ELO algorithm invented by Elo.
In this paper, our main contribution is that we proposed to use the improved
ELO algorithm to predict the winning rate. ELO grading system is a method es-
tablished by Elo, an American physicist of Hungarian origin, to measure the lev-
el of players in all kinds of games. It is an authoritative method to evaluate the
level of games, and store all the data in graph database Neo4j. Experiment results
show that, the design and implementation of the prediction system could work
to some degree.
The rest of the paper is organized as follows: in Section 2, we introduce the
preliminary. Section 3 introduces the architecture of this prediction system in
detail, which consists of three parts: data preparation, data storage and query.
Section 4 gives the algorithm of the system. In Section 5, we will discuss case
testing. In Section 6, we review the relevant work and draw conclusions in Sec-
tion 7.
2. Preliminary
2.1. Graph Database and Neo4j
A graph database is a database whose data model conforms to some forms of
graph (or network or link) structure. The graph data model usually consists of
nodes (or vertices) and (directed) edges (or arcs or links), where the nodes
represent concepts (or objects) and the edges represent relationships (or connec-
tions) between these concepts (objects) [3]. Graph database management system
is an online database management system, which also has the methods of add-
ing, deleting, changing and searching graph data model. Graph database apply
graph into the ability of storing data, which is a kind of high-performance data
structure to store a large amount of data. It allows us to construct arbitrarily
complex models freely by assembling nodes and connections with simple and
abstract characteristics into relational structures, and to visually map the issues
we want to describe. Graph databases show the advantages of its performance,
flexibility, and agility. And now Neo4j has become one of the most commonly
used graph databases.
Neo4j is one of the most prominent open source graph databases available. It
allows developers to persist data more naturally from domains such as social
networking and recommendation engines, where representing data as a graph of
interconnected nodes is a natural choice. Neo4j significantly outperforms rela-
tional databases when querying graph data and it supports large data sets while
preserving full transactional database attributes [4]. Neo4j is one of the NoSQL
graph database management system. It stores data in a variety of graphs in the
form of networks or trees. It can vividly and intuitively describe the real world. It
is stable and efficient in the efficiency of the query and does not make the query
performance to a lower level unlike the relational databases with the increase of
the amount of data.
55
Journal of Computer and Communications
DOI: 10.4236/jcc.2019.711004
�
S. Yan et al.
The main features of Neo4j: first, it consists of the nodes, relations, and attributes.
Second, the attribute of a relation or a node is a Key-Value data set. Third, every
relation has its own head node and tail node. Fourth, relationships can have no
attribute.
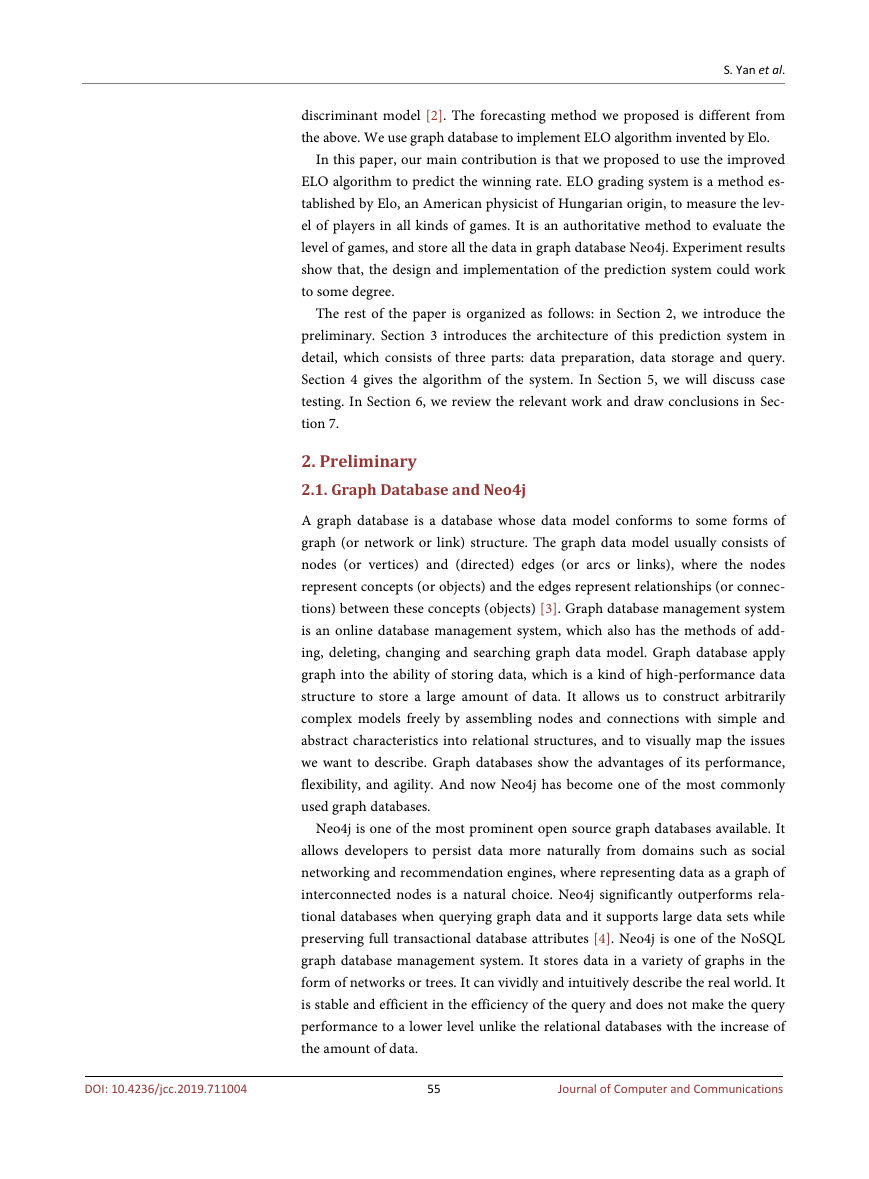
The details are shown in Figure 1: the entities are represented as the four co-
lored nodes in the diagram, where the red ones represent teams and the pink
ones represent playoff rounds. The attributes in the figure are entities’ names:
“San Antonio”, “Golden State”, “First Round” and “Conference Finals”. The re-
lationship in the graph shows that WIN and RWIN represent the winning rela-
tionship of playoff and regular season respectively.
2.2. ELO Algorithm
With the development of the network and the improvement of people’s living
standards, many people will compete in all kinds of competitions on the net-
work. At present, in all major competitive platforms, there is a lack of a ranking
system to judge the competitive level of users in competitive competitions. In-
ternational ranking is also called “FIBA ranking” or “ELO score”. It was de-
signed by Elo (1903-1992), an American Professor born in Hungary. It was drafted
by the International Chess Federation Hierarchy Committee. It was adopted by
the 1969 Plenary Session of the International Chess Federation and was formally
implemented since 1970 [5].
ELO Rating Algorithm is widely used rating algorithm for ranking players in
many competitive games. Players with higher ELO rating have a higher proba-
bility of winning a game than a player with lower ELO rating. ELO grading sys-
tem is a method for calculating the overall level of both sides in a competition. It
is an official method for evaluating the level of competition between two or
groups at present. At present, it is mainly used in chess, football, basketball and
electronic sports.
DOI: 10.4236/jcc.2019.711004
Figure 1. Neo4J diagram data example.
56
Journal of Computer and Communications
�
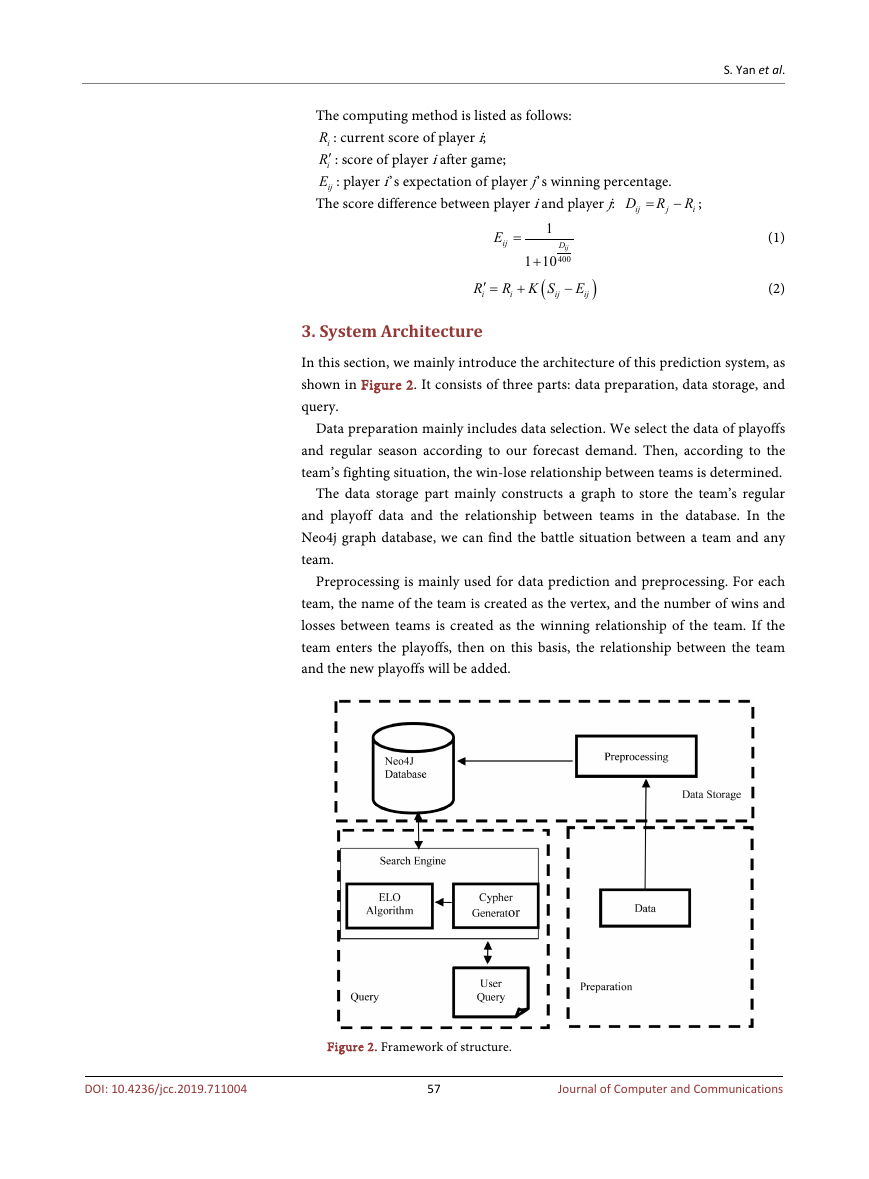
The computing method is listed as follows:
iR : current score of player i;
iR′ : score of player i after game;
ijE : player i’s expectation of player j’s winning percentage.
D R
The score difference between player i and player j:
−
j
=
ij
S. Yan et al.
R
i
;
1
E =
ij
1 10
+
(
R K S
+
i
i
′ =
R
i
(1)
D
ij
400
−
E
i
j
j
)
(2)
3. System Architecture
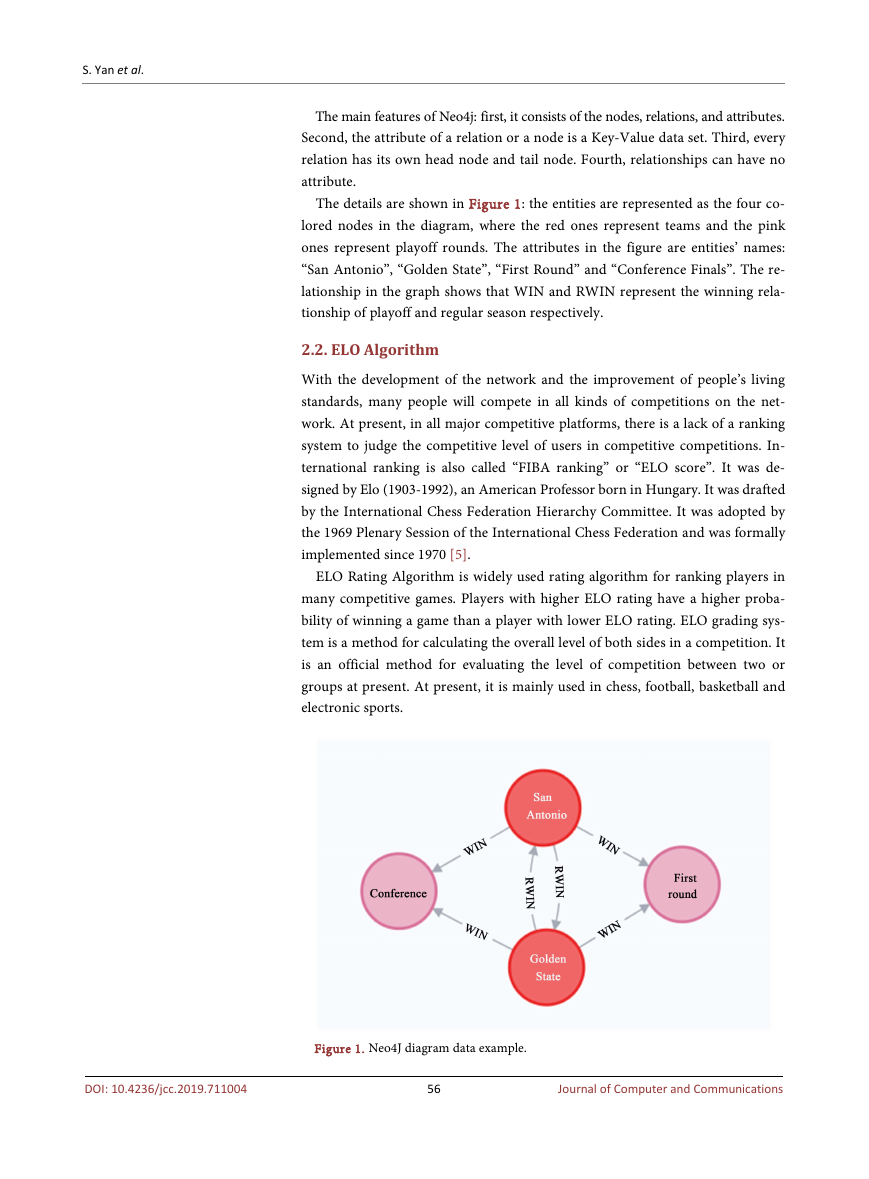
In this section, we mainly introduce the architecture of this prediction system, as
shown in Figure 2. It consists of three parts: data preparation, data storage, and
query.
Data preparation mainly includes data selection. We select the data of playoffs
and regular season according to our forecast demand. Then, according to the
team’s fighting situation, the win-lose relationship between teams is determined.
The data storage part mainly constructs a graph to store the team’s regular
and playoff data and the relationship between teams in the database. In the
Neo4j graph database, we can find the battle situation between a team and any
team.
Preprocessing is mainly used for data prediction and preprocessing. For each
team, the name of the team is created as the vertex, and the number of wins and
losses between teams is created as the winning relationship of the team. If the
team enters the playoffs, then on this basis, the relationship between the team
and the new playoffs will be added.
DOI: 10.4236/jcc.2019.711004
Figure 2. Framework of structure.
57
Journal of Computer and Communications
�
S. Yan et al.
The query part mainly queries the data needed for team winning rate calcula-
tion, queries each part of the data through Cypher language, then calculates each
part of the data through ELO algorithm, and finally obtains the team winning
probability.
4. Modified ELO Algorithm
The ELO algorithm was originally used in chess to calculate and evaluate the
rank of two players. So we need to modify it if we want to use it in basketball
game prediction. The modified ELO algorithm is listed as follows:
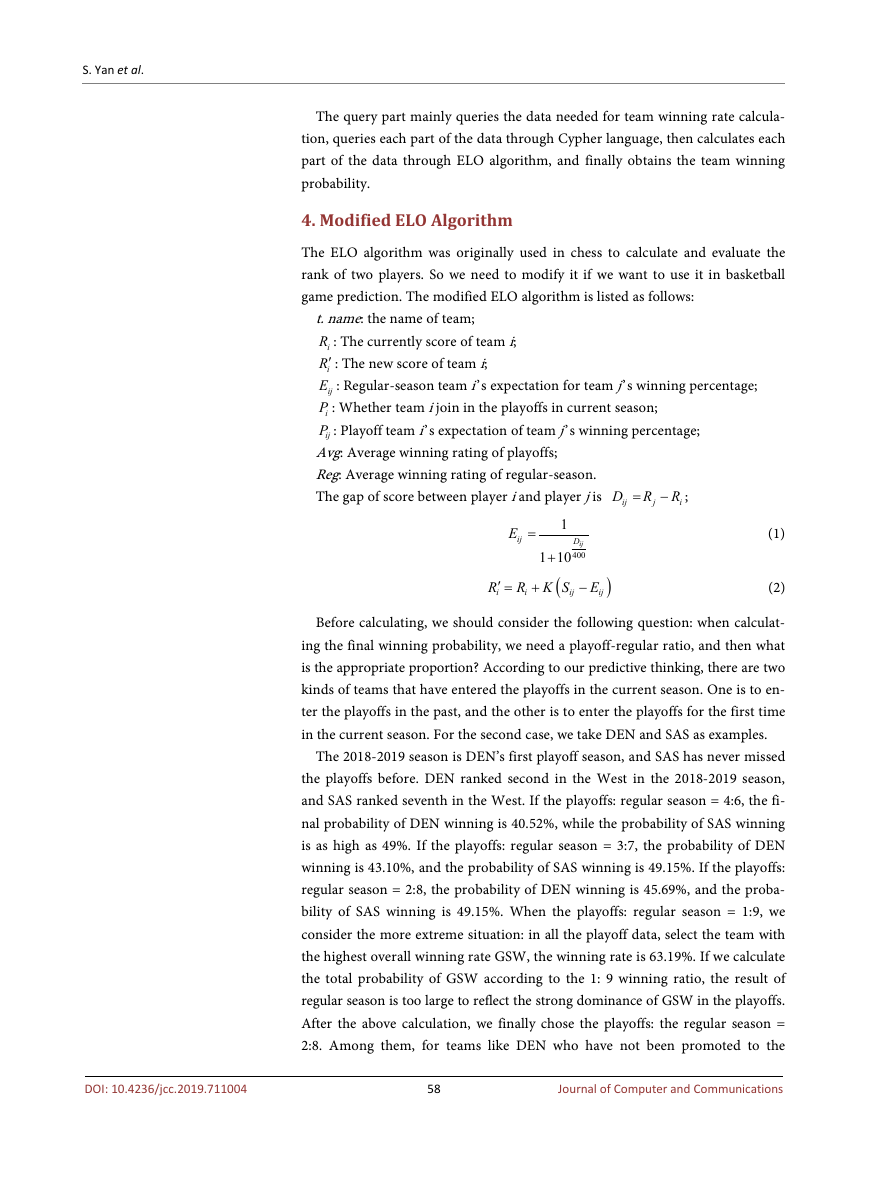
t. name: the name of team;
iR : The currently score of team i;
iR′ : The new score of team i;
ijE : Regular-season team i’s expectation for team j’s winning percentage;
iP : Whether team i join in the playoffs in current season;
ijP : Playoff team i’s expectation of team j’s winning percentage;
Avg: Average winning rating of playoffs;
Reg: Average winning rating of regular-season.
The gap of score between player i and player j is
D R
=
−
R
i
;
ij
j
1
E =
ij
1 10
+
(
R K S
i
+
i
′ =
R
i
(1)
D
ij
400
−
E
i
j
j
)
(2)
Before calculating, we should consider the following question: when calculat-
ing the final winning probability, we need a playoff-regular ratio, and then what
is the appropriate proportion? According to our predictive thinking, there are two
kinds of teams that have entered the playoffs in the current season. One is to en-
ter the playoffs in the past, and the other is to enter the playoffs for the first time
in the current season. For the second case, we take DEN and SAS as examples.
The 2018-2019 season is DEN’s first playoff season, and SAS has never missed
the playoffs before. DEN ranked second in the West in the 2018-2019 season,
and SAS ranked seventh in the West. If the playoffs: regular season = 4:6, the fi-
nal probability of DEN winning is 40.52%, while the probability of SAS winning
is as high as 49%. If the playoffs: regular season = 3:7, the probability of DEN
winning is 43.10%, and the probability of SAS winning is 49.15%. If the playoffs:
regular season = 2:8, the probability of DEN winning is 45.69%, and the proba-
bility of SAS winning is 49.15%. When the playoffs: regular season = 1:9, we
consider the more extreme situation: in all the playoff data, select the team with
the highest overall winning rate GSW, the winning rate is 63.19%. If we calculate
the total probability of GSW according to the 1: 9 winning ratio, the result of
regular season is too large to reflect the strong dominance of GSW in the playoffs.
After the above calculation, we finally chose the playoffs: the regular season =
2:8. Among them, for teams like DEN who have not been promoted to the
58
Journal of Computer and Communications
DOI: 10.4236/jcc.2019.711004
�
S. Yan et al.
playoffs, we calculate the winning rate of the regular season with the opponent:
the winning rate of the regular season = 2:8. The verification method is the same
as above.
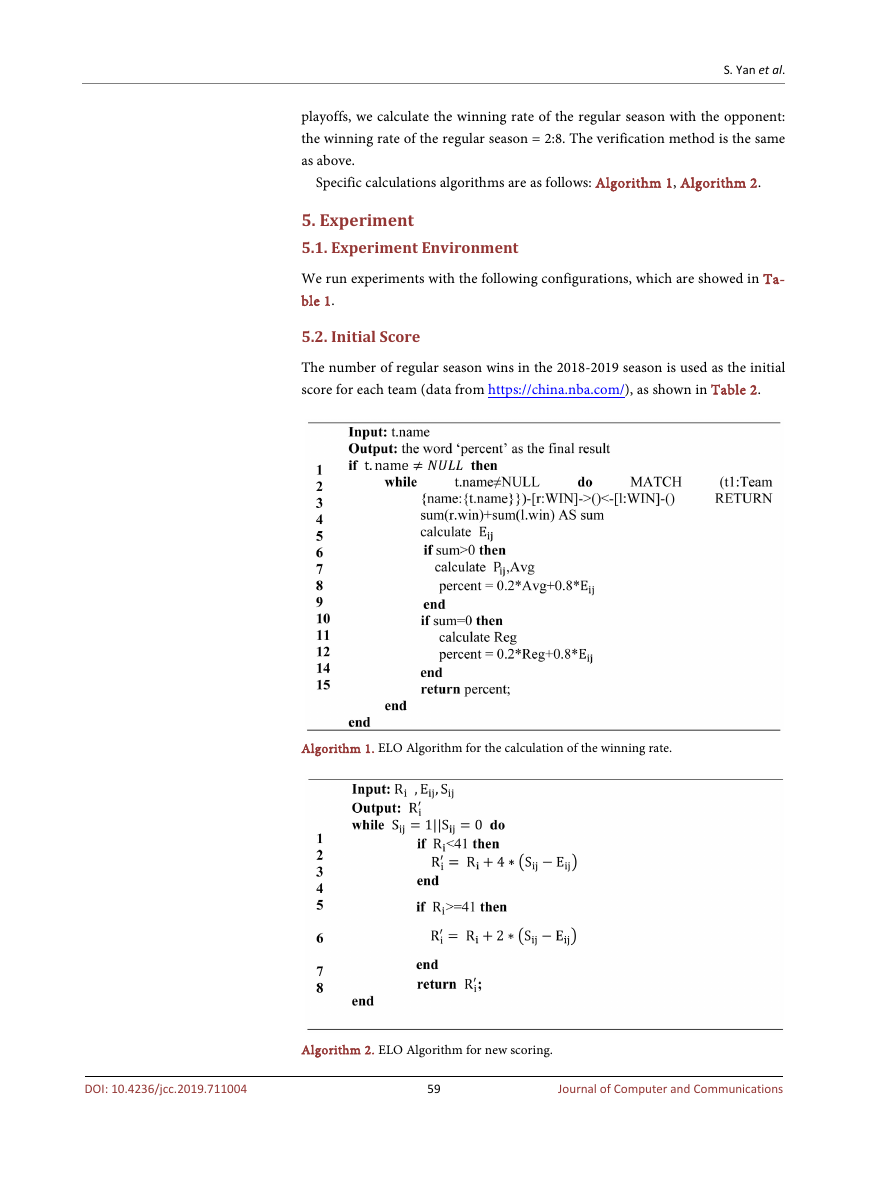
Specific calculations algorithms are as follows: Algorithm 1, Algorithm 2.
5. Experiment
5.1. Experiment Environment
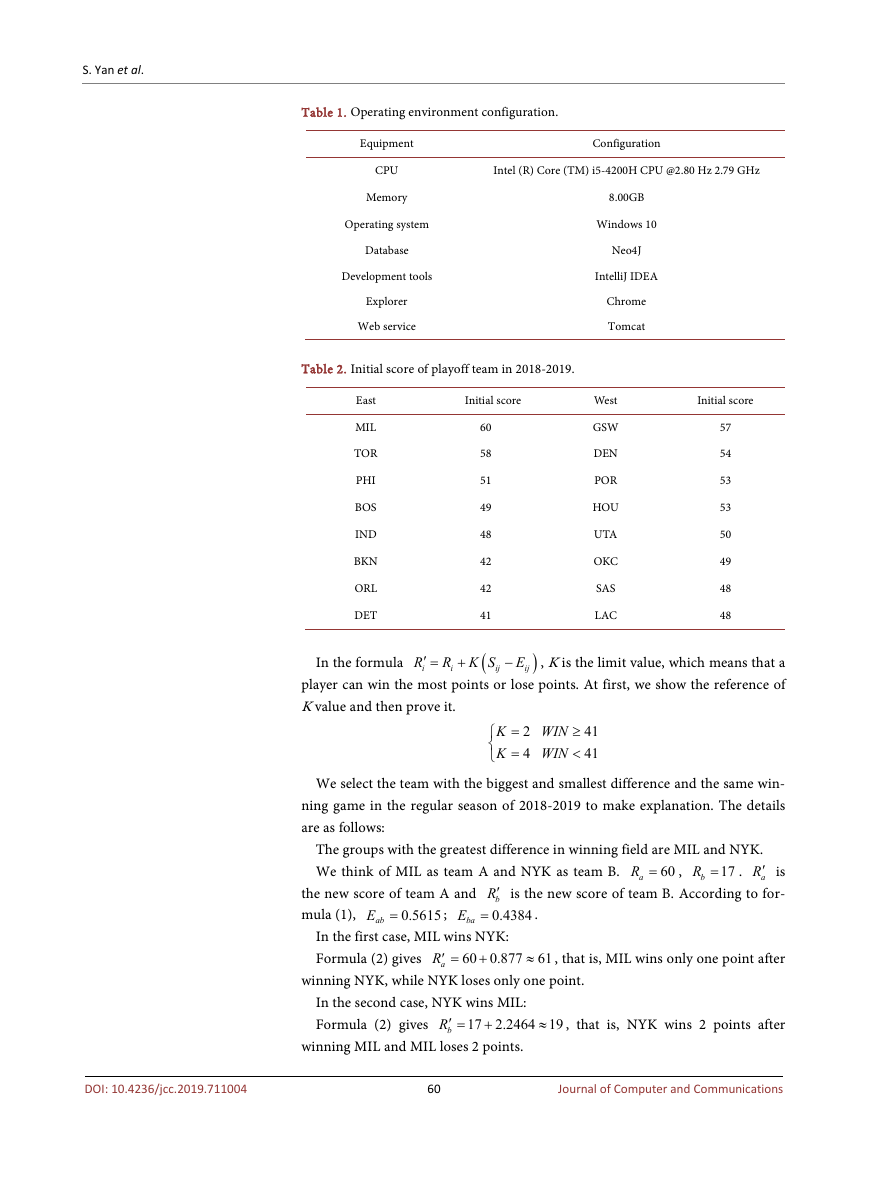
We run experiments with the following configurations, which are showed in Ta-
ble 1.
5.2. Initial Score
The number of regular season wins in the 2018-2019 season is used as the initial
score for each team (data from https://china.nba.com/), as shown in Table 2.
Algorithm 1. ELO Algorithm for the calculation of the winning rate.
DOI: 10.4236/jcc.2019.711004
Algorithm 2. ELO Algorithm for new scoring.
59
Journal of Computer and Communications
�
S. Yan et al.
Table 1. Operating environment configuration.
Configuration
Intel (R) Core (TM) i5-4200H CPU @2.80 Hz 2.79 GHz
8.00GB
Windows 10
Neo4J
IntelliJ IDEA
Chrome
Tomcat
West
GSW
DEN
POR
HOU
UTA
OKC
SAS
LAC
Initial score
57
54
53
53
50
49
48
48
Equipment
CPU
Memory
Operating system
Database
Development tools
Explorer
Web service
Table 2. Initial score of playoff team in 2018-2019.
East
MIL
TOR
PHI
BOS
IND
BKN
ORL
DET
Initial score
60
58
51
49
48
42
42
41
(
R K S
i
+
′ =
R
i
In the formula
, K is the limit value, which means that a
player can win the most points or lose points. At first, we show the reference of
K value and then prove it.
E
i
−
i
j
)
j
K
=
=
K
2
4
WIN
WIN
≥
<
41
41
We select the team with the biggest and smallest difference and the same win-
ning game in the regular season of 2018-2019 to make explanation. The details
are as follows:
The groups with the greatest difference in winning field are MIL and NYK.
We think of MIL as team A and NYK as team B.
60
.
aR′ is
bR′ is the new score of team B. According to for-
0.4384
aR =
bR =
17
,
.
the new score of team A and
baE =
mula (1),
0.5615
abE =
;
In the first case, MIL wins NYK:
Formula (2) gives
60 0.877
′
aR =
+
≈
61
, that is, MIL wins only one point after
winning NYK, while NYK loses only one point.
In the second case, NYK wins MIL:
Formula (2) gives
17 2.2464 19
′
bR =
+
≈
, that is, NYK wins 2 points after
DOI: 10.4236/jcc.2019.711004
winning MIL and MIL loses 2 points.
60
Journal of Computer and Communications
�
S. Yan et al.
5.3. Case Study
All data in this paper are selected from the 2015-2018 playoffs and 2018-2019
regular season data (data resource from https://china.nba.com/). We chose two
teams GSW and HOU as a simple example in this section. Cypher query state-
ments for postseason winning rate:
Cypher query statement on playoff match between two teams:
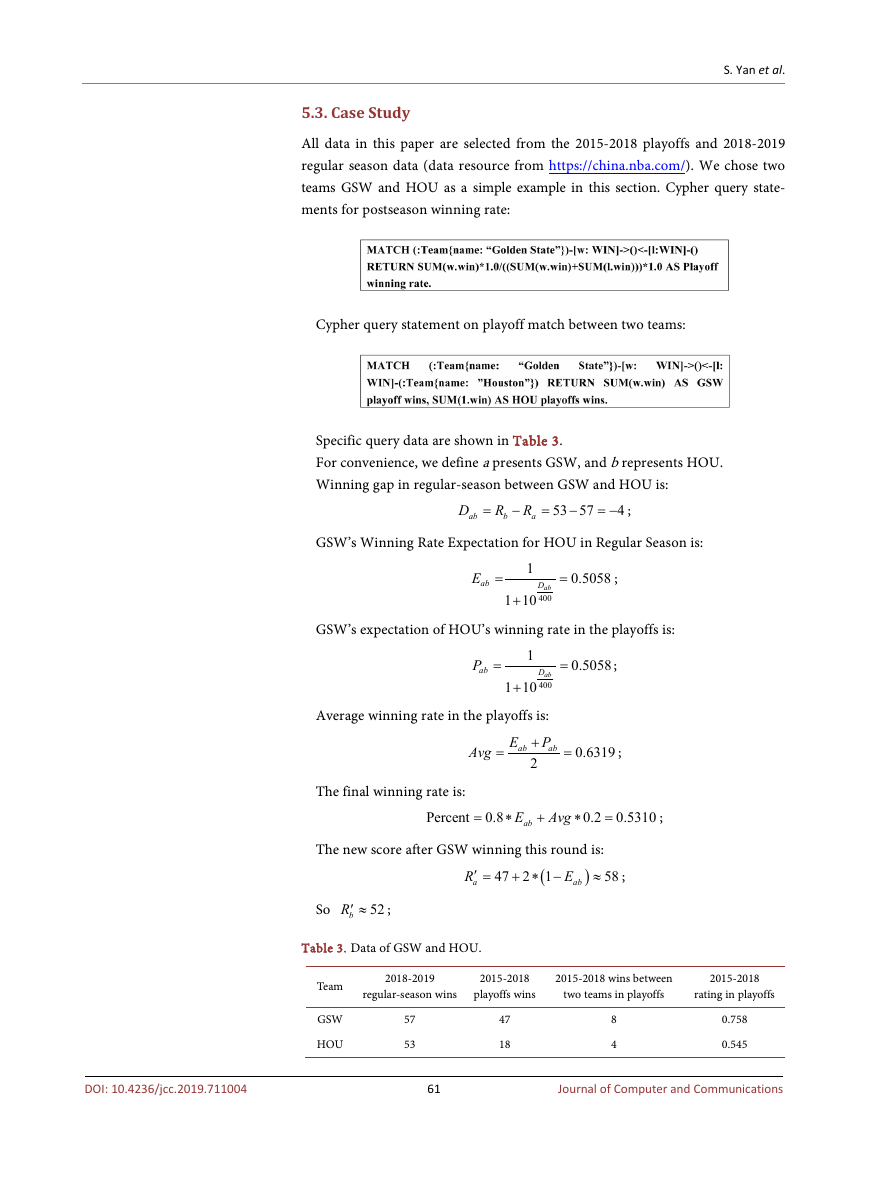
Specific query data are shown in Table 3.
For convenience, we define a presents GSW, and b represents HOU.
Winning gap in regular-season between GSW and HOU is:
D
ab
=
R
b
−
R
a
=
53 57
−
= − ;
4
GSW’s Winning Rate Expectation for HOU in Regular Season is:
E =
ab
1
1 10
+
D
ab
400
=
0.5058
;
GSW’s expectation of HOU’s winning rate in the playoffs is:
P =
ab
1
D
ab
400
1 10
+
=
0.5058
;
Average winning rate in the playoffs is:
P+
ab
2
Avg
E
ab
=
=
0.6319
;
The final winning rate is:
Per ent
c
=
0.8
∗
abE
+
Avg
∗
0.2
=
0.531
0
;
The new score after GSW winning this round is:
≈
(
1
+ ∗ −
47 2
′ =
R
a
E
ab
)
58
;
bR′ ≈
52
;
So
Table 3. Data of GSW and HOU.
Team
GSW
HOU
2018-2019
regular-season wins
2015-2018
playoffs wins
2015-2018 wins between
two teams in playoffs
2015-2018
rating in playoffs
57
53
47
18
8
4
0.758
0.545
61
Journal of Computer and Communications
DOI: 10.4236/jcc.2019.711004
�


 2023年江西萍乡中考道德与法治真题及答案.doc
 2012年重庆南川中考生物真题及答案.doc
 2013年江西师范大学地理学综合及文艺理论基础考研真题.doc
 2020年四川甘孜小升初语文真题及答案I卷.doc
 2020年注册岩土工程师专业基础考试真题及答案.doc
 2023-2024学年福建省厦门市九年级上学期数学月考试题及答案.doc
 2021-2022学年辽宁省沈阳市大东区九年级上学期语文期末试题及答案.doc
 2022-2023学年北京东城区初三第一学期物理期末试卷及答案.doc
 2018上半年江西教师资格初中地理学科知识与教学能力真题及答案.doc
 2012年河北国家公务员申论考试真题及答案-省级.doc
 2020-2021学年江苏省扬州市江都区邵樊片九年级上学期数学第一次质量检测试题及答案.doc
 2022下半年黑龙江教师资格证中学综合素质真题及答案.doc