Note: The following table appears in the printed Annual Report on the facing page of the
Chairman's Letter and is referred to in that letter.
Berkshire’s Corporate Performance vs. the S&P 500
Annual Percentage Change
in S&P 500
in Per-Share
Book Value of with Dividends
Berkshire
Included
Relative
Results
(1)-(2)
(2)
10.0
(11.7)
30.9
11.0
(8.4)
3.9
14.6
18.9
(14.8)
(26.4)
37.2
23.6
(7.4)
6.4
18.2
32.3
(5.0)
21.4
22.4
6.1
31.6
18.6
5.1
16.6
31.7
(3.1)
30.5
7.6
10.1
1.3
37.6
23.0
33.4
28.6
21.0
(9.1)
(11.9)
(22.1)
28.7
10.9
10.4
5,318
13.8
32.0
(19.9)
8.0
24.6
8.1
1.8
2.8
19.5
31.9
(15.3)
35.7
39.3
17.6
17.5
(13.0)
36.4
18.6
9.9
7.5
16.6
7.5
14.4
3.5
12.7
10.5
9.1
12.7
4.2
12.6
5.5
8.8
.7
19.7
(20.5)
15.6
5.7
32.1
(7.7)
(.4)
11.5
..................................................
..................................................
..................................................
..................................................
..................................................
..................................................
..................................................
..................................................
..................................................
..................................................
..................................................
..................................................
..................................................
..................................................
..................................................
..................................................
..................................................
..................................................
..................................................
..................................................
..................................................
..................................................
..................................................
..................................................
..................................................
..................................................
..................................................
..................................................
..................................................
..................................................
..................................................
..................................................
..................................................
..................................................
..................................................
..................................................
..................................................
..................................................
..................................................
..................................................
Year
1965
1966
1967
1968
1969
1970
1971
1972
1973
1974
1975
1976
1977
1978
1979
1980
1981
1982
1983
1984
1985
1986
1987
1988
1989
1990
1991
1992
1993
1994
1995
1996
1997
1998
1999
2000
2001
2002
2003
2004
Average Annual Gain — 1965-2004
Overall Gain — 1964-2004
(1)
23.8
20.3
11.0
19.0
16.2
12.0
16.4
21.7
4.7
5.5
21.9
59.3
31.9
24.0
35.7
19.3
31.4
40.0
32.3
13.6
48.2
26.1
19.5
20.1
44.4
7.4
39.6
20.3
14.3
13.9
43.1
31.8
34.1
48.3
.5
6.5
(6.2)
10.0
21.0
10.5
21.9
286,865
2
Notes: Data are for calendar years with these exceptions: 1965 and 1966, year ended 9/30; 1967, 15 months ended 12/31.
Starting in 1979, accounting rules required insurance companies to value the equity securities they hold at market
rather than at the lower of cost or market, which was previously the requirement. In this table, Berkshire’s results
through 1978 have been restated to conform to the changed rules. In all other respects, the results are calculated using
the numbers originally reported.
The S&P 500 numbers are pre-tax whereas the Berkshire numbers are after-tax. If a corporation such as Berkshire
were simply to have owned the S&P 500 and accrued the appropriate taxes, its results would have lagged the S&P 500
in years when that index showed a positive return, but would have exceeded the S&P in years when the index showed a
negative return. Over the years, the tax costs would have caused the aggregate lag to be substantial.
�
BERKSHIRE HATHAWAY INC.
To the Shareholders of Berkshire Hathaway Inc.:
Our gain in net worth during 2004 was $8.3 billion, which increased the per-share book value of
both our Class A and Class B stock by 10.5%. Over the last 40 years (that is, since present management
took over) book value has grown from $19 to $55,824, a rate of 21.9% compounded annually.*
It’s per-share intrinsic value that counts, however, not book value. Here, the news is good:
Between 1964 and 2004, Berkshire morphed from a struggling northern textile business whose intrinsic
value was less than book into a diversified enterprise worth far more than book. Our 40-year gain in
intrinsic value has therefore somewhat exceeded our 21.9% gain in book. (For an explanation of intrinsic
value and the economic principles that guide Charlie Munger, my partner and Berkshire’s vice-chairman,
and me in running Berkshire, please read our Owner’s Manual, beginning on page 73.)
Despite their shortcomings, yearly calculations of book value are useful at Berkshire as a slightly
understated gauge for measuring the long-term rate of increase in our intrinsic value. The calculations are
less relevant, however, than they once were in rating any single year’s performance versus the S&P 500
index (a comparison we display on the facing page). Our equity holdings (including convertible preferreds)
have fallen considerably as a percentage of our net worth, from an average of 114% in the 1980s, for
example, to less than 50% in recent years. Therefore, yearly movements in the stock market now affect a
much smaller portion of our net worth than was once the case, a fact that will normally cause us to
underperform in years when stocks rise substantially and overperform in years when they fall.
However the yearly comparisons work out, Berkshire’s long-term performance versus the S&P
remains all-important. Our shareholders can buy the S&P through an index fund at very low cost. Unless
we achieve gains in per-share intrinsic value in the future that outdo the S&P, Charlie and I will be adding
nothing to what you can accomplish on your own.
Last year, Berkshire’s book-value gain of 10.5% fell short of the index’s 10.9% return. Our
lackluster performance was not due to any stumbles by the CEOs of our operating businesses: As always,
they pulled more than their share of the load. My message to them is simple: Run your business as if it
were the only asset your family will own over the next hundred years. Almost invariably they do just that
and, after taking care of the needs of their business, send excess cash to Omaha for me to deploy.
I didn’t do that job very well last year. My hope was to make several multi-billion dollar
acquisitions that would add new and significant streams of earnings to the many we already have. But I
struck out. Additionally, I found very few attractive securities to buy. Berkshire therefore ended the year
with $43 billion of cash equivalents, not a happy position. Charlie and I will work to translate some of this
hoard into more interesting assets during 2005, though we can’t promise success.
In one respect, 2004 was a remarkable year for the stock market, a fact buried in the maze of
numbers on page 2. If you examine the 35 years since the 1960s ended, you will find that an investor’s
return, including dividends, from owning the S&P has averaged 11.2% annually (well above what we
expect future returns to be). But if you look for years with returns anywhere close to that 11.2% – say,
between 8% and 14% – you will find only one before 2004. In other words, last year’s “normal” return is
anything but.
*All figures used in this report apply to Berkshire’s A shares, the successor to the only stock that
the company had outstanding before 1996. The B shares have an economic interest equal to 1/30th that of
the A.
3
�
Over the 35 years, American business has delivered terrific results. It should therefore have been
easy for investors to earn juicy returns: All they had to do was piggyback Corporate America in a
diversified, low-expense way. An index fund that they never touched would have done the job. Instead
many investors have had experiences ranging from mediocre to disastrous.
There have been three primary causes: first, high costs, usually because investors traded
excessively or spent far too much on investment management; second, portfolio decisions based on tips and
fads rather than on thoughtful, quantified evaluation of businesses; and third, a start-and-stop approach to
the market marked by untimely entries (after an advance has been long underway) and exits (after periods
of stagnation or decline). Investors should remember that excitement and expenses are their enemies. And
if they insist on trying to time their participation in equities, they should try to be fearful when others are
greedy and greedy only when others are fearful.
Sector Results
As managers, Charlie and I want to give our owners the financial information and commentary we
would wish to receive if our roles were reversed. To do this with both clarity and reasonable brevity
becomes more difficult as Berkshire’s scope widens. Some of our businesses have vastly different
economic characteristics from others, which means that our consolidated statements, with their jumble of
figures, make useful analysis almost impossible.
On the following pages, therefore, we will present some balance sheet and earnings figures from
our four major categories of businesses along with commentary about each. We particularly want you to
understand the limited circumstances under which we will use debt, given that we typically shun it. We
will not, however, inundate you with data that has no real value in estimating Berkshire’s intrinsic value.
Doing so would tend to obfuscate the facts that count.
Regulated Utility Businesses
We have an 80.5% (fully diluted) interest in MidAmerican Energy Holdings, which owns a wide
variety of utility operations. The largest of these are (1) Yorkshire Electricity and Northern Electric, whose
3.7 million electric customers make it the third largest distributor of electricity in the U.K.; (2)
MidAmerican Energy, which serves 698,000 electric customers, primarily in Iowa; and (3) Kern River and
Northern Natural pipelines, which carry 7.9% of the natural gas consumed in the U.S.
The remaining 19.5% of MidAmerican is owned by three partners of ours: Dave Sokol and Greg
Abel, the brilliant managers of these businesses, and Walter Scott, a long-time friend of mine who
introduced me to the company. Because MidAmerican is subject to the Public Utility Holding Company
Act (“PUHCA”), Berkshire’s voting interest is limited to 9.9%. Voting control rests with Walter.
Our limited voting interest forces us to account for MidAmerican in an abbreviated manner.
Instead of our fully incorporating the company’s assets, liabilities, revenues and expenses into Berkshire’s
statements, we make one-line entries only in both our balance sheet and income account. It’s likely,
though, that PUHCA will someday – perhaps soon – be repealed or that accounting rules will change.
Berkshire’s consolidated figures would then incorporate all of MidAmerican, including the substantial debt
it utilizes (though this debt is not now, nor will it ever be, an obligation of Berkshire).
At yearend, $1.478 billion of MidAmerican’s junior debt was payable to Berkshire. This debt has
allowed acquisitions to be financed without our partners needing to increase their already substantial
investments in MidAmerican. By charging 11% interest, Berkshire is compensated fairly for putting up the
funds needed for purchases, while our partners are spared dilution of their equity interests. Because
MidAmerican made no large acquisitions last year, it paid down $100 million of what it owes us.
4
�
MidAmerican also owns a significant non-utility business, HomeServices of America, the second
largest real estate broker in the country. Unlike our utility operations, this business is highly cyclical, but
nevertheless one we view enthusiastically. We have an exceptional manager, Ron Peltier, who through
both his acquisition and operational skills is building a brokerage powerhouse.
HomeServices participated in $59.8 billion of transactions in 2004, a gain of $11.2 billion from
2003. About 24% of the increase came from six acquisitions made during the year. Through our 17
brokerage firms – all of which retain their local identities – we employ more than 18,000 brokers in 18
states. HomeServices is almost certain to grow substantially in the next decade as we continue to acquire
leading localized operations.
Last year MidAmerican wrote off a major investment in a zinc recovery project that was initiated
in 1998 and became operational in 2002. Large quantities of zinc are present in the brine produced by our
California geothermal operations, and we believed we could profitably extract the metal. For many
months, it appeared that commercially-viable recoveries were imminent. But in mining, just as in oil
exploration, prospects have a way of “teasing” their developers, and every time one problem was solved,
another popped up. In September, we threw in the towel.
Our failure here illustrates the importance of a guideline – stay with simple propositions – that we
usually apply in investments as well as operations. If only one variable is key to a decision, and the
variable has a 90% chance of going your way, the chance for a successful outcome is obviously 90%. But
if ten independent variables need to break favorably for a successful result, and each has a 90% probability
of success, the likelihood of having a winner is only 35%. In our zinc venture, we solved most of the
problems. But one proved intractable, and that was one too many. Since a chain is no stronger than its
weakest link, it makes sense to look for – if you’ll excuse an oxymoron – mono-linked chains.
A breakdown of MidAmerican’s results follows. In 2004, the “other” category includes a $72.2
million profit from sale of an Enron receivable that was thrown in when we purchased Northern Natural
two years earlier. Walter, Dave and I, as natives of Omaha, view this unanticipated gain as war reparations
– partial compensation for the loss our city suffered in 1986 when Ken Lay moved Northern to Houston,
after promising to leave the company here. (For details, see Berkshire’s 2002 annual report.)
Here are some key figures on MidAmerican’s operations:
Earnings (in $ millions)
U.K. utilities .......................................................................................................
Iowa utility .........................................................................................................
Pipelines .............................................................................................................
HomeServices.....................................................................................................
Other (net) ..........................................................................................................
Loss from zinc project........................................................................................
Earnings before corporate interest and taxes......................................................
Interest, other than to Berkshire .........................................................................
Interest on Berkshire junior debt ........................................................................
Income tax ..........................................................................................................
Net earnings........................................................................................................
Earnings applicable to Berkshire*......................................................................
Debt owed to others............................................................................................
Debt owed to Berkshire......................................................................................
*Includes interest earned by Berkshire (net of related income taxes) of $110 in 2004 and $118 in 2003.
2004
$ 326
268
288
130
172
(579)
605
(212)
(170)
(53)
$ 170
$ 237
10,528
1,478
2003
$ 289
269
261
113
190
(46)
1,076
(225)
(184)
(251)
$ 416
$ 429
10,296
1,578
5
�
Insurance
Since Berkshire purchased National Indemnity (“NICO”) in 1967, property-casualty insurance has
been our core business and the propellant of our growth. Insurance has provided a fountain of funds with
which we’ve acquired the securities and businesses that now give us an ever-widening variety of earnings
streams. So in this section, I will be spending a little time telling you how we got where we are.
The source of our insurance funds is “float,” which is money that doesn’t belong to us but that we
temporarily hold. Most of our float arises because (1) premiums are paid upfront though the service we
provide – insurance protection – is delivered over a period that usually covers a year and; (2) loss events
that occur today do not always result in our immediately paying claims, because it sometimes takes many
years for losses to be reported (asbestos losses would be an example), negotiated and settled. The $20
million of float that came with our 1967 purchase has now increased – both by way of internal growth and
acquisitions – to $46.1 billion.
Float is wonderful – if it doesn’t come at a high price. Its cost is determined by underwriting
results, meaning how the expenses and losses we will ultimately pay compare with the premiums we have
received. When an underwriting profit is achieved – as has been the case at Berkshire in about half of the
38 years we have been in the insurance business – float is better than free. In such years, we are actually
paid for holding other people’s money. For most insurers, however, life has been far more difficult: In
aggregate, the property-casualty industry almost invariably operates at an underwriting loss. When that
loss is large, float becomes expensive, sometimes devastatingly so.
Insurers have generally earned poor returns for a simple reason: They sell a commodity-like
product. Policy forms are standard, and the product is available from many suppliers, some of whom are
mutual companies (“owned” by policyholders rather than stockholders) with profit goals that are limited.
Moreover, most insureds don’t care from whom they buy. Customers by the millions say “I need some
Gillette blades” or “I’ll have a Coke” but we wait in vain for “I’d like a National Indemnity policy, please.”
Consequently, price competition in insurance is usually fierce. Think airline seats.
So, you may ask, how do Berkshire’s insurance operations overcome the dismal economics of the
industry and achieve some measure of enduring competitive advantage? We’ve attacked that problem in
several ways. Let’s look first at NICO’s strategy.
When we purchased the company – a specialist in commercial auto and general liability insurance
– it did not appear to have any attributes that would overcome the industry’s chronic troubles. It was not
well-known, had no informational advantage (the company has never had an actuary), was not a low-cost
operator, and sold through general agents, a method many people thought outdated. Nevertheless, for
almost all of the past 38 years, NICO has been a star performer. Indeed, had we not made this acquisition,
Berkshire would be lucky to be worth half of what it is today.
What we’ve had going for us is a managerial mindset that most insurers find impossible to
replicate. Take a look at the facing page. Can you imagine any public company embracing a business
model that would lead to the decline in revenue that we experienced from 1986 through 1999? That
colossal slide, it should be emphasized, did not occur because business was unobtainable. Many billions of
premium dollars were readily available to NICO had we only been willing to cut prices. But we instead
consistently priced to make a profit, not to match our most optimistic competitor. We never left customers
– but they left us.
Most American businesses harbor an “institutional imperative” that rejects extended decreases in
volume. What CEO wants to report to his shareholders that not only did business contract last year but that
it will continue to drop? In insurance, the urge to keep writing business is also intensified because the
consequences of foolishly-priced policies may not become apparent for some time. If an insurer is
optimistic in its reserving, reported earnings will be overstated, and years may pass before true loss costs
are revealed (a form of self-deception that nearly destroyed GEICO in the early 1970s).
6
�
Portrait of a Disciplined Underwriter
National Indemnity Company
Year
Written Premium
(In $ millions)
No. of
Employees at
Year-End
to
Ratio of
Operating Expenses
Written Premium
Underwriting Profit
(Loss) as a Per-
centage of Premiums
(Calculated as of
year end 2004)*
$79.6
59.9
52.5
58.2
62.2
160.7
366.2
232.3
139.9
98.4
87.8
88.3
82.7
86.8
85.9
78.0
74.0
65.3
56.8
54.5
68.1
161.3
343.5
594.5
605.6
...........................
...........................
...........................
...........................
...........................
...........................
...........................
...........................
...........................
...........................
...........................
...........................
...........................
...........................
...........................
...........................
...........................
...........................
...........................
...........................
...........................
...........................
...........................
...........................
...........................
1980
1981
1982
1983
1984
1985
1986
1987
1988
1989
1990
1991
1992
1993
1994
1995
1996
1997
1998
1999
2000
2001
2002
2003
2004
*It takes a long time to learn the true profitability of any given year. First, many claims are received after
the end of the year, and we must estimate how many of these there will be and what they will cost. (In
insurance jargon, these claims are termed IBNR – incurred but not reported.) Second, claims often take
years, or even decades, to settle, which means there can be many surprises along the way.
For these reasons, the results in this column simply represent our best estimate at the end of 2004 as to how
we have done in prior years. Profit margins for the years through 1999 are probably close to correct
because these years are “mature,” in the sense that they have few claims still outstanding. The more recent
the year, the more guesswork is involved. In particular, the results shown for 2003 and 2004 are apt to
change significantly.
7
372
353
323
308
342
380
403
368
347
320
289
284
277
279
263
258
243
240
231
222
230
254
313
337
340
32.3%
36.1%
36.7%
35.6%
35.5%
28.0%
25.9%
29.5%
31.7%
35.9%
37.4%
35.7%
37.9%
36.1%
34.6%
36.6%
36.5%
40.4%
40.4%
41.2%
38.4%
28.8%
24.0%
22.2%
22.5%
8.2%
(.8%)
(15.3%)
(18.7%)
(17.0%)
1.9%
30.7%
27.3%
24.8%
14.8%
7.0%
13.0%
5.2%
11.3%
4.6%
9.2%
6.8%
6.2%
9.4%
4.5%
2.9%
(11.6%)
16.8%
18.1%
5.1%
�
Finally, there is a fear factor at work, in that a shrinking business usually leads to layoffs. To
avoid pink slips, employees will rationalize inadequate pricing, telling themselves that poorly-priced
business must be tolerated in order to keep the organization intact and the distribution system happy. If this
course isn’t followed, these employees will argue, the company will not participate in the recovery that
they invariably feel is just around the corner.
To combat employees’ natural tendency to save their own skins, we have always promised
NICO’s workforce that no one will be fired because of declining volume, however severe the contraction.
(This is not Donald Trump’s sort of place.) NICO is not labor-intensive, and, as the table suggests, can live
with excess overhead. It can’t live, however, with underpriced business and the breakdown in underwriting
discipline that accompanies it. An insurance organization that doesn’t care deeply about underwriting at a
profit this year is unlikely to care next year either.
Naturally, a business that follows a no-layoff policy must be especially careful to avoid
overstaffing when times are good. Thirty years ago Tom Murphy, then CEO of Cap Cities, drove this point
home to me with a hypothetical tale about an employee who asked his boss for permission to hire an
assistant. The employee assumed that adding $20,000 to the annual payroll would be inconsequential. But
his boss told him the proposal should be evaluated as a $3 million decision, given that an additional person
would probably cost at least that amount over his lifetime, factoring in raises, benefits and other expenses
(more people, more toilet paper). And unless the company fell on very hard times, the employee added
would be unlikely to be dismissed, however marginal his contribution to the business.
It takes real fortitude – embedded deep within a company’s culture – to operate as NICO does.
Anyone examining the table can scan the years from 1986 to 1999 quickly. But living day after day with
dwindling volume – while competitors are boasting of growth and reaping Wall Street’s applause – is an
experience few managers can tolerate. NICO, however, has had four CEOs since its formation in 1940 and
none have bent. (It should be noted that only one of the four graduated from college. Our experience tells
us that extraordinary business ability is largely innate.)
The current managerial star – make that superstar – at NICO is Don Wurster (yes, he’s “the
graduate”), who has been running things since 1989. His slugging percentage is right up there with Barry
Bonds’ because, like Barry, Don will accept a walk rather than swing at a bad pitch. Don has now amassed
$950 million of float at NICO that over time is almost certain to be proved the negative-cost kind. Because
insurance prices are falling, Don’s volume will soon decline very significantly and, as it does, Charlie and I
will applaud him ever more loudly.
* * * * * * * * * * * *
Another way to prosper in a commodity-type business is to be the low-cost operator. Among auto
insurers operating on a broad scale, GEICO holds that cherished title. For NICO, as we have seen, an ebb-
and-flow business model makes sense. But a company holding a low-cost advantage must pursue an
unrelenting foot-to-the-floor strategy. And that’s just what we do at GEICO.
A century ago, when autos first appeared, the property-casualty industry operated as a cartel. The
major companies, most of which were based in the Northeast, established “bureau” rates and that was it.
No one cut prices to attract business. Instead, insurers competed for strong, well-regarded agents, a focus
that produced high commissions for agents and high prices for consumers.
In 1922, State Farm was formed by George Mecherle, a farmer from Merna, Illinois, who aimed to
take advantage of the pricing umbrella maintained by the high-cost giants of the industry. State Farm
employed a “captive” agency force, a system keeping its acquisition costs lower than those incurred by the
bureau insurers (whose “independent” agents successfully played off one company against another). With
its low-cost structure, State Farm eventually captured about 25% of the personal lines (auto and
homeowners) business, far outdistancing its once-mighty competitors. Allstate, formed in 1931, put a
similar distribution system into place and soon became the runner-up in personal lines to State Farm.
Capitalism had worked its magic, and these low-cost operations looked unstoppable.
8
�
But a man named Leo Goodwin had an idea for an even more efficient auto insurer and, with a
skimpy $200,000, started GEICO in 1936. Goodwin’s plan was to eliminate the agent entirely and to deal
instead directly with the auto owner. Why, he asked himself, should there be any unnecessary and
expensive links in the distribution mechanism when the product, auto insurance, was both mandatory and
costly. Purchasers of business insurance, he reasoned, might well require professional advice, but most
consumers knew what they needed in an auto policy. That was a powerful insight.
Originally, GEICO mailed its low-cost message to a limited audience of government employees.
Later, it widened its horizons and shifted its marketing emphasis to the phone, working inquiries that came
from broadcast and print advertising. And today the Internet is coming on strong.
Between 1936 and 1975, GEICO grew from a standing start to a 4% market share, becoming the
country’s fourth largest auto insurer. During most of this period, the company was superbly managed,
achieving both excellent volume gains and high profits. It looked unstoppable. But after my friend and
hero Lorimer Davidson retired as CEO in 1970, his successors soon made a huge mistake by under-
reserving for losses. This produced faulty cost information, which in turn produced inadequate pricing. By
1976, GEICO was on the brink of failure.
Jack Byrne then joined GEICO as CEO and, almost single-handedly, saved the company by heroic
efforts that included major price increases. Though GEICO’s survival required these, policyholders fled
the company, and by 1980 its market share had fallen to 1.8%. Subsequently, the company embarked on
some unwise diversification moves. This shift of emphasis away from its extraordinary core business
stunted GEICO’s growth, and by 1993 its market share had grown only fractionally, to 1.9%. Then Tony
Nicely took charge.
And what a difference that’s made: In 2005 GEICO will probably secure a 6% market share.
Better yet, Tony has matched growth with profitability. Indeed, GEICO delivers all of its constituents
major benefits: In 2004 its customers saved $1 billion or so compared to what they would otherwise have
paid for coverage, its associates earned a $191 million profit-sharing bonus that averaged 24.3% of salary,
and its owner – that’s us – enjoyed excellent financial returns.
There’s more good news. When Jack Byrne was rescuing the company in 1976, New Jersey
refused to grant him the rates he needed to operate profitably. He therefore promptly – and properly –
withdrew from the state. Subsequently, GEICO avoided both New Jersey and Massachusetts, recognizing
them as two jurisdictions in which insurers were destined to struggle.
In 2003, however, New Jersey took a new look at its chronic auto-insurance problems and enacted
legislation that would curb fraud and allow insurers a fair playing field. Even so, one might have expected
the state’s bureaucracy to make change slow and difficult.
But just the opposite occurred. Holly Bakke, the New Jersey insurance commissioner, who would
be a success in any line of work, was determined to turn the law’s intent into reality. With her staff’s
cooperation, GEICO ironed out the details for re-entering the state and was licensed last August. Since
then, we’ve received a response from New Jersey drivers that is multiples of my expectations.
We are now serving 140,000 policyholders – about 4% of the New Jersey market – and saving
them substantial sums (as we do drivers everywhere). Word-of-mouth recommendations within the state
are causing inquiries to pour in. And once we hear from a New Jersey prospect, our closure rate – the
percentage of policies issued to inquiries received – is far higher in the state than it is nationally.
We make no claim, of course, that we can save everyone money. Some companies, using rating
systems that are different from ours, will offer certain classes of drivers a lower rate than we do. But we
believe GEICO offers the lowest price more often than any other national company that serves all segments
of the public. In addition, in most states, including New Jersey, Berkshire shareholders receive an 8%
discount. So gamble fifteen minutes of your time and go to GEICO.com – or call 800-847-7536 – to see
9
�


 2025年软考高级信息系统项目管理师金色考点
 软考高项三色笔记
 镇安县双鑫矿业月河年处理15万吨尾渣综合加工利用项目水土保持报告表
  红杉资本:生成式AI最新市场格局.pdf
 wireshark 使用教程.pdf
 【2021年-贝佐斯致股东的信】.pdf
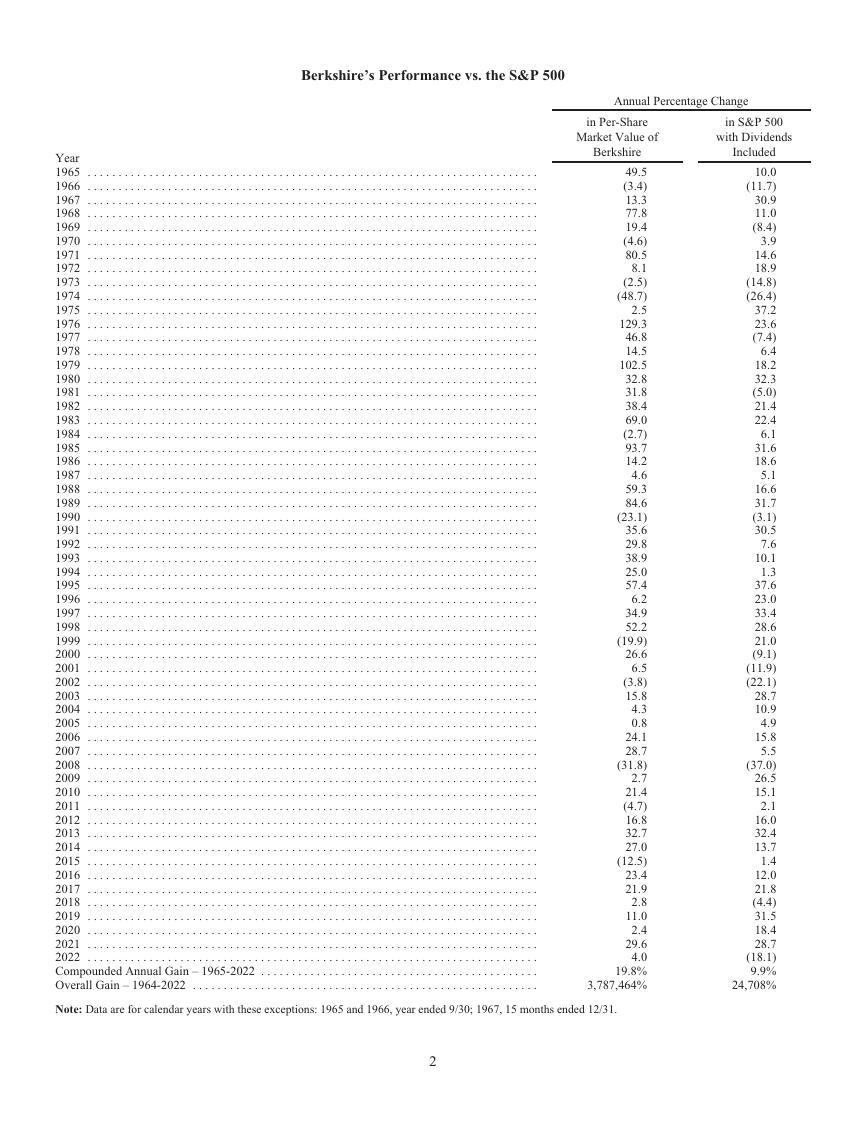 巴菲特致股东的公开信 - 2022.pdf
 MySQL 8.1 参考手册.pdf
 世界银行报告下载:激进政策缩紧浪潮不足遏制通胀 全球经济衰退迫在眉睫(Is a Global Recession Imminent?).pdf
 红杉资本报告:适应与忍耐(Adapting to Endure).pdf
 高保真音响系统设计制作-毕业论文.doc
 一种自适应互补滤波姿态估计算法.pdf