MLX90393
Micropower Triaxis® Magnetometer Datasheet
Part No.
MLX90393
Temperature Code
S (-20°C to 85°C)
Package Code
LW (QFN16 3x3mm)
1. Scope
Silicon Version Option Code Packing Format
ABA
011
RE (Reel)
This document holds the specification of a 3-axis magnetometer targeting low-power applications. The IC is
based on the Hall-effect and the patented Triaxis® technology from Melexis. The output signals (raw X, Y, Z
Magnetic data and Temperature data) will be provided through the I2C fast mode protocol, or via half-
duplex SPI (3- or 4-wire). There is an on-board non-volatile memory to store calibration data on-chip.
BIAS
Triais™
Temp
Sensor
16b
ADC
VX
VY
VZ
M
U
X
IA
C
2
I
/
I
P
S
l
o
r
t
n
o
C
e
c
a
f
r
e
t
n
I
LP OSC
Wake-up
OSC
EEPROM
Figure 1: High-level Block Diagram
VDD
VSS
3901090393
Rev002
Page 1
Data Sheet
Feb-2015
�
MLX90393
Micropower Triaxis® Magnetometer Datasheet
2. Absolute Maximum Ratings
The MLX90393 can withstand the conditions described in the table below for short periods of time; they do
not constitute conditions for normal operation.
Parameter
VDD_MAX
Remark
Analog Supply Voltage Limits
VDD_IO_MAX
Digital IO Supply Limits
TSTORAGE
ESDHBM
ESDCDM
Storage (idle) temperature range
According to AEC-Q100-002
According to AEC-Q100-011-B (QFN)
Min
-0.3
-0.3
-50
2.5
750
Nom
Max
4
min(4, VDD+0.3)
125
Unit
V
V
°C
kV
V
3. Thermal Specification
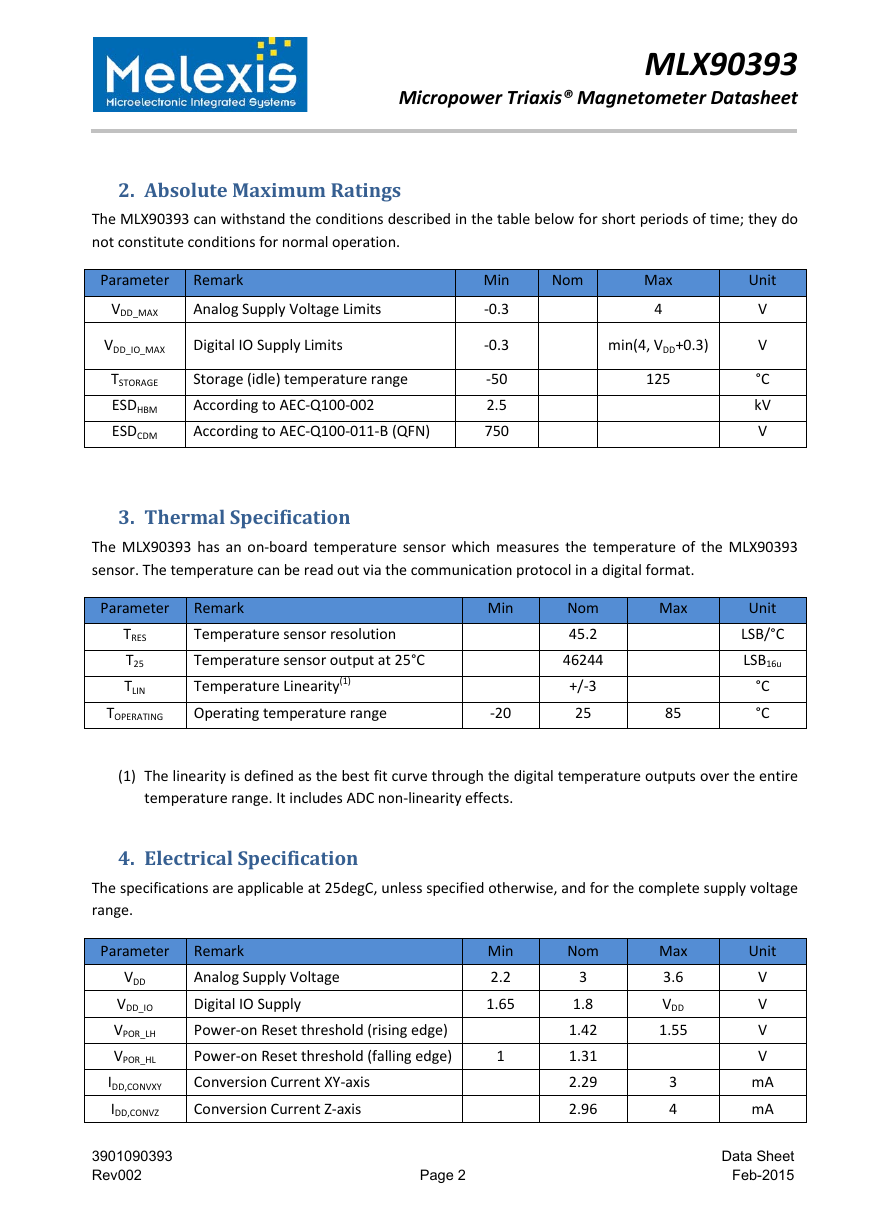
The MLX90393 has an on-board temperature sensor which measures the temperature of the MLX90393
sensor. The temperature can be read out via the communication protocol in a digital format.
Parameter
TRES
T25
TLIN
TOPERATING
Remark
Temperature sensor resolution
Temperature sensor output at 25°C
Temperature Linearity(1)
Operating temperature range
Min
-20
Nom
45.2
46244
+/-3
25
Max
85
Unit
LSB/°C
LSB16u
°C
°C
(1) The linearity is defined as the best fit curve through the digital temperature outputs over the entire
temperature range. It includes ADC non-linearity effects.
4. Electrical Specification
The specifications are applicable at 25degC, unless specified otherwise, and for the complete supply voltage
range.
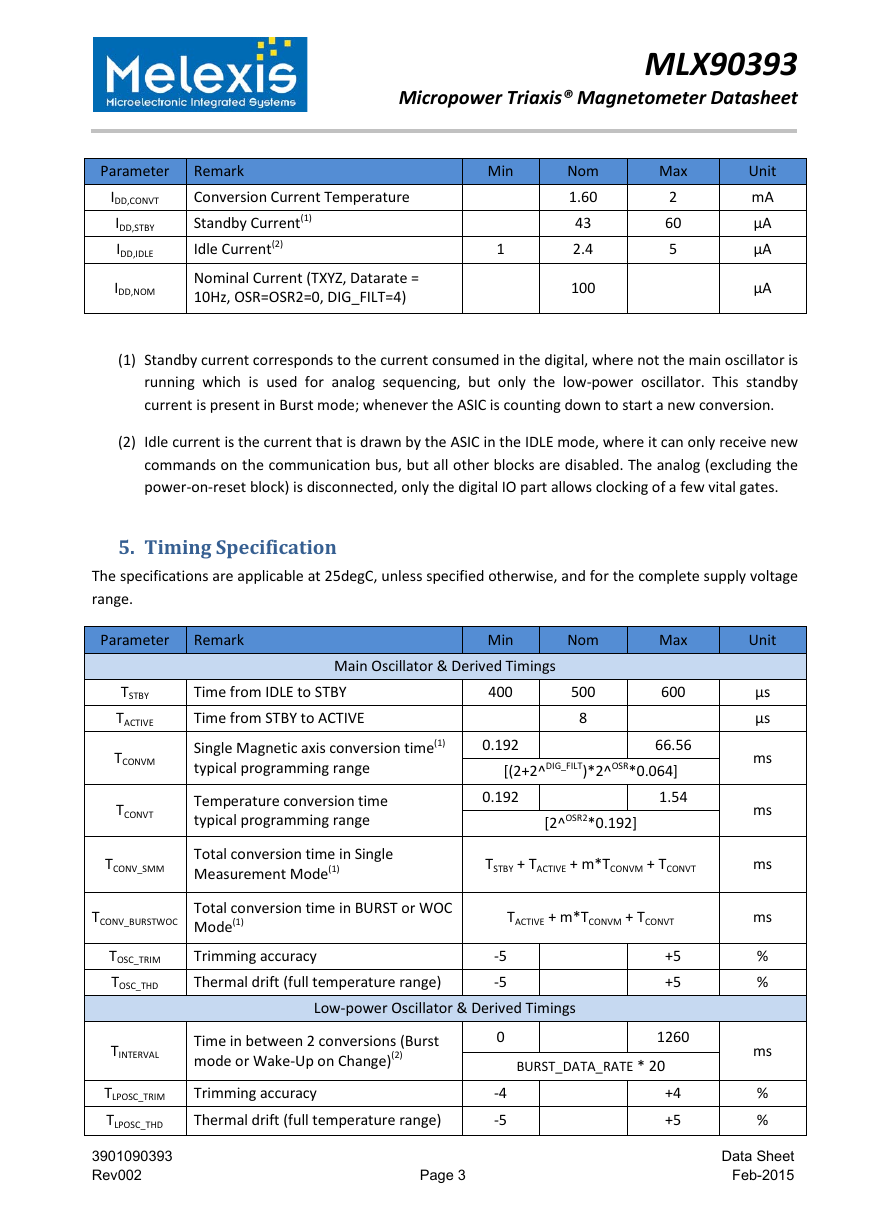
Parameter
VDD
VDD_IO
VPOR_LH
VPOR_HL
IDD,CONVXY
IDD,CONVZ
Remark
Analog Supply Voltage
Digital IO Supply
Power-on Reset threshold (rising edge)
Power-on Reset threshold (falling edge)
Conversion Current XY-axis
Conversion Current Z-axis
Min
2.2
1.65
1
Nom
3
1.8
1.42
1.31
2.29
2.96
Max
3.6
VDD
1.55
3
4
Unit
V
V
V
V
mA
mA
3901090393
Rev002
Page 2
Data Sheet
Feb-2015
�
MLX90393
Micropower Triaxis® Magnetometer Datasheet
Parameter
IDD,CONVT
IDD,STBY
IDD,IDLE
IDD,NOM
Remark
Conversion Current Temperature
Standby Current(1)
Idle Current(2)
Nominal Current (TXYZ, Datarate =
10Hz, OSR=OSR2=0, DIG_FILT=4)
Min
1
Nom
1.60
43
2.4
100
Max
2
60
5
Unit
mA
µA
µA
µA
(1) Standby current corresponds to the current consumed in the digital, where not the main oscillator is
running which is used for analog sequencing, but only the low-power oscillator. This standby
current is present in Burst mode; whenever the ASIC is counting down to start a new conversion.
(2) Idle current is the current that is drawn by the ASIC in the IDLE mode, where it can only receive new
commands on the communication bus, but all other blocks are disabled. The analog (excluding the
power-on-reset block) is disconnected, only the digital IO part allows clocking of a few vital gates.
5. Timing Specification
The specifications are applicable at 25degC, unless specified otherwise, and for the complete supply voltage
range.
Parameter
Remark
Min
Nom
Max
Unit
Main Oscillator & Derived Timings
TSTBY
TACTIVE
TCONVM
TCONVT
Time from IDLE to STBY
Time from STBY to ACTIVE
Single Magnetic axis conversion time(1)
typical programming range
Temperature conversion time
typical programming range
TCONV_SMM
Total conversion time in Single
Measurement Mode(1)
TCONV_BURSTWOC Total conversion time in BURST or WOC
Mode(1)
Trimming accuracy
Thermal drift (full temperature range)
TOSC_TRIM
TOSC_THD
400
0.192
500
8
600
66.56
[(2+2^DIG_FILT)*2^OSR*0.064]
1.54
0.192
[2^OSR2*0.192]
TSTBY + TACTIVE + m*TCONVM + TCONVT
TACTIVE + m*TCONVM + TCONVT
-5
-5
+5
+5
1260
µs
µs
ms
ms
ms
ms
%
%
ms
%
%
Low-power Oscillator & Derived Timings
TINTERVAL
Time in between 2 conversions (Burst
mode or Wake-Up on Change)(2)
TLPOSC_TRIM
TLPOSC_THD
Trimming accuracy
Thermal drift (full temperature range)
0
-4
-5
BURST_DATA_RATE * 20
+4
+5
3901090393
Rev002
Page 3
Data Sheet
Feb-2015
�
MLX90393
Micropower Triaxis® Magnetometer Datasheet
Parameter
Remark
Min
Nom
Max
Unit
Startup
TPOR
Power-on-reset completion time
External Trigger
TTRIG
Trigger pulse width (active high)
0.01
0.6
1.5
250
ms
us
(1) This conversion time is defined as the time to acquire a single axis of the magnetic flux density.
When measuring multiple axes, they are obtained through time-multiplexing, i.e. X(t), Y(t+TCONVM)
and Z(t+2*TCONVM). The conversion time is programmable through parameters OSR and DIG_FILT for
magnetic conversion time and OSR2 for temperature conversion time. The conversion sequence is
always TXYZ, the opposite of the ZYXT argument of the command set.
(2) The time TINTERVAL is defined as the time between the end of one set of measurements (any
combination of TXYZ) and the start of the following same set of measurements in BURST and WOC
mode. As a result of this, the maximum output data rate is not only a function of TINTERVAL but equals
1/(TCONV_BURSTWOC + TINTERVAL).
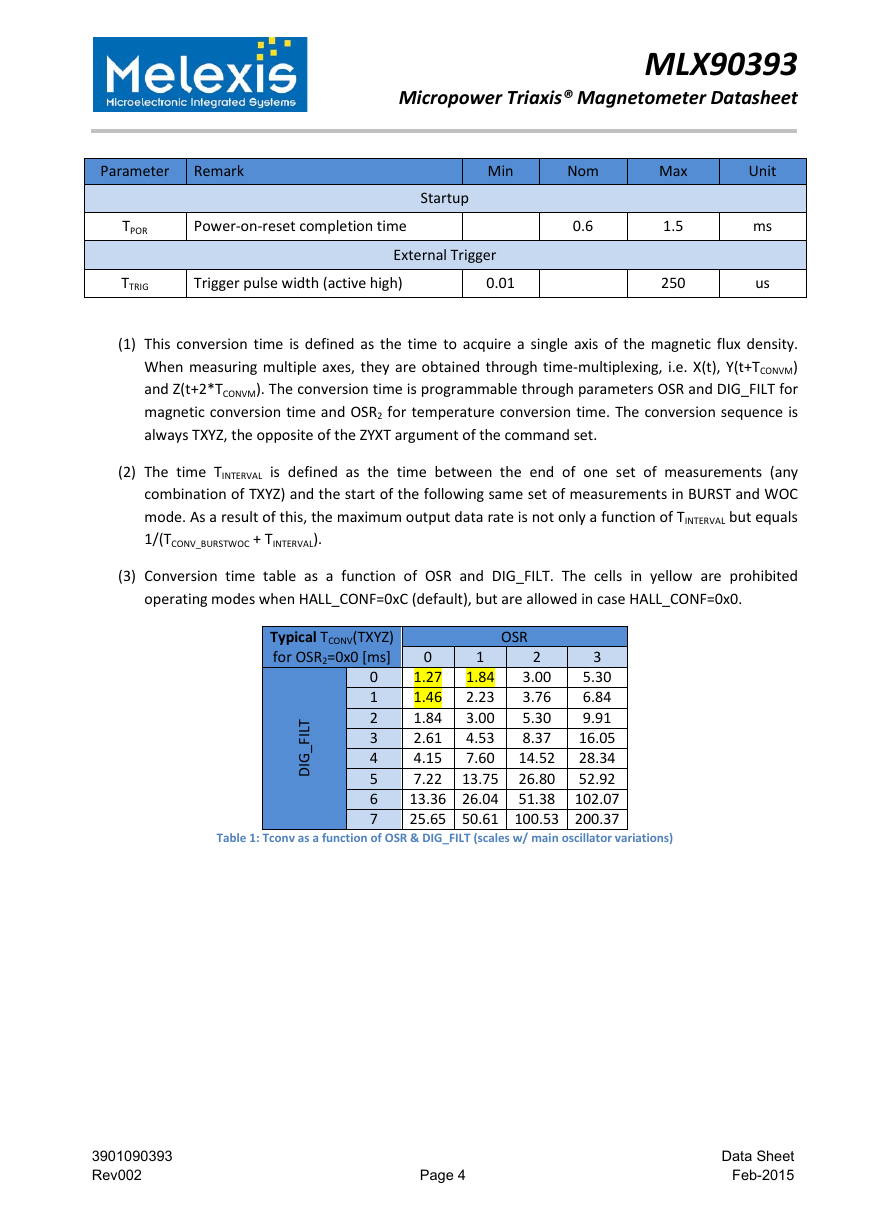
(3) Conversion time table as a function of OSR and DIG_FILT. The cells in yellow are prohibited
operating modes when HALL_CONF=0xC (default), but are allowed in case HALL_CONF=0x0.
OSR
1
1.84
2.23
3.00
4.53
7.60
2
0
3
3.00
1.27
5.30
3.76
1.46
6.84
5.30
1.84
9.91
8.37
2.61
16.05
4.15
14.52
28.34
7.22 13.75 26.80
52.92
13.36 26.04 51.38 102.07
25.65 50.61 100.53 200.37
0
1
2
3
4
5
6
7
Table 1: Tconv as a function of OSR & DIG_FILT (scales w/ main oscillator variations)
Typical TCONV(TXYZ)
for OSR2=0x0 [ms]
T
L
I
F
_
G
D
I
3901090393
Rev002
Page 4
Data Sheet
Feb-2015
�
MLX90393
Micropower Triaxis® Magnetometer Datasheet
0
1
2
3
4
5
6
7
T
L
I
F
_
G
D
I
Maximum ODR
for OSR2=0x0 [Hz]
OSR
0
1
2
3
716.9 493.0 303.4 171.5
622.7 408.0 241.5 133.0
493.0 303.4 171.5 91.8
348.0 200.6 108.6 56.6
219.2 119.6 62.6
32.1
17.2
33.9
125.9 66.1
8.9
17.7
34.9
68.0
35.4
18.0
9.0
4.5
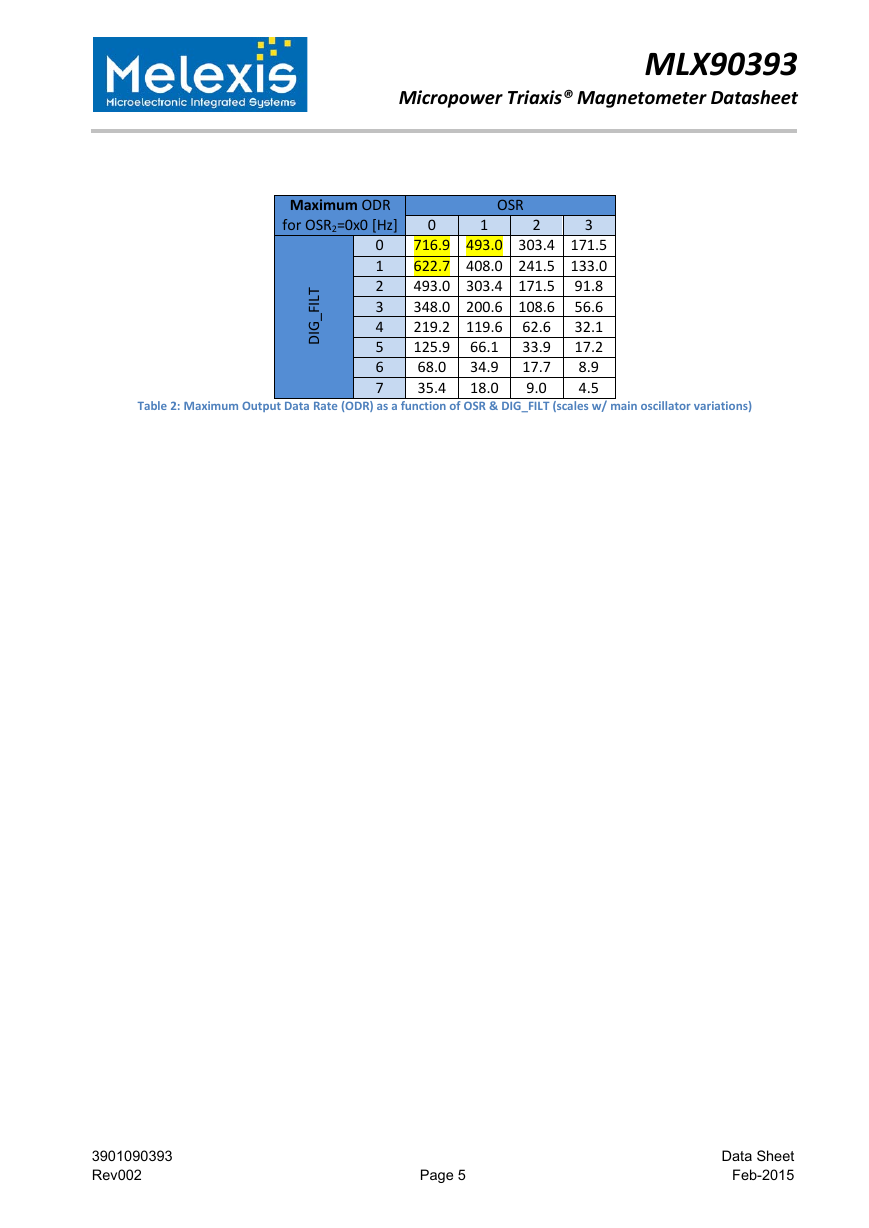
Table 2: Maximum Output Data Rate (ODR) as a function of OSR & DIG_FILT (scales w/ main oscillator variations)
3901090393
Rev002
Page 5
Data Sheet
Feb-2015
�
MLX90393
Micropower Triaxis® Magnetometer Datasheet
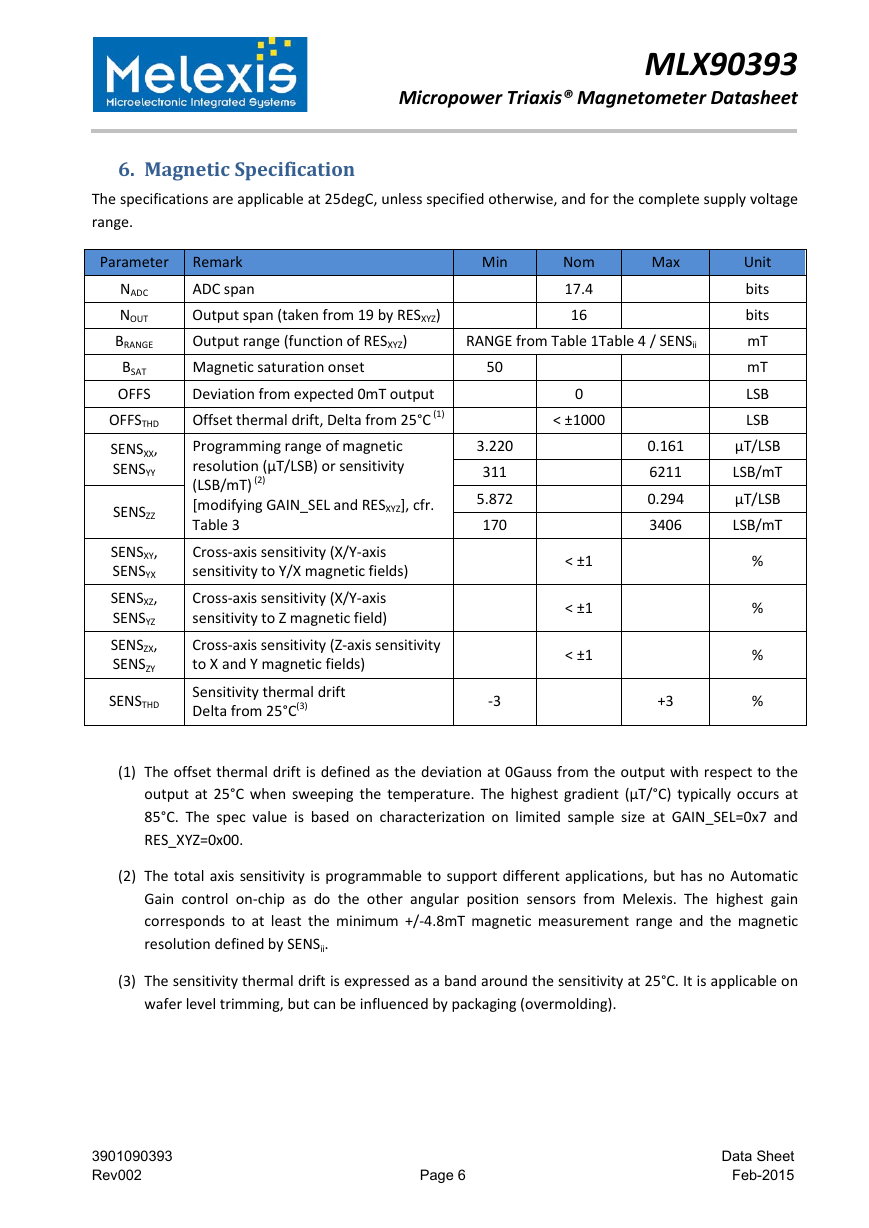
6. Magnetic Specification
The specifications are applicable at 25degC, unless specified otherwise, and for the complete supply voltage
range.
Parameter
NADC
NOUT
BRANGE
BSAT
OFFS
OFFSTHD
SENSXX,
SENSYY
SENSZZ
SENSXY,
SENSYX
SENSXZ,
SENSYZ
SENSZX,
SENSZY
SENSTHD
Remark
ADC span
Output span (taken from 19 by RESXYZ)
Output range (function of RESXYZ)
Magnetic saturation onset
Deviation from expected 0mT output
Offset thermal drift, Delta from 25°C (1)
Programming range of magnetic
resolution (µT/LSB) or sensitivity
(LSB/mT) (2)
[modifying GAIN_SEL and RESXYZ], cfr.
Table 3
Cross-axis sensitivity (X/Y-axis
sensitivity to Y/X magnetic fields)
Cross-axis sensitivity (X/Y-axis
sensitivity to Z magnetic field)
Cross-axis sensitivity (Z-axis sensitivity
to X and Y magnetic fields)
Sensitivity thermal drift
Delta from 25°C(3)
Min
Nom
17.4
16
Max
RANGE from Table 1Table 4 / SENSii
50
3.220
311
5.872
170
-3
0
< ±1000
< ±1
< ±1
< ±1
0.161
6211
0.294
3406
+3
Unit
bits
bits
mT
mT
LSB
LSB
µT/LSB
LSB/mT
µT/LSB
LSB/mT
%
%
%
%
(1) The offset thermal drift is defined as the deviation at 0Gauss from the output with respect to the
output at 25°C when sweeping the temperature. The highest gradient (µT/°C) typically occurs at
85°C. The spec value is based on characterization on limited sample size at GAIN_SEL=0x7 and
RES_XYZ=0x00.
(2) The total axis sensitivity is programmable to support different applications, but has no Automatic
Gain control on-chip as do the other angular position sensors from Melexis. The highest gain
corresponds to at least the minimum +/-4.8mT magnetic measurement range and the magnetic
resolution defined by SENSii.
(3) The sensitivity thermal drift is expressed as a band around the sensitivity at 25°C. It is applicable on
wafer level trimming, but can be influenced by packaging (overmolding).
3901090393
Rev002
Page 6
Data Sheet
Feb-2015
�
MLX90393
Micropower Triaxis® Magnetometer Datasheet
RES = 0
RES = 1
RES = 2
RES = 3
SENSXY
0.805
0.644
0.483
0.403
0.322
0.268
0.215
0.161
SENSZ
1.468
1.174
0.881
0.734
0.587
0.489
0.391
0.294
SENSXY
1.610
1.288
0.966
0.805
0.644
0.537
0.429
0.322
SENSZ
2.936
2.349
1.762
1.468
1.174
0.979
0.783
0.587
SENSXY
3.220
2.576
1.932
1.610
1.288
1.073
0.859
0.644
SENSZ
5.872
4.698
3.523
2.936
2.349
1.957
1.566
1.174
SENSXY
6.440
5.152
3.864
3.220
2.576
2.147
1.717
1.288
SENSZ
11.744
9.395
7.046
5.872
4.698
3.915
3.132
2.349
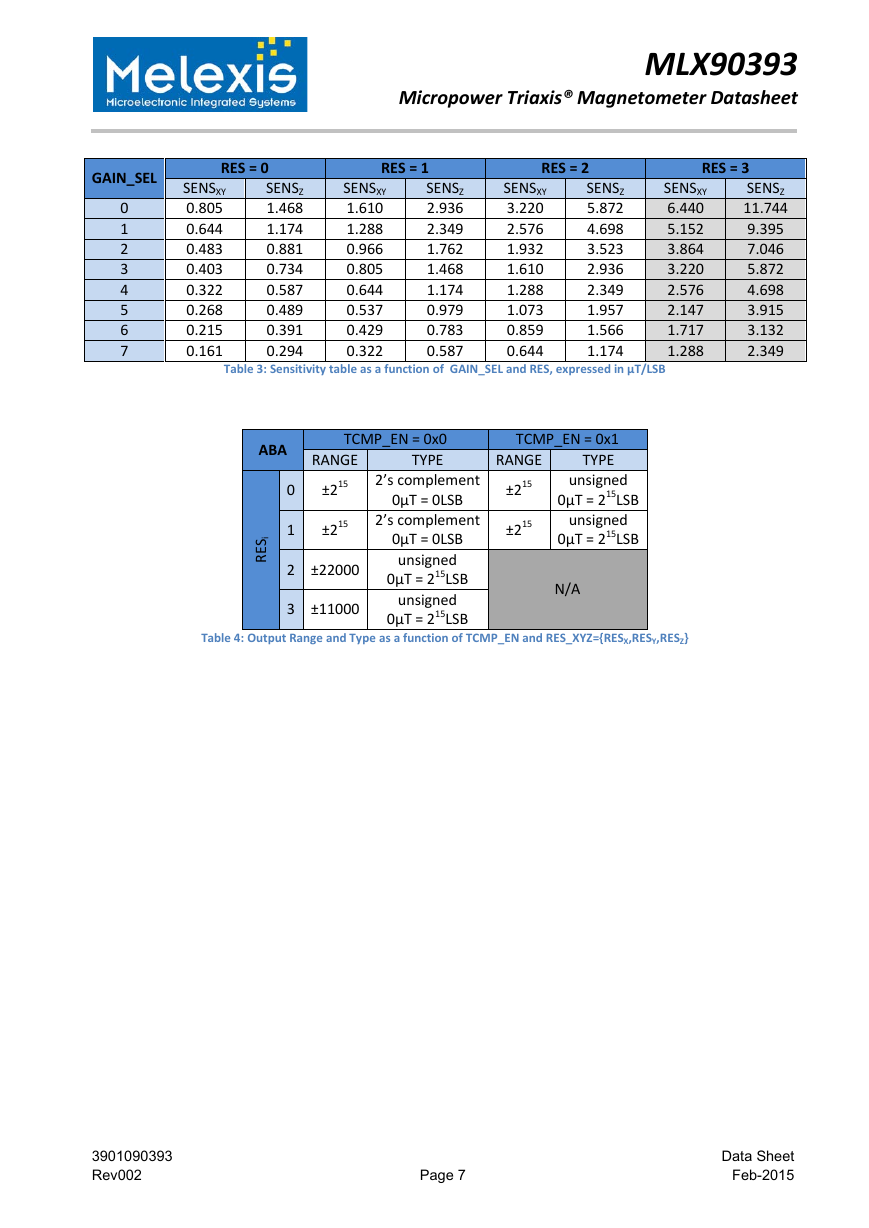
Table 3: Sensitivity table as a function of GAIN_SEL and RES, expressed in µT/LSB
ABA
TCMP_EN = 0x0
TYPE
TCMP_EN = 0x1
TYPE
RANGE
±215
±215
0
1
2 ±22000
3 ±11000
2’s complement
0µT = 0LSB
2’s complement
0µT = 0LSB
unsigned
0µT = 215LSB
unsigned
0µT = 215LSB
i
S
E
R
RANGE
±215
±215
unsigned
0µT = 215LSB
unsigned
0µT = 215LSB
N/A
Table 4: Output Range and Type as a function of TCMP_EN and RES_XYZ={RESX,RESY,RESZ}
GAIN_SEL
0
1
2
3
4
5
6
7
3901090393
Rev002
Page 7
Data Sheet
Feb-2015
�
MLX90393
Micropower Triaxis® Magnetometer Datasheet
XY-axis Noise over Conversion Time (bundled per OSR setting)
60
50
40
30
20
10
0
1
90
80
70
60
50
40
30
20
10
0
1
OSR = 0
OSR = 1
OSR = 2
OSR = 3
OSR = 0
OSR = 1
OSR = 2
OSR = 3
10
Conversion Time [ms]
100
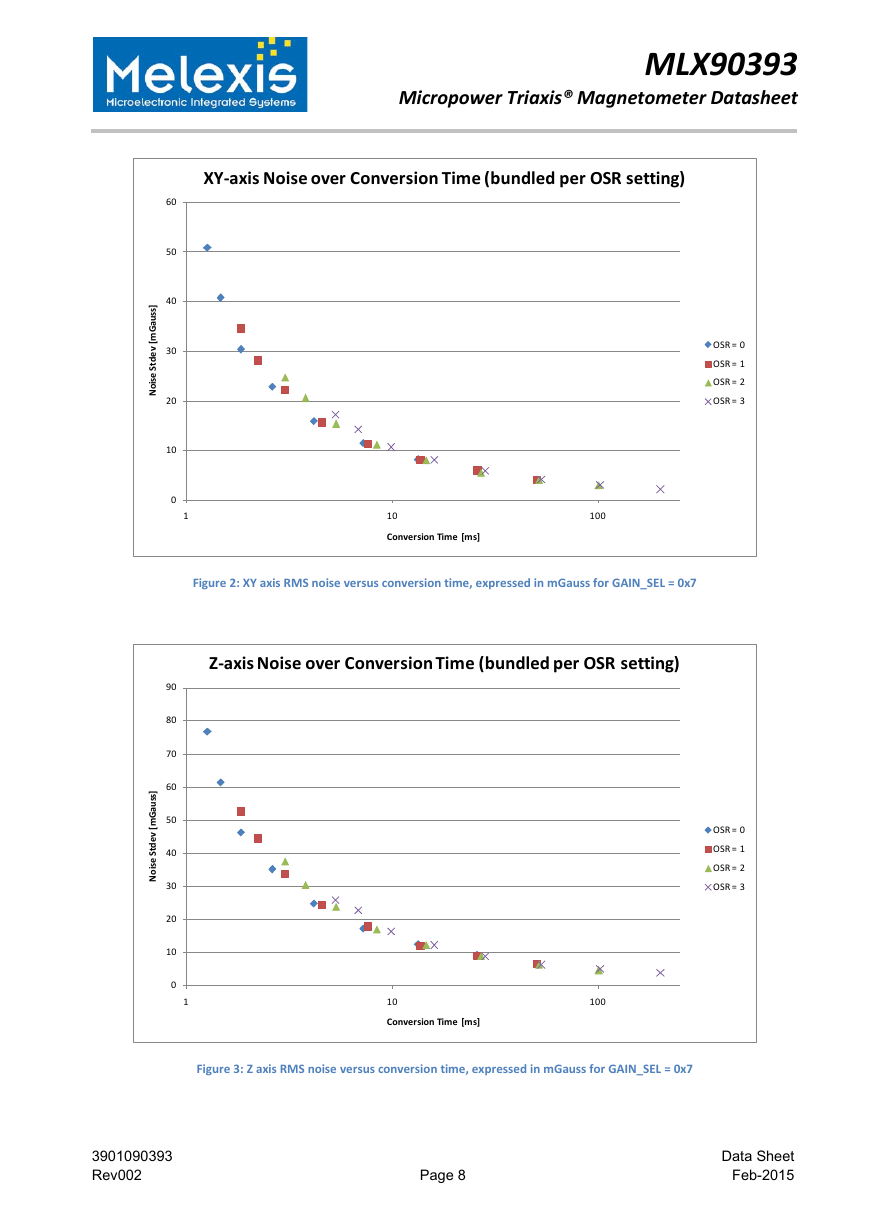
Figure 2: XY axis RMS noise versus conversion time, expressed in mGauss for GAIN_SEL = 0x7
Z-axis Noise over Conversion Time (bundled per OSR setting)
10
Conversion Time [ms]
100
Figure 3: Z axis RMS noise versus conversion time, expressed in mGauss for GAIN_SEL = 0x7
]
s
s
u
a
G
m
[
v
e
d
t
S
e
s
i
o
N
]
s
s
u
a
G
m
[
v
e
d
t
S
e
s
i
o
N
3901090393
Rev002
Page 8
Data Sheet
Feb-2015
�



 2023年江西萍乡中考道德与法治真题及答案.doc
 2012年重庆南川中考生物真题及答案.doc
 2013年江西师范大学地理学综合及文艺理论基础考研真题.doc
 2020年四川甘孜小升初语文真题及答案I卷.doc
 2020年注册岩土工程师专业基础考试真题及答案.doc
 2023-2024学年福建省厦门市九年级上学期数学月考试题及答案.doc
 2021-2022学年辽宁省沈阳市大东区九年级上学期语文期末试题及答案.doc
 2022-2023学年北京东城区初三第一学期物理期末试卷及答案.doc
 2018上半年江西教师资格初中地理学科知识与教学能力真题及答案.doc
 2012年河北国家公务员申论考试真题及答案-省级.doc
 2020-2021学年江苏省扬州市江都区邵樊片九年级上学期数学第一次质量检测试题及答案.doc
 2022下半年黑龙江教师资格证中学综合素质真题及答案.doc