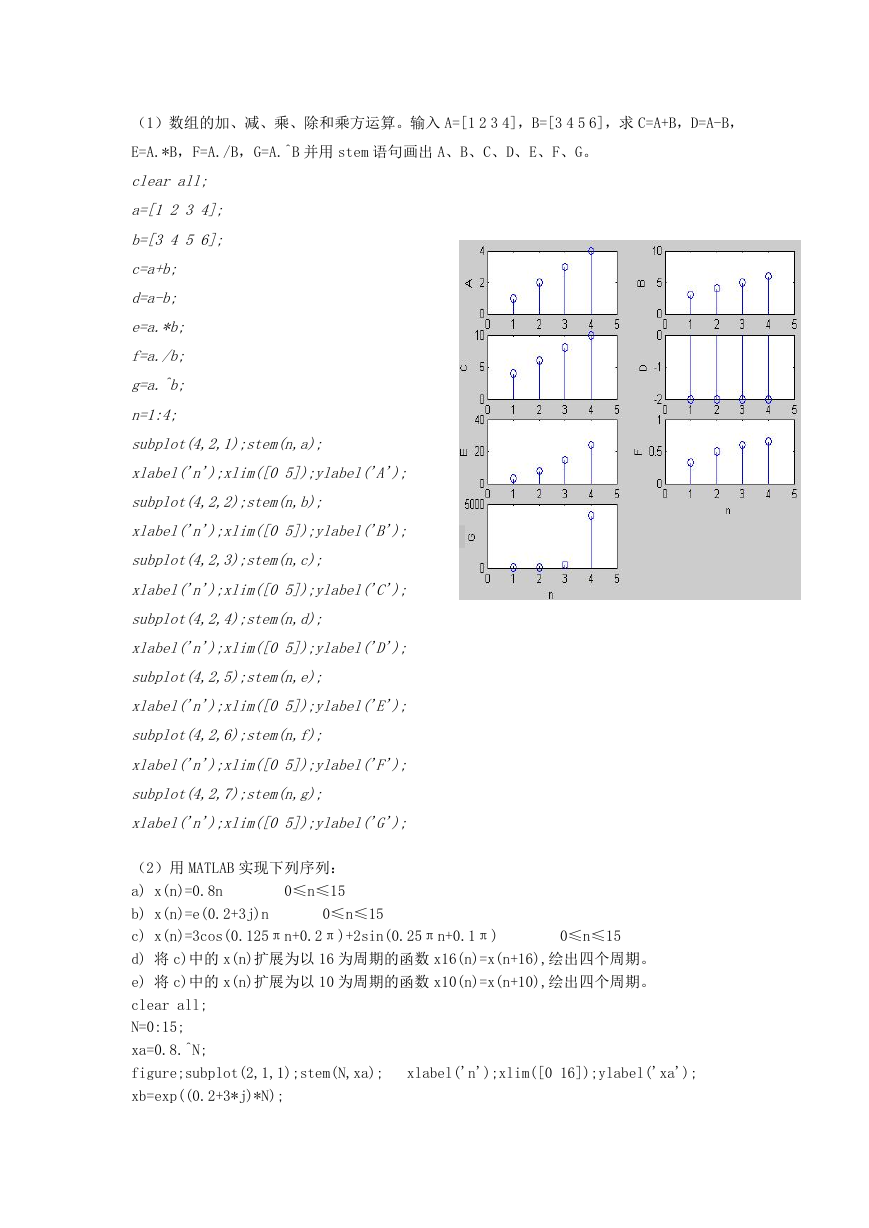
(1)数组的加、减、乘、除和乘方运算。输入 A=[1 2 3 4],B=[3 4 5 6],求 C=A+B,D=A-B,
E=A.*B,F=A./B,G=A.^B 并用 stem 语句画出 A、B、C、D、E、F、G。
clear all;
a=[1 2 3 4];
b=[3 4 5 6];
c=a+b;
d=a-b;
e=a.*b;
f=a./b;
g=a.^b;
n=1:4;
subplot(4,2,1);stem(n,a);
xlabel('n');xlim([0 5]);ylabel('A');
subplot(4,2,2);stem(n,b);
xlabel('n');xlim([0 5]);ylabel('B');
subplot(4,2,3);stem(n,c);
xlabel('n');xlim([0 5]);ylabel('C');
subplot(4,2,4);stem(n,d);
xlabel('n');xlim([0 5]);ylabel('D');
subplot(4,2,5);stem(n,e);
xlabel('n');xlim([0 5]);ylabel('E');
subplot(4,2,6);stem(n,f);
xlabel('n');xlim([0 5]);ylabel('F');
subplot(4,2,7);stem(n,g);
xlabel('n');xlim([0 5]);ylabel('G');
0≤n≤15
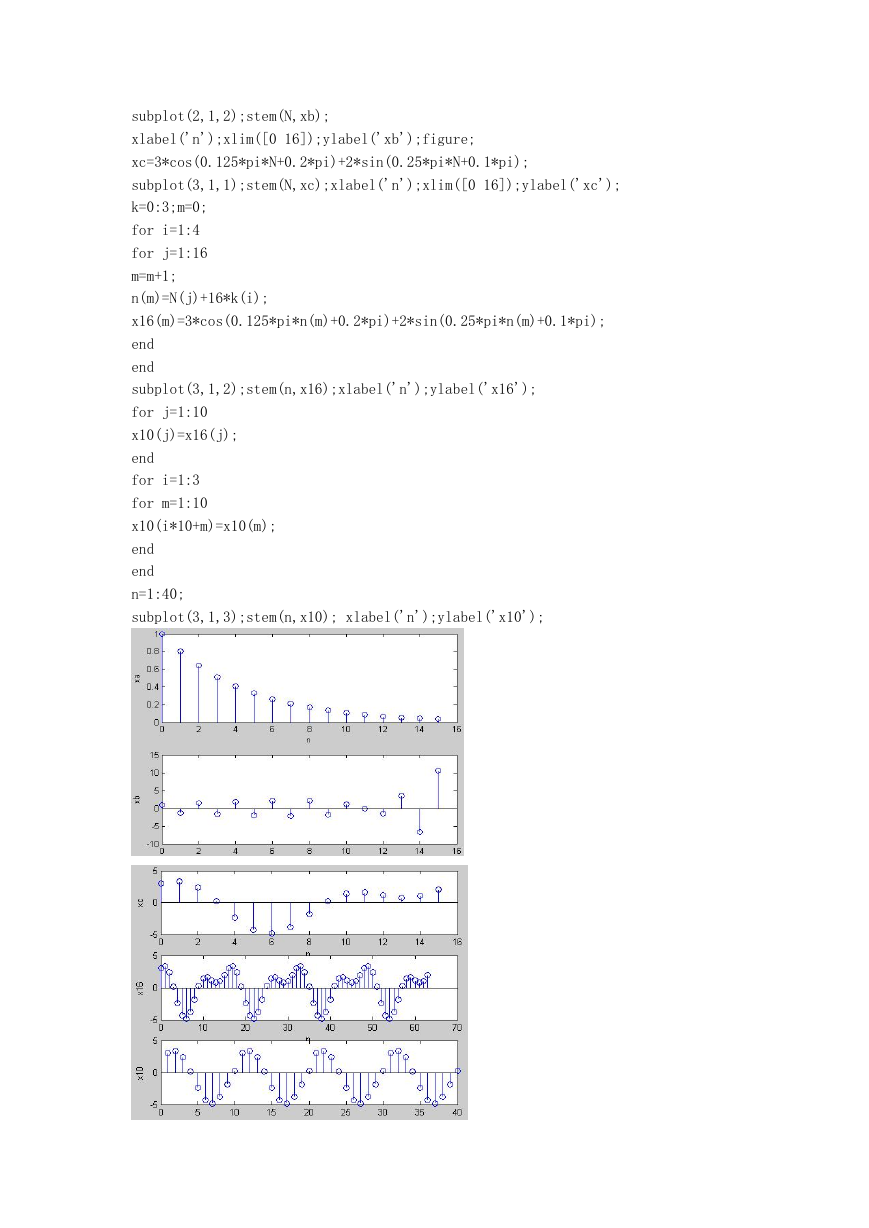
(2)用 MATLAB 实现下列序列:
a) x(n)=0.8n
0≤n≤15
b) x(n)=e(0.2+3j)n
c) x(n)=3cos(0.125πn+0.2π)+2sin(0.25πn+0.1π)
d) 将 c)中的 x(n)扩展为以 16 为周期的函数 x16(n)=x(n+16),绘出四个周期。
e) 将 c)中的 x(n)扩展为以 10 为周期的函数 x10(n)=x(n+10),绘出四个周期。
clear all;
N=0:15;
xa=0.8.^N;
figure;subplot(2,1,1);stem(N,xa);
xb=exp((0.2+3*j)*N);
0≤n≤15
xlabel('n');xlim([0 16]);ylabel('xa');
�
subplot(2,1,2);stem(N,xb);
xlabel('n');xlim([0 16]);ylabel('xb');figure;
xc=3*cos(0.125*pi*N+0.2*pi)+2*sin(0.25*pi*N+0.1*pi);
subplot(3,1,1);stem(N,xc);xlabel('n');xlim([0 16]);ylabel('xc');
k=0:3;m=0;
for i=1:4
for j=1:16
m=m+1;
n(m)=N(j)+16*k(i);
x16(m)=3*cos(0.125*pi*n(m)+0.2*pi)+2*sin(0.25*pi*n(m)+0.1*pi);
end
end
subplot(3,1,2);stem(n,x16);xlabel('n');ylabel('x16');
for j=1:10
x10(j)=x16(j);
end
for i=1:3
for m=1:10
x10(i*10+m)=x10(m);
end
end
n=1:40;
subplot(3,1,3);stem(n,x10); xlabel('n');ylabel('x10');
�
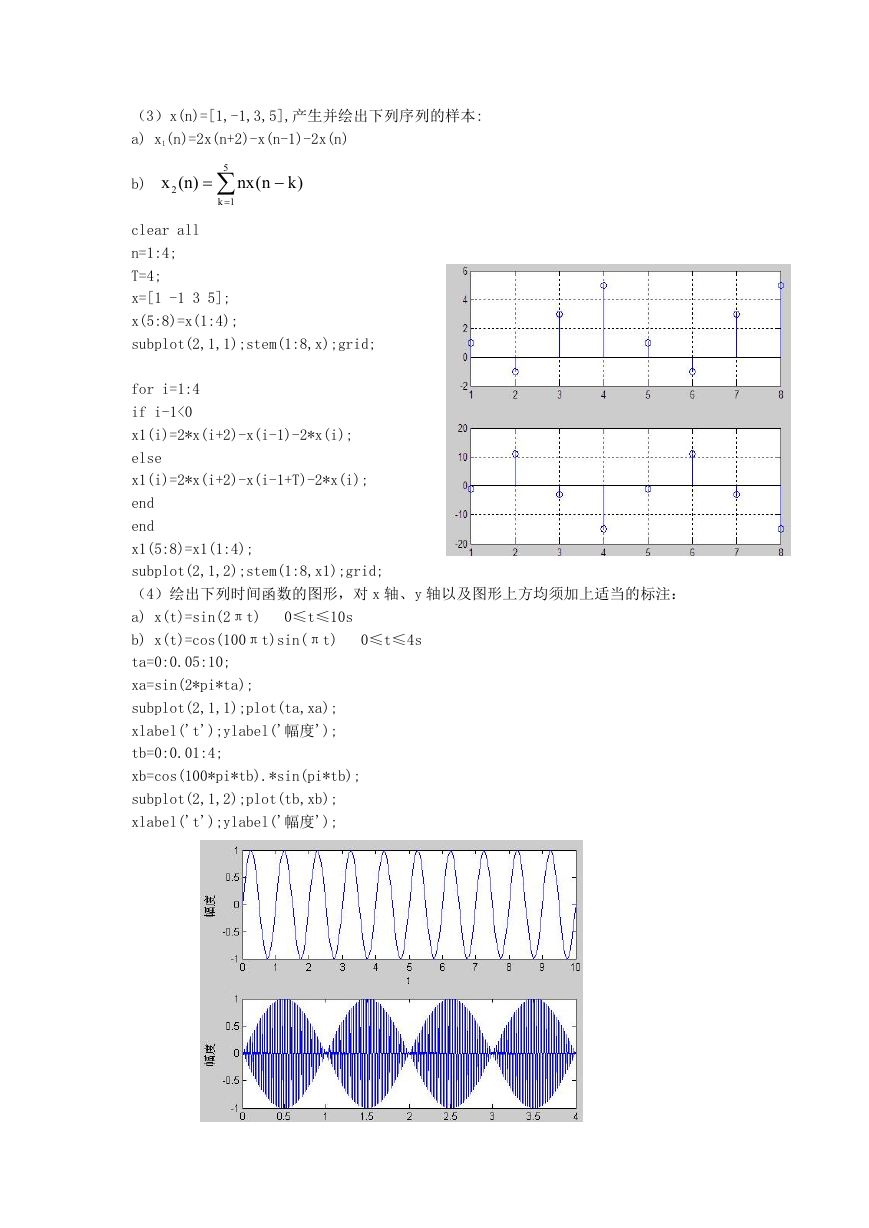
(3)x(n)=[1,-1,3,5],产生并绘出下列序列的样本:
a) x1(n)=2x(n+2)-x(n-1)-2x(n)
b)
x
2
(n)
5
1k
)kn(nx
clear all
n=1:4;
T=4;
x=[1 -1 3 5];
x(5:8)=x(1:4);
subplot(2,1,1);stem(1:8,x);grid;
for i=1:4
if i-1<0
x1(i)=2*x(i+2)-x(i-1)-2*x(i);
else
x1(i)=2*x(i+2)-x(i-1+T)-2*x(i);
end
end
x1(5:8)=x1(1:4);
subplot(2,1,2);stem(1:8,x1);grid;
(4)绘出下列时间函数的图形,对 x 轴、y 轴以及图形上方均须加上适当的标注:
a) x(t)=sin(2πt)
b) x(t)=cos(100πt)sin(πt)
ta=0:0.05:10;
xa=sin(2*pi*ta);
subplot(2,1,1);plot(ta,xa);
xlabel('t');ylabel('幅度');
tb=0:0.01:4;
xb=cos(100*pi*tb).*sin(pi*tb);
subplot(2,1,2);plot(tb,xb);
xlabel('t');ylabel('幅度');
0≤t≤10s
0≤t≤4s
�
(5)编写函数 stepshift(n0,n1,n2)实现 u(n-n0),n1=0];
stem(n,x);
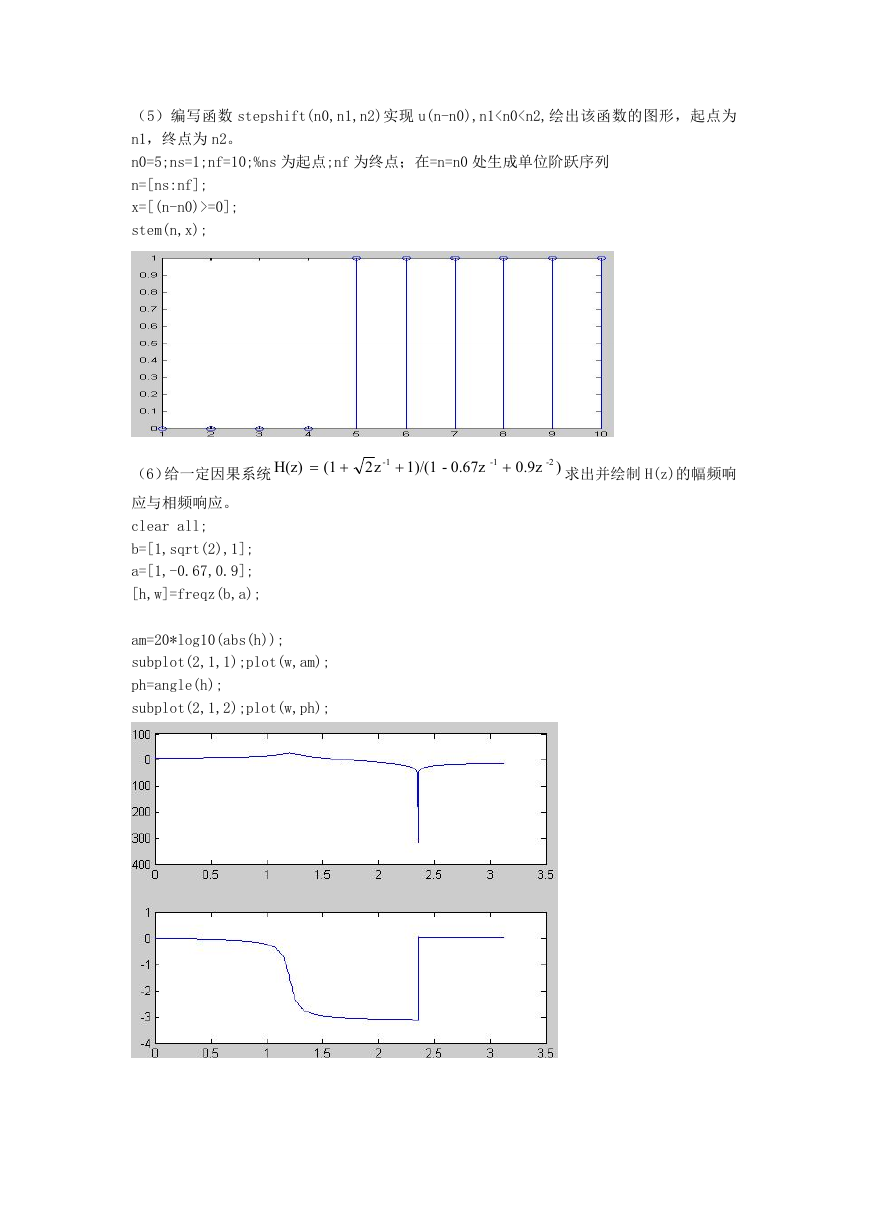
(6)给一定因果系统
H(z)
(1
-1
z2
1)/(1
-
0.67z
-1
0.9z
-2
)
求出并绘制 H(z)的幅频响
应与相频响应。
clear all;
b=[1,sqrt(2),1];
a=[1,-0.67,0.9];
[h,w]=freqz(b,a);
am=20*log10(abs(h));
subplot(2,1,1);plot(w,am);
ph=angle(h);
subplot(2,1,2);plot(w,ph);
�
(7)计算序列{8 -2 -1 2 3}和序列{2 3 -1 -3}的离散卷积,并作图表示卷积结果。
clear all;
a=[8 -2 -1 2 3];
b=[2 3 -1 -3];
c=conv(a,b); %计算卷积
M=length(c)-1;
n=0:1:M;
stem(n,c);
xlabel('n');ylabel('幅度');
(8)求以下差分方程所描述系统的单位脉冲响应 h(n),0≤n≤50
y(n)+0.1y(n-1)-0.06y(n-2)=x(n)-2x(n-1)
clear all;
N=50;
a=[1 -2];
b=[1 0.1 -0.06];
x=[1 zeros(1,N-1)];
k=0:1:N-1;
y=filter(a,b,x);
stem(k,y);
xlabel('n');ylabel('幅度 ');
�
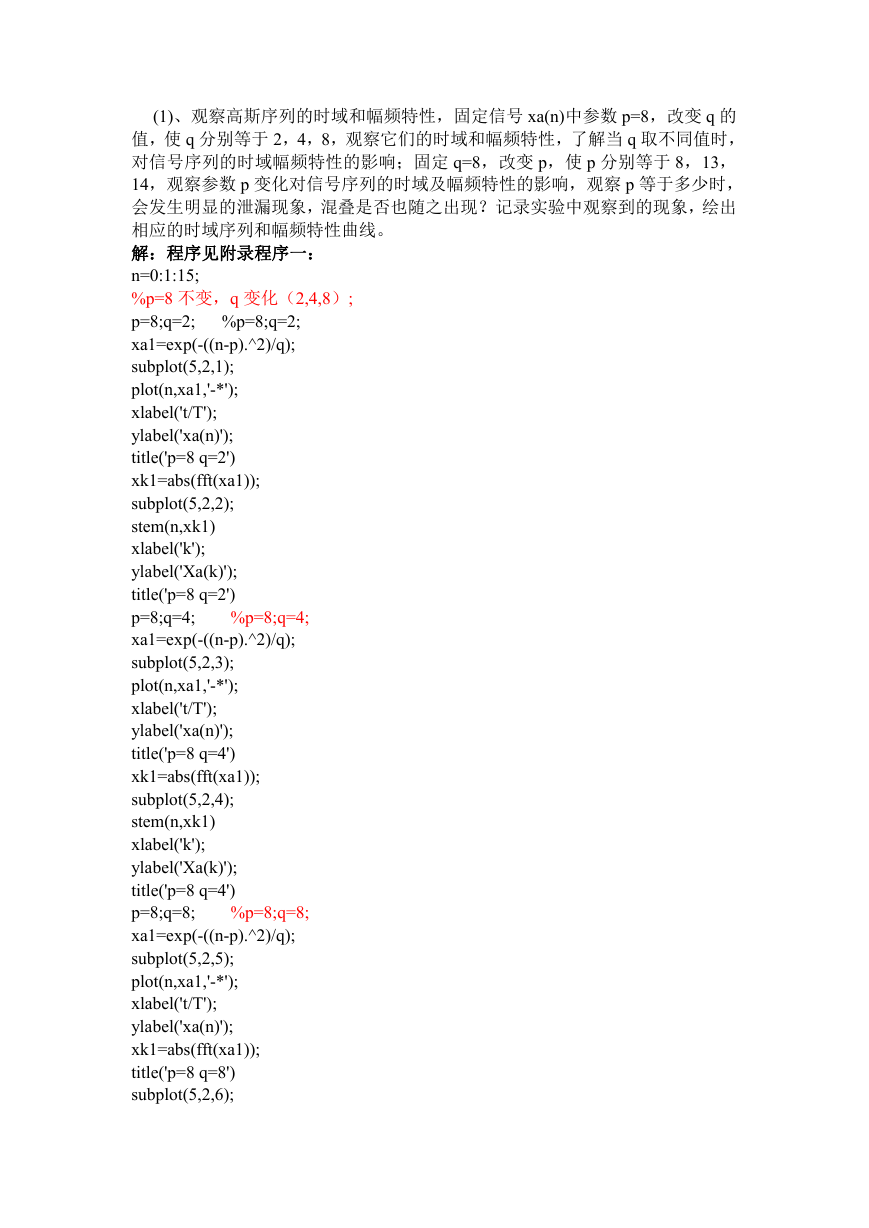
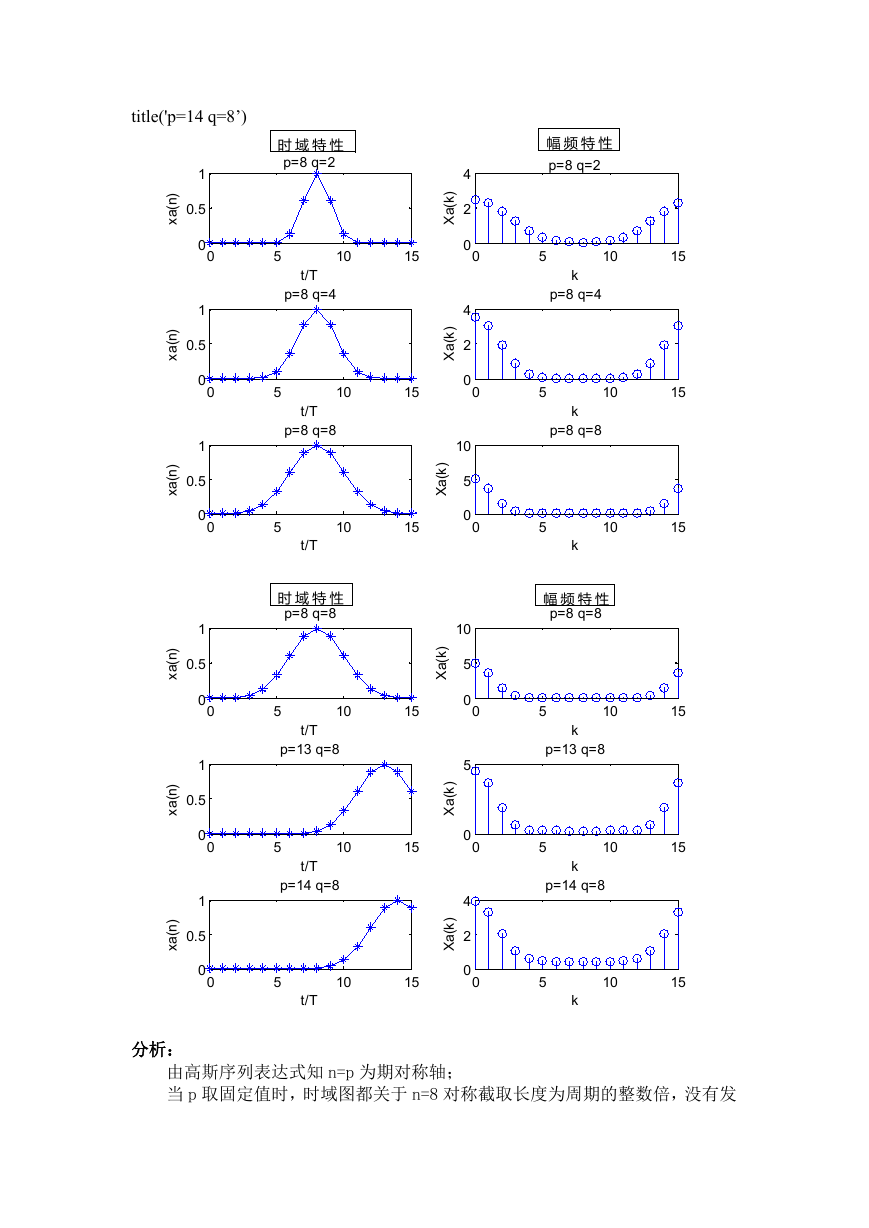
(1)、观察高斯序列的时域和幅频特性,固定信号 xa(n)中参数 p=8,改变 q 的
值,使 q 分别等于 2,4,8,观察它们的时域和幅频特性,了解当 q 取不同值时,
对信号序列的时域幅频特性的影响;固定 q=8,改变 p,使 p 分别等于 8,13,
14,观察参数 p 变化对信号序列的时域及幅频特性的影响,观察 p 等于多少时,
会发生明显的泄漏现象,混叠是否也随之出现?记录实验中观察到的现象,绘出
相应的时域序列和幅频特性曲线。
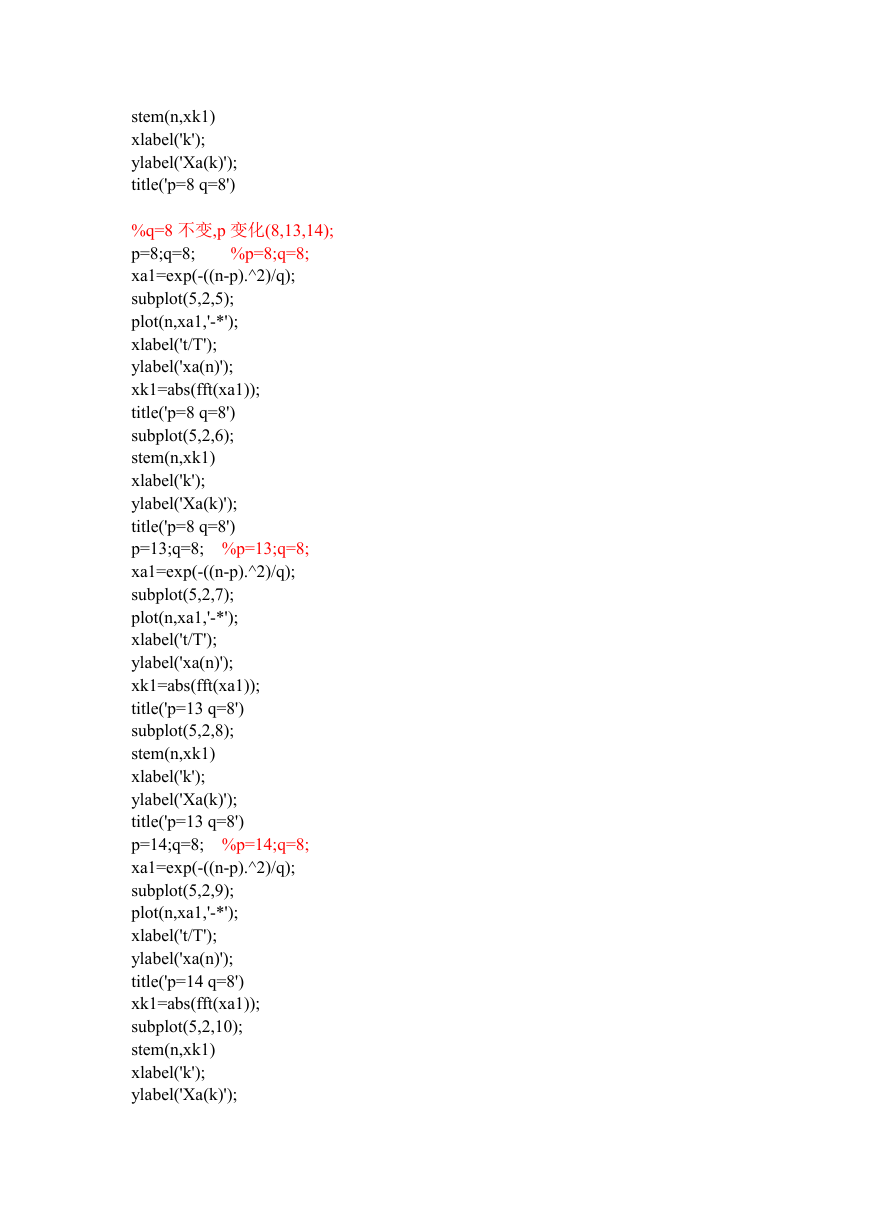
解:程序见附录程序一:
n=0:1:15;
%p=8 不变,q 变化(2,4,8);
p=8;q=2; %p=8;q=2;
xa1=exp(-((n-p).^2)/q);
subplot(5,2,1);
plot(n,xa1,'-*');
xlabel('t/T');
ylabel('xa(n)');
title('p=8 q=2')
xk1=abs(fft(xa1));
subplot(5,2,2);
stem(n,xk1)
xlabel('k');
ylabel('Xa(k)');
title('p=8 q=2')
p=8;q=4;
xa1=exp(-((n-p).^2)/q);
subplot(5,2,3);
plot(n,xa1,'-*');
xlabel('t/T');
ylabel('xa(n)');
title('p=8 q=4')
xk1=abs(fft(xa1));
subplot(5,2,4);
stem(n,xk1)
xlabel('k');
ylabel('Xa(k)');
title('p=8 q=4')
p=8;q=8;
xa1=exp(-((n-p).^2)/q);
subplot(5,2,5);
plot(n,xa1,'-*');
xlabel('t/T');
ylabel('xa(n)');
xk1=abs(fft(xa1));
title('p=8 q=8')
subplot(5,2,6);
%p=8;q=4;
%p=8;q=8;
�
stem(n,xk1)
xlabel('k');
ylabel('Xa(k)');
title('p=8 q=8')
%p=8;q=8;
%q=8 不变,p 变化(8,13,14);
p=8;q=8;
xa1=exp(-((n-p).^2)/q);
subplot(5,2,5);
plot(n,xa1,'-*');
xlabel('t/T');
ylabel('xa(n)');
xk1=abs(fft(xa1));
title('p=8 q=8')
subplot(5,2,6);
stem(n,xk1)
xlabel('k');
ylabel('Xa(k)');
title('p=8 q=8')
p=13;q=8; %p=13;q=8;
xa1=exp(-((n-p).^2)/q);
subplot(5,2,7);
plot(n,xa1,'-*');
xlabel('t/T');
ylabel('xa(n)');
xk1=abs(fft(xa1));
title('p=13 q=8')
subplot(5,2,8);
stem(n,xk1)
xlabel('k');
ylabel('Xa(k)');
title('p=13 q=8')
p=14;q=8; %p=14;q=8;
xa1=exp(-((n-p).^2)/q);
subplot(5,2,9);
plot(n,xa1,'-*');
xlabel('t/T');
ylabel('xa(n)');
title('p=14 q=8')
xk1=abs(fft(xa1));
subplot(5,2,10);
stem(n,xk1)
xlabel('k');
ylabel('Xa(k)');
�
title('p=14 q=8’)
1
)
n
(
a
x
0.5
0
0
1
)
n
(
a
x
0.5
0
0
1
)
n
(
a
x
0.5
0
0
1
)
n
(
a
x
0.5
0
0
1
)
n
(
a
x
0.5
0
0
1
)
n
(
a
x
0.5
0
0
时 域 特 性
p=8 q=2
5
5
5
10
15
t/T
p=8 q=4
10
15
t/T
p=8 q=8
10
15
t/T
时 域 特 性
p=8 q=8
5
t/T
10
15
p=13 q=8
5
t/T
10
15
p=14 q=8
5
t/T
10
15
)
k
(
a
X
)
k
(
a
X
4
2
0
4
2
0
0
0
)
k
(
a
X
10
5
0
0
10
)
k
(
a
X
)
k
(
a
X
)
k
(
a
X
0
5
0
5
0
0
4
2
0
0
幅 频 特 性
p=8 q=2
5
5
5
10
15
k
p=8 q=4
10
15
k
p=8 q=8
10
15
k
幅 频 特 性
p=8 q=8
5
k
10
15
p=13 q=8
5
k
10
15
p=14 q=8
5
k
10
15
分析:
由高斯序列表达式知 n=p 为期对称轴;
当 p 取固定值时,时域图都关于 n=8 对称截取长度为周期的整数倍,没有发
�



 2023年江西萍乡中考道德与法治真题及答案.doc
 2012年重庆南川中考生物真题及答案.doc
 2013年江西师范大学地理学综合及文艺理论基础考研真题.doc
 2020年四川甘孜小升初语文真题及答案I卷.doc
 2020年注册岩土工程师专业基础考试真题及答案.doc
 2023-2024学年福建省厦门市九年级上学期数学月考试题及答案.doc
 2021-2022学年辽宁省沈阳市大东区九年级上学期语文期末试题及答案.doc
 2022-2023学年北京东城区初三第一学期物理期末试卷及答案.doc
 2018上半年江西教师资格初中地理学科知识与教学能力真题及答案.doc
 2012年河北国家公务员申论考试真题及答案-省级.doc
 2020-2021学年江苏省扬州市江都区邵樊片九年级上学期数学第一次质量检测试题及答案.doc
 2022下半年黑龙江教师资格证中学综合素质真题及答案.doc