Optimized Graph
Algorithms in Neo4j
Use the Power of Connections
to Drive Discovery
The #1 Platform for Connected Dataneo4j.comWhite PaperWHITE PAPER�
“. . .The tools of graph theory can be utilized in order to
analyze the networks and obtain a better understanding of
their overall construction. This approach has led to several
groundbreaking discoveries on the nature of networks,
crossing fields of research from biology, to social science and
technology.”
Albert-László Barabási
Director, Center for Complex Network Research
Northeastern University
Author of numerous network science books
B
neo4j.comOptimized Graph Algorithms in Neo4j�
Optimized Graph Algorithms
in Neo4j
Use the Power of Connections
to Drive Discoveries
Amy Hodler
Algorithms: The Graph Analysis Powerhouse
Graph algorithms are the powerhouse behind the analysis of real-world networks—
from identifying fraud rings and optimizing the location of public services to evaluating
the strength of a group and predicting the spread of disease or ideas.
Based on the unique mathematics of graph theory, these algorithms use the connections
between data to evaluate and infer the organization and dynamics of complex systems.
Data scientists use these penetrating graph algorithms to bring to light valuable information
hidden in our connected data. They then use this analysis to iterate prototypes and test
hypotheses.
A Practical Approach to Graph Analytics
Graph analytics have value only if you have the skills to use them and if they can quickly
provide the insights you need. Therefore, the best graph algorithms are easy to use, fast to
execute and produce powerful results.
For transactions and operational decisions, you need real-time graph analysis to provide
a local view of relationships between specific data points. To discover the overall nature of
networks and model the behavior of intricate systems, you need global graph algorithms that
provide a broad view of patterns and structures across all data and relationships.
Other analytics tools layer graph functionality atop databases with non-native graph storage
and computation engines. These hybrid solutions seldom support ACID transactions, which
can ruin data integrity. Also, they must execute complicated JOINs for each query, crippling
performance and wasting system resources.
Alternatively, you could maintain multiple environments for graph analytics, but then your
algorithms aren’t integrated with, nor optimized for a graph data model. This bulky approach
is less efficient, less productive, more costly and greatly increases the risk of errors.
TABLE OF CONTENTS
Algorithms: The Graph
Analysis Powerhouse
A Practical Approach
to Graph Analytics
Example: Analyzing
Category Influence in
Wikipedia
The Neo4j Graph
Analytics Platform
Streamline Your
Discoveries
Example: High
Performance of Neo4j
Graph Algorithms
The Power of Optimized
Algorithms in Neo4j
Pathfinding and
Traversal Algorithms
Centrality Algorithms
Community Detection
Algorithms
Use the Power of
Connections to
Drive Discoveries
1
1
2
3
3
4
4
5
6
7
8
1
neo4j.comWhite PaperThe #1 Platform for Connected Data�
To understand data
connections, you need
global graph algorithms
that provide a broad
view of patterns and
structures across all
data and relationships.
Real-time graph algorithms require exceptionally fast (millisecond-scale) results whereas
global graph algorithms can be very computationally demanding. Graph analytics must have
algorithms optimized for these different requirements with the ability to efficiently scale—
analyzing billions of relationships without the need for super-sized or burdensome equipment.
This kind of versatile scale necessitates very efficient storage and computational models as
well as the use of state-of-the-art algorithms that avoid stalling or recursive processes.
Finally, a collection of graph algorithms must be vetted so your discoveries will be trustworthy,
and include ongoing educational material so your teams will be up-to-date. With these
fundamental elements in place, you can confidently make progress on your breakthrough
applications.
Example: Analyzing Category Influence in Wikipedia
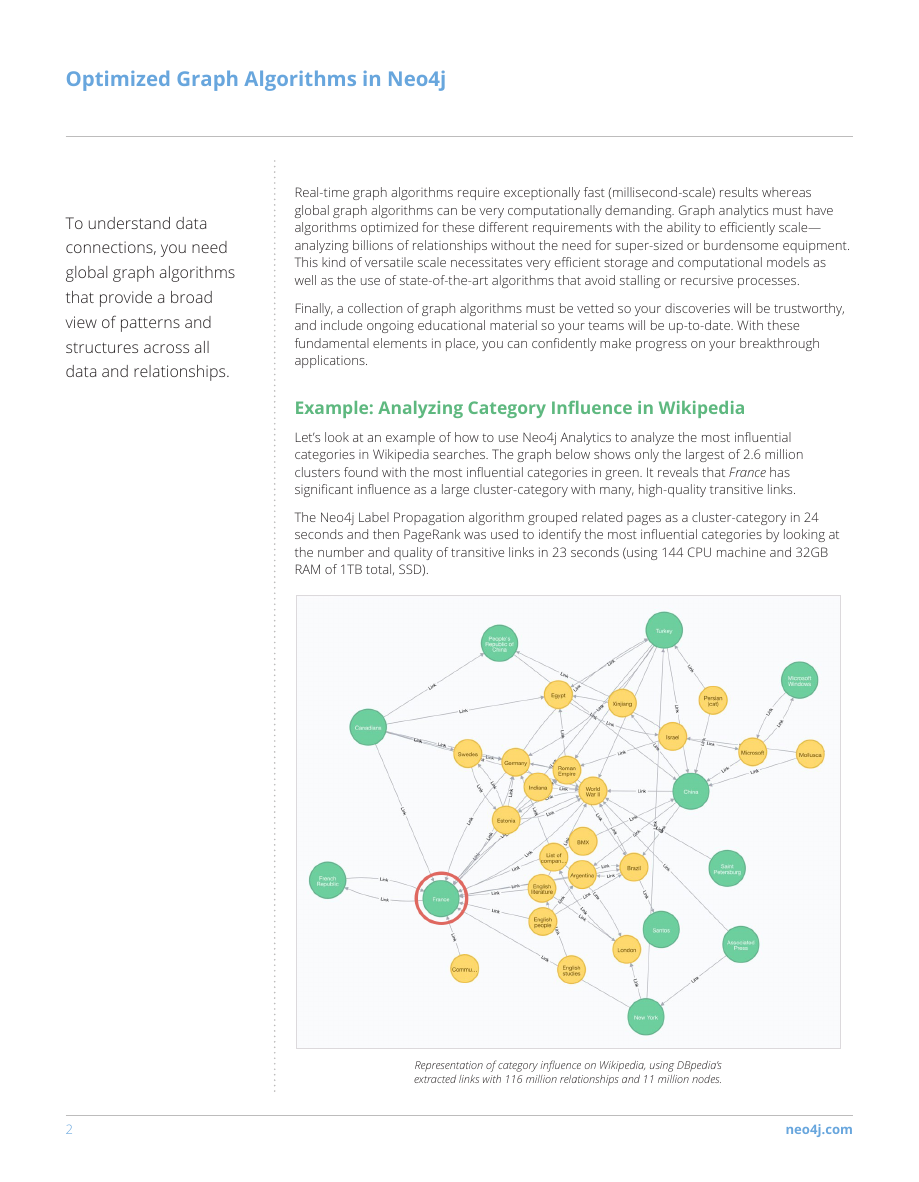
Let’s look at an example of how to use Neo4j Analytics to analyze the most influential
categories in Wikipedia searches. The graph below shows only the largest of 2.6 million
clusters found with the most influential categories in green. It reveals that France has
significant influence as a large cluster-category with many, high-quality transitive links.
The Neo4j Label Propagation algorithm grouped related pages as a cluster-category in 24
seconds and then PageRank was used to identify the most influential categories by looking at
the number and quality of transitive links in 23 seconds (using 144 CPU machine and 32GB
RAM of 1TB total, SSD).
2
Representation of category influence on Wikipedia, using DBpedia’s
extracted links with 116 million relationships and 11 million nodes.
neo4j.comOptimized Graph Algorithms in Neo4j�
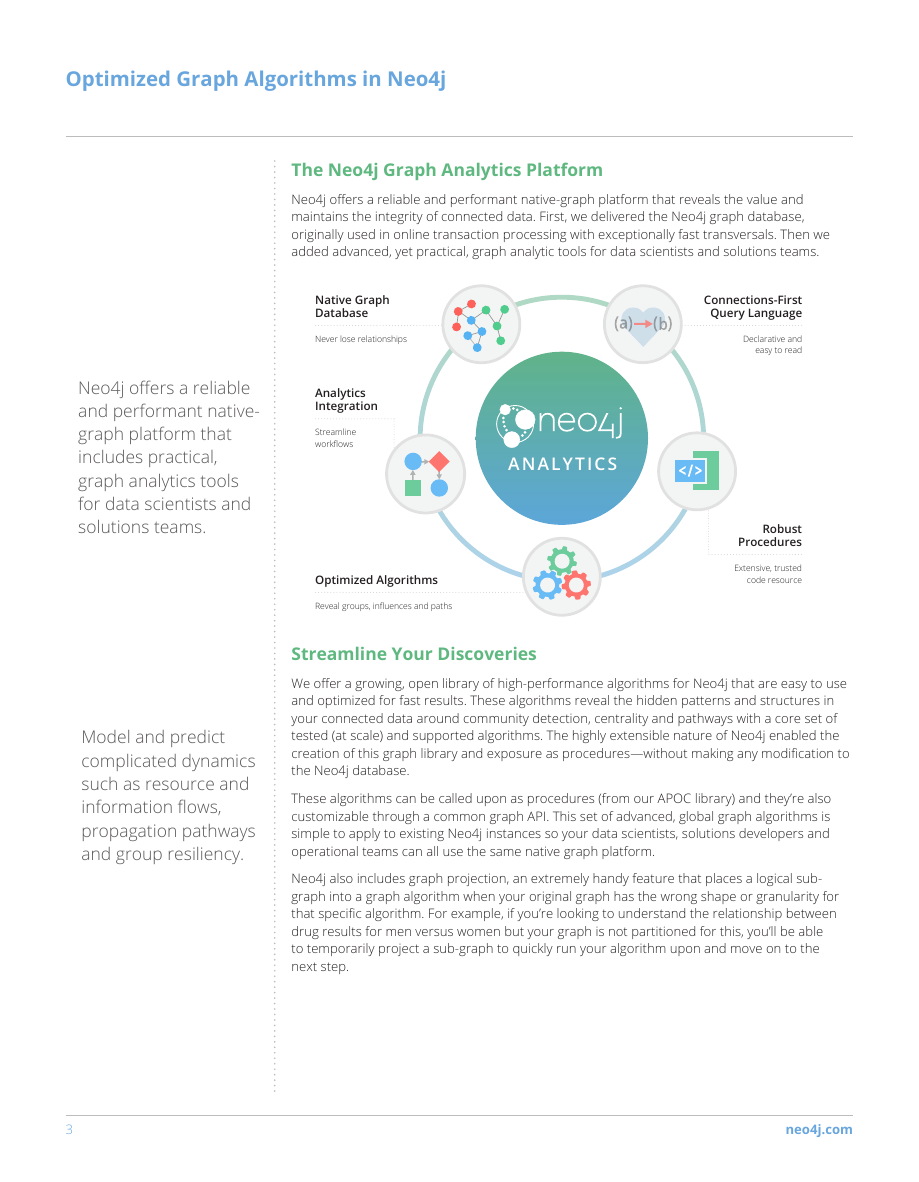
The Neo4j Graph Analytics Platform
Neo4j offers a reliable and performant native-graph platform that reveals the value and
maintains the integrity of connected data. First, we delivered the Neo4j graph database,
originally used in online transaction processing with exceptionally fast transversals. Then we
added advanced, yet practical, graph analytic tools for data scientists and solutions teams.
Native Graph
Database
Never lose relationships
Analytics
Integration
Streamline
workflows
Optimized Algorithms
Reveal groups, influences and paths
ANALYTICS
Connections-First
Query Language
Declarative and
easy to read
Robust
Procedures
Extensive, trusted
code resource
Streamline Your Discoveries
We offer a growing, open library of high-performance algorithms for Neo4j that are easy to use
and optimized for fast results. These algorithms reveal the hidden patterns and structures in
your connected data around community detection, centrality and pathways with a core set of
tested (at scale) and supported algorithms. The highly extensible nature of Neo4j enabled the
creation of this graph library and exposure as procedures—without making any modification to
the Neo4j database.
These algorithms can be called upon as procedures (from our APOC library) and they’re also
customizable through a common graph API. This set of advanced, global graph algorithms is
simple to apply to existing Neo4j instances so your data scientists, solutions developers and
operational teams can all use the same native graph platform.
Neo4j also includes graph projection, an extremely handy feature that places a logical sub-
graph into a graph algorithm when your original graph has the wrong shape or granularity for
that specific algorithm. For example, if you’re looking to understand the relationship between
drug results for men versus women but your graph is not partitioned for this, you’ll be able
to temporarily project a sub-graph to quickly run your algorithm upon and move on to the
next step.
Neo4j offers a reliable
and performant native-
graph platform that
includes practical,
graph analytics tools
for data scientists and
solutions teams.
Model and predict
complicated dynamics
such as resource and
information flows,
propagation pathways
and group resiliency.
3
neo4j.comOptimized Graph Algorithms in Neo4jNative Graph DatabaseAnalyticsIntegrationReveal groups, influences and pathsConnections-FirstQuery LanguageRobustProceduresNever lose relationshipsDeclarative and easy to readExtensive, trustedcode resourceStreamlineworkflowsOptimized Algorithms�
Example: High Performance of Neo4j Graph Algorithms
Neo4j graph algorithms are extremely efficient so you can analyze billions of relationships
using common equipment and get your results in seconds to minutes, and in a few hours
for the most complicated queries.
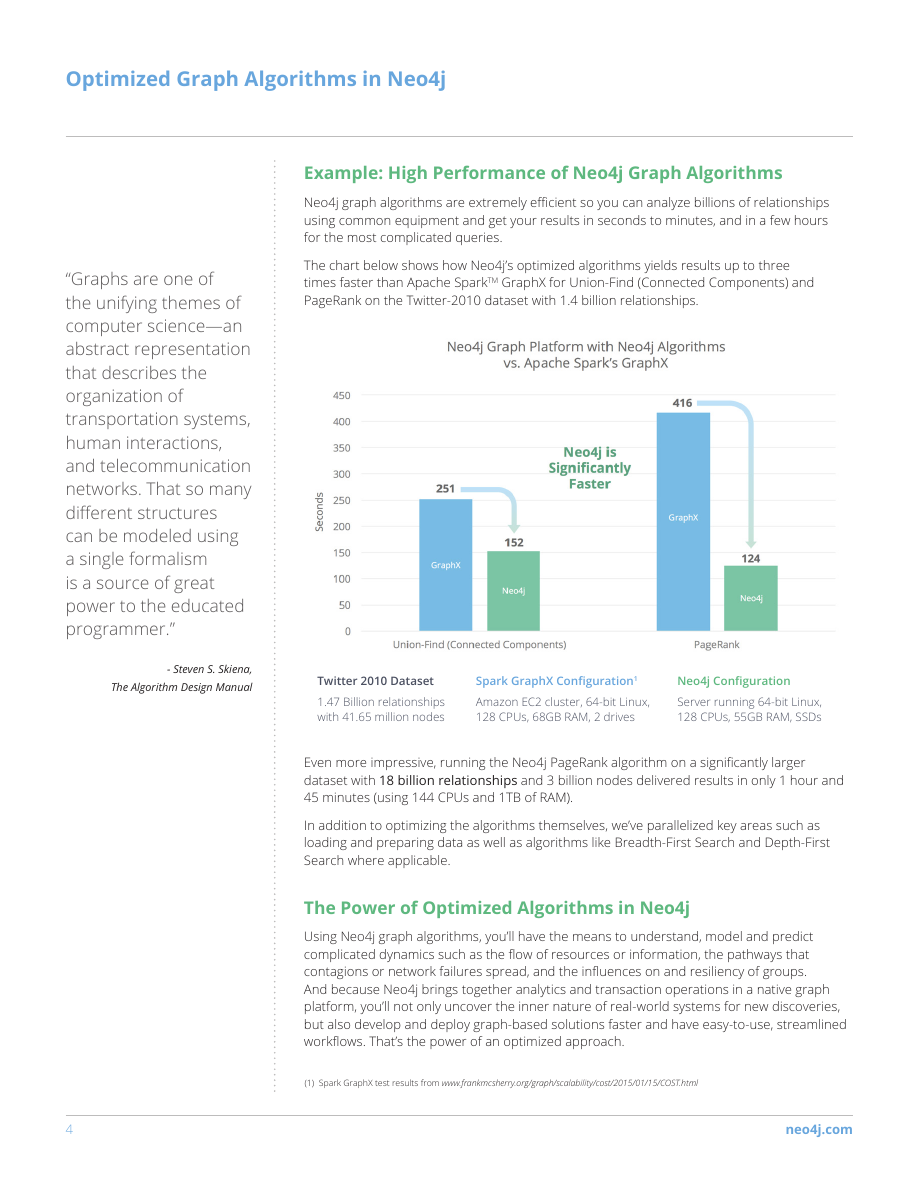
The chart below shows how Neo4j’s optimized algorithms yields results up to three
times faster than Apache SparkTM GraphX for Union-Find (Connected Components) and
PageRank on the Twitter-2010 dataset with 1.4 billion relationships.
Twitter 2010 Dataset
1.47 Billion relationships
with 41.65 million nodes
Spark GraphX Configuration1
Amazon EC2 cluster, 64-bit Linux,
128 CPUs, 68GB RAM, 2 drives
Neo4j Configuration
Server running 64-bit Linux,
128 CPUs, 55GB RAM, SSDs
Even more impressive, running the Neo4j PageRank algorithm on a significantly larger
dataset with 18 billion relationships and 3 billion nodes delivered results in only 1 hour and
45 minutes (using 144 CPUs and 1TB of RAM).
In addition to optimizing the algorithms themselves, we’ve parallelized key areas such as
loading and preparing data as well as algorithms like Breadth-First Search and Depth-First
Search where applicable.
The Power of Optimized Algorithms in Neo4j
Using Neo4j graph algorithms, you’ll have the means to understand, model and predict
complicated dynamics such as the flow of resources or information, the pathways that
contagions or network failures spread, and the influences on and resiliency of groups.
And because Neo4j brings together analytics and transaction operations in a native graph
platform, you’ll not only uncover the inner nature of real-world systems for new discoveries,
but also develop and deploy graph-based solutions faster and have easy-to-use, streamlined
workflows. That’s the power of an optimized approach.
(1) Spark GraphX test results from www.frankmcsherry.org/graph/scalability/cost/2015/01/15/COST.html
“Graphs are one of
the unifying themes of
computer science—an
abstract representation
that describes the
organization of
transportation systems,
human interactions,
and telecommunication
networks. That so many
different structures
can be modeled using
a single formalism
is a source of great
power to the educated
programmer.”
- Steven S. Skiena,
The Algorithm Design Manual
4
neo4j.comOptimized Graph Algorithms in Neo4j�
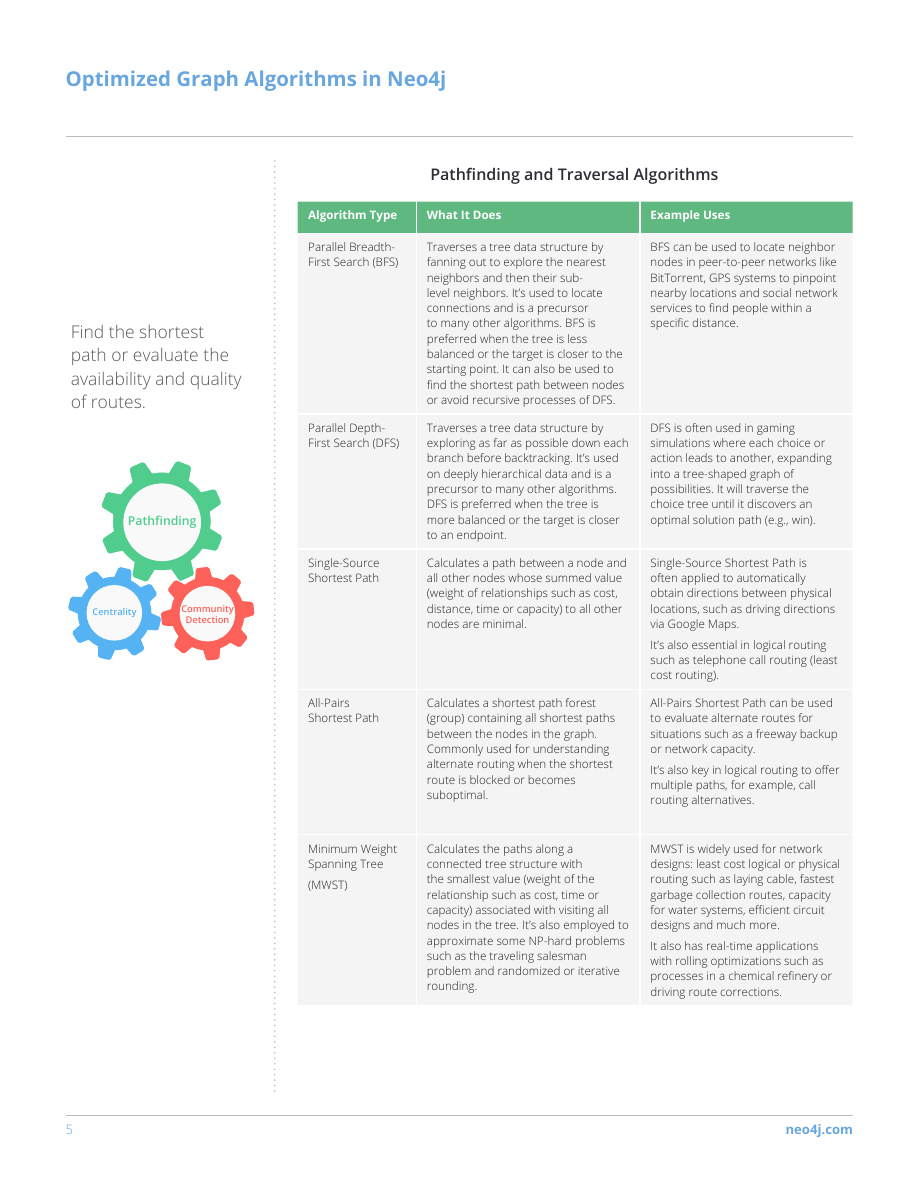
Pathfinding and Traversal Algorithms
Algorithm Type
What It Does
Example Uses
Parallel Breadth-
First Search (BFS)
Parallel Depth-
First Search (DFS)
Single-Source
Shortest Path
All-Pairs
Shortest Path
Minimum Weight
Spanning Tree
(MWST)
Traverses a tree data structure by
fanning out to explore the nearest
neighbors and then their sub-
level neighbors. It’s used to locate
connections and is a precursor
to many other algorithms. BFS is
preferred when the tree is less
balanced or the target is closer to the
starting point. It can also be used to
find the shortest path between nodes
or avoid recursive processes of DFS.
Traverses a tree data structure by
exploring as far as possible down each
branch before backtracking. It’s used
on deeply hierarchical data and is a
precursor to many other algorithms.
DFS is preferred when the tree is
more balanced or the target is closer
to an endpoint.
Calculates a path between a node and
all other nodes whose summed value
(weight of relationships such as cost,
distance, time or capacity) to all other
nodes are minimal.
Calculates a shortest path forest
(group) containing all shortest paths
between the nodes in the graph.
Commonly used for understanding
alternate routing when the shortest
route is blocked or becomes
suboptimal.
BFS can be used to locate neighbor
nodes in peer-to-peer networks like
BitTorrent, GPS systems to pinpoint
nearby locations and social network
services to find people within a
specific distance.
DFS is often used in gaming
simulations where each choice or
action leads to another, expanding
into a tree-shaped graph of
possibilities. It will traverse the
choice tree until it discovers an
optimal solution path (e.g., win).
Single-Source Shortest Path is
often applied to automatically
obtain directions between physical
locations, such as driving directions
via Google Maps.
It’s also essential in logical routing
such as telephone call routing (least
cost routing).
All-Pairs Shortest Path can be used
to evaluate alternate routes for
situations such as a freeway backup
or network capacity.
It’s also key in logical routing to offer
multiple paths, for example, call
routing alternatives.
Calculates the paths along a
connected tree structure with
the smallest value (weight of the
relationship such as cost, time or
capacity) associated with visiting all
nodes in the tree. It’s also employed to
approximate some NP-hard problems
such as the traveling salesman
problem and randomized or iterative
rounding.
MWST is widely used for network
designs: least cost logical or physical
routing such as laying cable, fastest
garbage collection routes, capacity
for water systems, efficient circuit
designs and much more.
It also has real-time applications
with rolling optimizations such as
processes in a chemical refinery or
driving route corrections.
Find the shortest
path or evaluate the
availability and quality
of routes.
Pathfinding
Centrality
Community
Detection
5
neo4j.comOptimized Graph Algorithms in Neo4j�
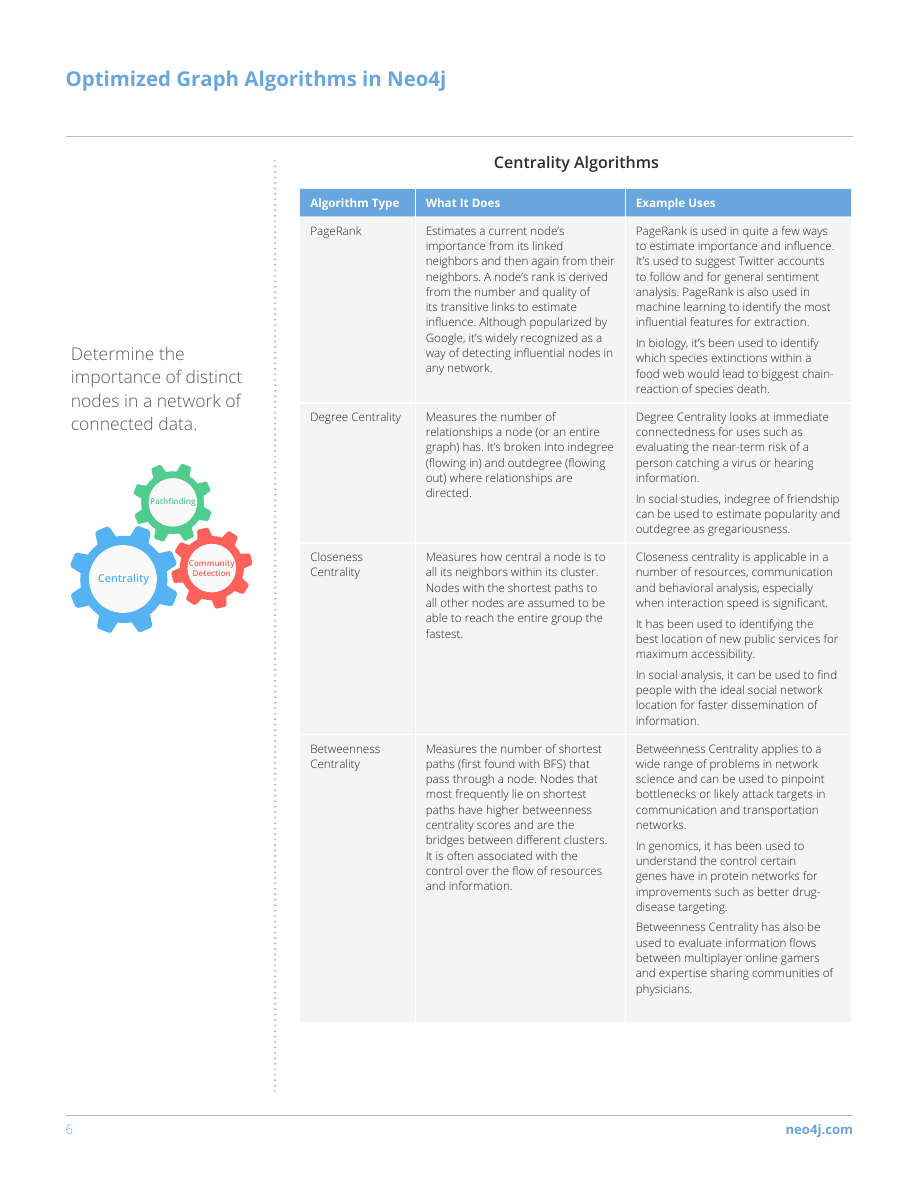
Centrality Algorithms
Algorithm Type
What It Does
Example Uses
PageRank
Degree Centrality
Determine the
importance of distinct
nodes in a network of
connected data.
Pathfinding
Centrality
Community
Detection
Closeness
Centrality
Estimates a current node’s
importance from its linked
neighbors and then again from their
neighbors. A node’s rank is derived
from the number and quality of
its transitive links to estimate
influence. Although popularized by
Google, it’s widely recognized as a
way of detecting influential nodes in
any network.
Measures the number of
relationships a node (or an entire
graph) has. It’s broken into indegree
(flowing in) and outdegree (flowing
out) where relationships are
directed.
Measures how central a node is to
all its neighbors within its cluster.
Nodes with the shortest paths to
all other nodes are assumed to be
able to reach the entire group the
fastest.
Betweenness
Centrality
Measures the number of shortest
paths (first found with BFS) that
pass through a node. Nodes that
most frequently lie on shortest
paths have higher betweenness
centrality scores and are the
bridges between different clusters.
It is often associated with the
control over the flow of resources
and information.
PageRank is used in quite a few ways
to estimate importance and influence.
It’s used to suggest Twitter accounts
to follow and for general sentiment
analysis. PageRank is also used in
machine learning to identify the most
influential features for extraction.
In biology, it’s been used to identify
which species extinctions within a
food web would lead to biggest chain-
reaction of species death.
Degree Centrality looks at immediate
connectedness for uses such as
evaluating the near-term risk of a
person catching a virus or hearing
information.
In social studies, indegree of friendship
can be used to estimate popularity and
outdegree as gregariousness.
Closeness centrality is applicable in a
number of resources, communication
and behavioral analysis, especially
when interaction speed is significant.
It has been used to identifying the
best location of new public services for
maximum accessibility.
In social analysis, it can be used to find
people with the ideal social network
location for faster dissemination of
information.
Betweenness Centrality applies to a
wide range of problems in network
science and can be used to pinpoint
bottlenecks or likely attack targets in
communication and transportation
networks.
In genomics, it has been used to
understand the control certain
genes have in protein networks for
improvements such as better drug-
disease targeting.
Betweenness Centrality has also be
used to evaluate information flows
between multiplayer online gamers
and expertise sharing communities of
physicians.
6
neo4j.comOptimized Graph Algorithms in Neo4j�


 2023年江西萍乡中考道德与法治真题及答案.doc
 2012年重庆南川中考生物真题及答案.doc
 2013年江西师范大学地理学综合及文艺理论基础考研真题.doc
 2020年四川甘孜小升初语文真题及答案I卷.doc
 2020年注册岩土工程师专业基础考试真题及答案.doc
 2023-2024学年福建省厦门市九年级上学期数学月考试题及答案.doc
 2021-2022学年辽宁省沈阳市大东区九年级上学期语文期末试题及答案.doc
 2022-2023学年北京东城区初三第一学期物理期末试卷及答案.doc
 2018上半年江西教师资格初中地理学科知识与教学能力真题及答案.doc
 2012年河北国家公务员申论考试真题及答案-省级.doc
 2020-2021学年江苏省扬州市江都区邵樊片九年级上学期数学第一次质量检测试题及答案.doc
 2022下半年黑龙江教师资格证中学综合素质真题及答案.doc