Polarization imaging
Jerry E. Solomon
Although several attempts have been made in the past to use the partially polarized nature of optical fields
in constructing images, the technique is not widely known or used. This paper reviews the principles of sin-
gle-parameter polarization imaging and introduces the concept of multiparameter Stokes vector imaging.
The Stokes vector image construction is discussed in the context of a recently introduced model of the
human visual system perception space.
It is shown that this perception space model allows one to take ad-
vantage of more of the information contained in the optical field to create an intelligible color display. The
perception space model is also used to define a quantitative visual discrimination
threshold applicable to
multiparameter image construction and display.
1.
Introduction
Although most scientists and engineers working in
the field of image acquisition and processing are well
aware of the partially polarized nature of the optical or
microwave fields that are used to form images, the fact
that one can utilize the polarization information to
characterize more completely an image seems to have
gone largely unnoticed. The two major exceptions to
this appear to be Garlick and Steigman 1 and Walraven.2
Garlick and Steigman have patented a device that
produces a real-time image wherein each picture ele-
ment (pixel) is constructed from the measured polar-
ization ratio of the corresponding element in the optical
image of the scene being viewed. Walraven's work
seems to be similar to that of Garlick and Steigman,
although he used photographic image acquisition and
off-line digital image processing to construct polariza-
tion images. Walraven also added another feature to
the technique by constructing images based on the
computed polarization ellipse azimuthal angle for each
pixel. Walraven mentions the possibility of generating
pseudocolor images based on the measured polarization
parameters of each pixel, but he does not discuss any
methods by which one might generate a unique and
invertible transformation from the measured parame-
ters to the perception space of the human visual system
(HVS). The patent of Garlick and Steigman also in-
dicates the possibility of generating pseudocolor images
from the measured parameters to the HVS perception
space.
The author is with San Diego State University, Physics Depart-
ment, San Diego, California 92812.
Received 13 December 1980.
0003-6935/81/091537-08$00.50/0.
© 1981 Optical Society of America.
In addition, several authors3-6 have presented theo-
retical studies of the polarization properties to be ex-
pected in the optical field seen by high altitude aircraft
or satellite reconnaissance systems. In particular, the
work of Fraser3 and Coulson4 appears to be directed
toward evaluating the effectiveness of utilizing polar-
ization analyzers in reconnaissance imaging systems to
reduce the contrast degradation due to Rayleigh and
Mie scattering in the intervening atmosphere. It should
be noted that none of these works consider the problem
of actually constructing a new image based on the
measured polarization parameters of the optical field,
although their results form the basis of a method
whereby one can estimate quantitatively the expected
performance characteristics of such an imaging
scheme.
Many of these calculations of the polarization pa-
rameters of the optical field seen at the top of a plane-
tary atmosphere due to scattering of sunlight by the
atmosphere and the ground assume that all ground
features are Lambertian (totally depolarizing) reflectors
(see, however, Coulson4 and Koepke and Kriebel5). If
this assumption were true, polarization imaging would
serve no useful purpose; however, it is generally recog-
nized that the majority of surface features (particularly
man-made ones) exhibit significant deviations from
Lambertian surfaces. Furthermore, since the indi-
vidual polarization parameters, e.g., the Stokes pa-
rameters, are generally more sensitive to the nature of
a scattering surface than is the total intensity, it would
seem that polarization imaging techniques offer the
distinct possibility of yielding images with higher in-
herent visual contrast than normal techniques in many
cases of interest. The technique should be particularly
useful in enhancing textual differences of various fea-
tures in a given scene.
1 May 1981 / Vol. 20, No. 9 / APPLIED OPTICS
1537
�
In its most general form, polarization imaging at-
tempts to extract as much information as possible from
the optical field presented to the sensor system. Since
this is one of the fundamental objectives of remote-
sensing imagery, it is worthwhile examining in detail
some of the principal characteristics and problems as-
sociated with polarization imaging schemes. Except
for the simple polarization-ratio black and white image
representation, the technique generates a multipar-
ameter image, and as is the case with all multiparameter
imaging systems there is a serious problem associated
with processing and displaying the image in a way that'
is easily interpretable by a human observer. A common
technique is to use the image input parameters to gen-
erate a false-color or pseudocolor image for final display.
As an example, multispectral scanner data are often
used to generate false-color displays for the purpose of
enhancing the visibility of certain features in a scene.
However, as recently discussed by Buchanan and Pen-
dergrass,7 considerable care needs to be taken with re-
spect to the transformation used in generating the color
display, or the results will be almost unintelligible to an
observer.
The purpose of this paper is to show that one can
define a unique and invertible transformation between
the measured polarization parameters for each pixel and
the HVS perception space in such a way as to make the
resulting display both intelligible and amenable to
quantitative performance evaluation. The transfor-
mations to be presented utilize the HVS perception
space model developed recently by Faugeras8 for
treating the problem of digital color image processing.
Section II consists of a brief review of the Stokes vector
formalism, as used in this work, and a description of the
simple single-parameter polarization imaging tech-
niques. Section III introduces the Stokes vector
imaging system together with several useful transfor-
mations between the Stokes parameter space and the
HVS perception space. Some methods of evaluating
the system performance characteristics are.discussed
in Sec. IV, along with methods for removing the effects
of degradation due to atmospheric scattering. A dis-
cussion of some applications of polarization imaging to
remote sensing of planetary surfaces and observational
astronomy
is presented
in Sec. V.
11. Stokes Vector and Single-Parameter Imaging
A brief examination of the literature on the polar-
ization characteristics of optical fields reveals a be-
wildering variety of representations and mathematical
formalisms which have been introduced over the years
to treat various classes of problems. 9 The most general,
and most widely used, formalism is based on the Stokes
parameter representation of a propagating electro-
magnetic wave (or ensemble of such waves) together
with the so-called Mueller matrix which is used to
characterize the properties of a scattering body. The
four Stokes parameters are commonly arranged as a
four-component column vector, [S0 ,S1,S2,S 3]T, so that
the relation between an incident and scattered pencil
of light may be written as
1538
APPLIED OPTICS / Vol. 20, No. 9 / 1 May 1981
where M is the 4 X 4 Mueller matrix. In practice the
scattering matrix introduced by Chandrasekhar
is
more appropriate to the calculations required to eval-
uate the performance of a polarization imaging system.
The Stokes parameters may be defined both opera-
tionally in terms of measured quantities and theoreti-
cally in terms of the field amplitudes E, and Ey of the
two orthogonal components of the electric field vector
in a local coordinate plane perpendicular to the propa-
gation direction and the phase angle y between E. and
Ey. The notation to be used here is as follows:
So = (E') + (E2 ,
S1 = (E)
-(E2),
S 2 = 2(EEEy cosy),
S3 = 2(ExEy siny),
where the angle brackets indicate time average values,
and we have not shown the time dependence of the field
quantities explicitly. Following the discussion of
Clarke and Grainger,11 the first three parameters can
be determined by three measurements utilizing a single
linear polarizer. If the polarizer axis is set at an angle
c with respect to the local x axis, the transmitted in-
tensity will be
I(a) = (E2) cos2 a + (Ey sin 2a + (EXEy cosy) sin2a,
(3)
which may be put into the form
I(a) = 2SO + 1/2S, cos2ca + 1/2S 2 sin2a.
(4)
From Eq. (4) it is clear that a set of measurements at
three different values of a is sufficient to determine S0,
S1 , and S2. One further measurement, with a retarding
element, is necessary to determine S3; however, in what
follows only the subset of parameters (SO, Si, S2) will
be used for the purpose of image construction. There
are several other quantities, derivable from the Stokes
parameters, that are commonly used to characterize the
polarization properties of an optical field, and they are
listed here for reference:
degree of polarization: P
(SP + S2 + S3)1 2
So
(5)
(since the effect of S 3 is being ignored, it will be taken
as S 3 = 0)
polarization factor: P' = S/So,
(6)
azimuthal angle:
(7)
Here the azimuthal angle refers to the angle made by the
polarization ellipse semimajor axis with the local x
axis.
tan2 = S 2/S1.
The basic idea of a single-parameter polarization
imaging involves a simple 1-D mapping from one of the
parameters (P, P, or 0) to the intensity of a mono-
chrome display. For example, denoting by Id (xy) the
intensity of a displayed pixel at the spatial coordinates
x and y, a degree of polarization
image might be repre-
sented by
Id (y) = a + bP(x,y),
(8)
where P(x,y) is the measured degree of polarization for
the corresponding pixel. Two features of the single-
parameter technique are immediately apparent. First,
�
the range of image parameter values is zero to one for
the P image, -1 to +1 for the P' image, and zero to 7r for
the 0 image. Second, and more important, is the fact
that in both the P image and the P' image each pixel is
normalized by the local total intensity SO, with the result
that scenes have the appearance of being uniformly il-
luminated. This should have the effect of significantly
reducing the detrimental effects of glare in brightly il-
luminated scenes, e.g., sun glint from ocean surfaces.
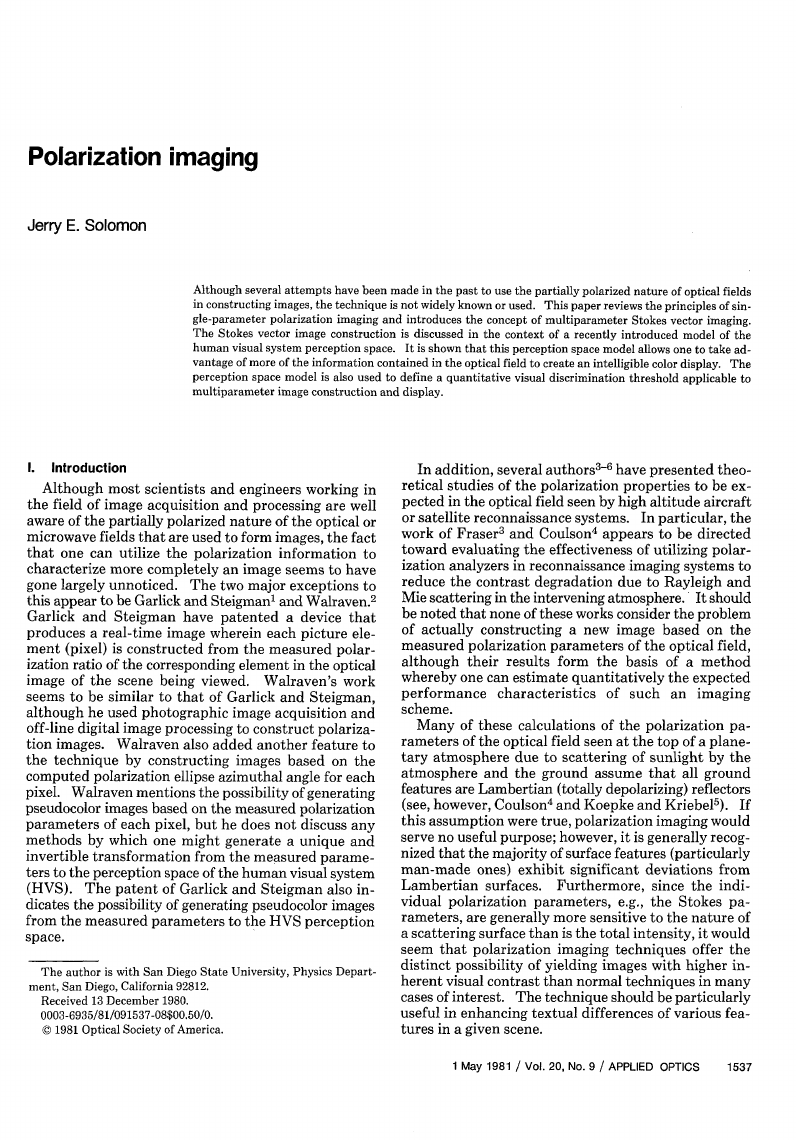
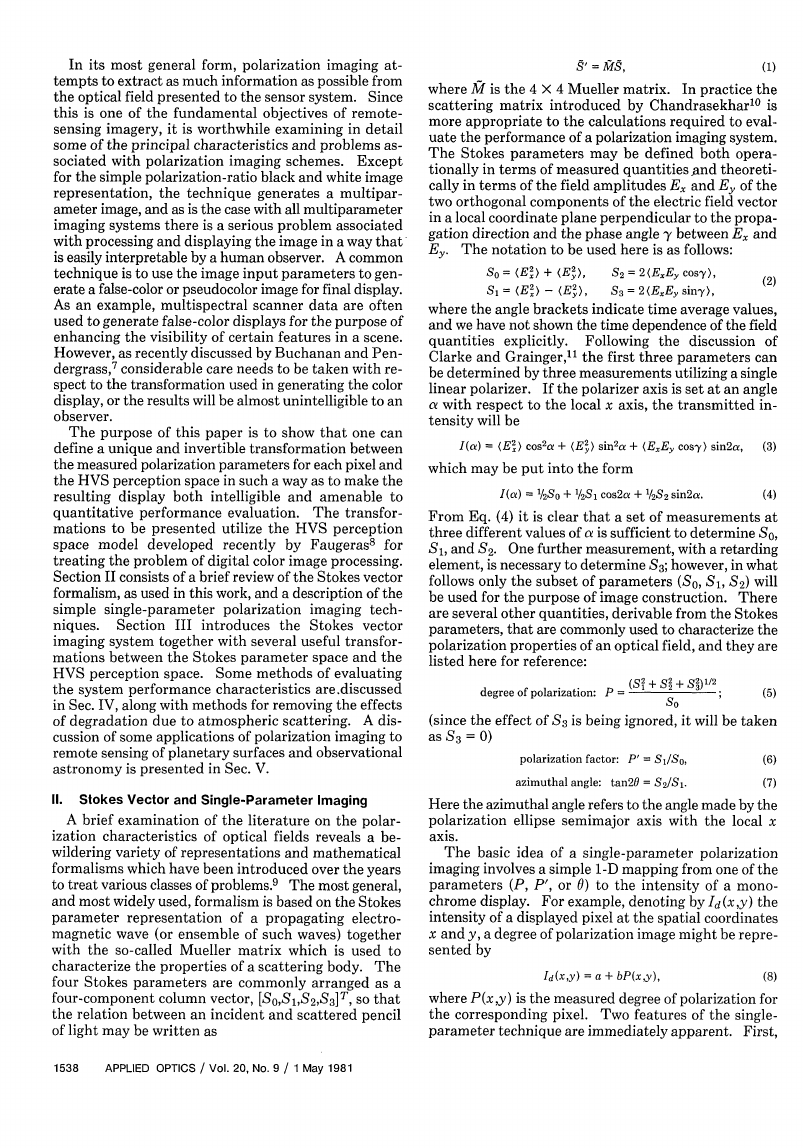
Figures 1 and 2 illustrate in block-diagram form two
basic approaches to the single-parameter polarization
imaging technique. Figure 1 is representative of the
approach taken by Garlick and Steigman,' while Fig.
2 represents, in a general way, the technique used by
Walraven.2 All the systems to be discussed in this ar-
ticle assume that provisions are made to obtain preci-
sion image registration.
In both figures, px and py
denote linear polarizers oriented orthogonal to one
another, and in Fig. 2, p< denotes a linear polarizer
oriented at 450 with respect to both px and py. The
intensities in a given pixel as measured through Px, Py,
and p < will be denoted by I, ly, and I<, respectively.
Using Eq. (4) it is possible to write the pixel Stokes
parameters as
So(x,y) = IX(XY) + Iy(x,y)
S(x,y) = IX(XY) - Iy(x,y)
S2(x,Y) = 21<(xy) - Ix(xy)
- Iy(x,y)
(9)
Thus the scheme of Fig. 1 allows a determination of
P'(x,y), while that of Fig. 2 generates So(x,y), SI(x,y),
S2(x ,y). It should be pointed out that the techniques
described by Walraven generated either P images of 0
images and that the available information was not
combined to generate a single multiparameter image.
The resulting image parameters generated by these
methods may be summarized by
P~~)=[SI(X,y) + S2(X,y)112
P(XY
So)xy)='(10)
P'(Xy)
Si(x,Y)
so(x ,y)
O(x,y) = 1/2 tan-
[S 2(XY)
s i(x~y) JI12
(11)
(12)
With respect to the polarization factor defined in Eq.
(6) it should be pointed out that this quantity does not
provide a quantitative measure of the degree of polar-
ization of a given element in the scene. Since So(x,y)
and S1 (xy) are measured in a set of coordinates that are
arbitrarily oriented with respect to the incident elec-
tromagnetic
field, one would require knowledge of the
actual orientation of the plane of polarization to de-
termine the degree of polarization. The plane of po-
larization information is correctly accounted for in Eq.
(5) and of course requires independent measurement
of three intensities.12 However, in the context of image
construction, where it is desired to utilize polarization
characteristics to enhance feature discrimination, the
use of the polarization factor can, in some cases, lead to
a significant contrast enhancement. A serious disad-
U Camera
Px
py
Ix
_LYT $ ;Unit
Arithmetic
P Monochrome
Display
Fig. 1. Block diagram of polarization ratio imaging scheme with
monochrome display.
ty Arithmetic or monochrome
PinfJ Ca
Pa
Fig. 2. Block diagram of single-parameter
polarization
imaging
scheme based on measurement of the Stokes parameter.
vantage of the polarization factor scheme is that the
available feature discrimination and contrast en-
hancement will be a function of the sensor orientation
about an axis perpendicular to the sensor plane.
Imaging schemes based on the degree of polarization,
Eq. (5), will not exhibit this type of orientation depen-
dency.
An important quantity in evaluating the expected
performance of remote-sensing imaging systems is the
apparent contrast, defined by3
C = (It -I01/b,
(13)
where It and lb are the apparent specific intensities in
the direction of the target feature and the background,
respectively. As pointed out by Fraser3 and Coulson,4
the methods introduced by Chandrasekhar1l' may be
used to calculate C, both for the total intensity and for
each Stokes component. Obviously for the cases being
considered here this definition must be modified
somewhat, since our image is not being constructed
directly with the total intensity. However, it is conve-
nient to have a definition analogous to Eq. (13) based
on the appropriate
involved in con-
structing the display. Thus letting g(x ,y) represent a
general image parameter, an apparent contrast in the
parameter domain may be defined by
image parameter
-
b)//b.
C = (t
(14)
It should be pointed out that in general this is not the
same as the visual contrast that will be seen in the dis-
played image unless the transformation used in going
from g(x,y) to Id (x,y) is a simple multiplicative one.
Furthermore, this quantity is being used to define what
is essentially the contrast in the original image, which
will presumably be digitized. Once the digitized image
is obtained we are free to apply a number of contrast
enhancement
techniques commonly employed in digital
image processing. Because each Stokes parameter
must be separately calculated and then used to compute
1 May 1981 / Vol. 20, No. 9 / APPLIED OPTICS
1539
�
the appropriate g(xy), the evaluation of Eq. (14) is
somewhat tedious but just as straightforward as eval-
uating Eq. (13). Further discussion of evaluating the
apparent contrast will be deferred to Sec. V, where it
appears in the context of a multiparameter Stokes
vector image.
Ill. Stokes Vector Image
The final step in taking advantage of almost all the
information present in optical field at the sensor is an
extension of the concept shown in Fig. 2, and embodied
in the relations shown in Eq. (9), to a multiparameter
imaging system. Specifically, it is proposed that each
pixel be associated with its measured Stokes vector
[SO(xy), Sl(x,y), S2(x,y)]T and then mapped directly
to the parameters appropriate to the HVS perception
space of brightness, hue, and saturation.7 8 As pointed
out in Sec. I, the mapping must be done in such a way
as to enhance physically significant information and
allow quantitative evaluation of expected performance.
This section is devoted to presenting several such
transformations and their properties in the context of
the Faugeras model of the HVS perception space. It
should be mentioned here that a previous attempt to
generate color displays from polarization data13 yielded
results that were apparently inconsistent and almost
impossible to interpret. This is most likely because the
data (which was not the Stokes vector) were mapped
directly to (R,G,B) space, and this is often disastrous
in terms of interpretability of the final display. The
presentation begins with a review of some of the fun-
damentals of the Faugeras model.
The model starts with the three stimuli generated by
light absorption in the three cone types:
L(x,y) = f (xy,X)1(X)dX
M(x,y) = f I(x,y,X)m(X)dX
,
S(x,y) =
I(x,y,X)s(X)dX
(15)
where I(x,y,X) indicates the spatial and wavelength
dependence of intensity in the image, and (X), m(X),
and s () denote the spectral response functions of the
three cone types. For consistency, we have retained the
notation of Faugeras. Based on neurophysiological
evidence for the existence of separate achromatic and
chromatic channels in the HVS, the perceptual pa-
rameters of achromatic response, and chromatic re-
sponse are modeled mathematically as
A = a(cL* + M* + S*)
C = u(L* - M*)
C2 = 2(L* - S*)
.(16)
with
S*
logS,
L* = logL,
M* = logM,
(17)
representing the well-established logarithmic cone re-
sponse to the intensity of stimuli. It should be noted
that the tristimulus values denoted by (L,M,S) corre-
spond closely to the standard (X, Y,Z) CIE tristimulus
value notation, the different notation being used to
prevent confusion with spatial variables. The values
1540
APPLIED OPTICS / Vol. 20, No. 9 / 1 May 1981
,0
Cp/
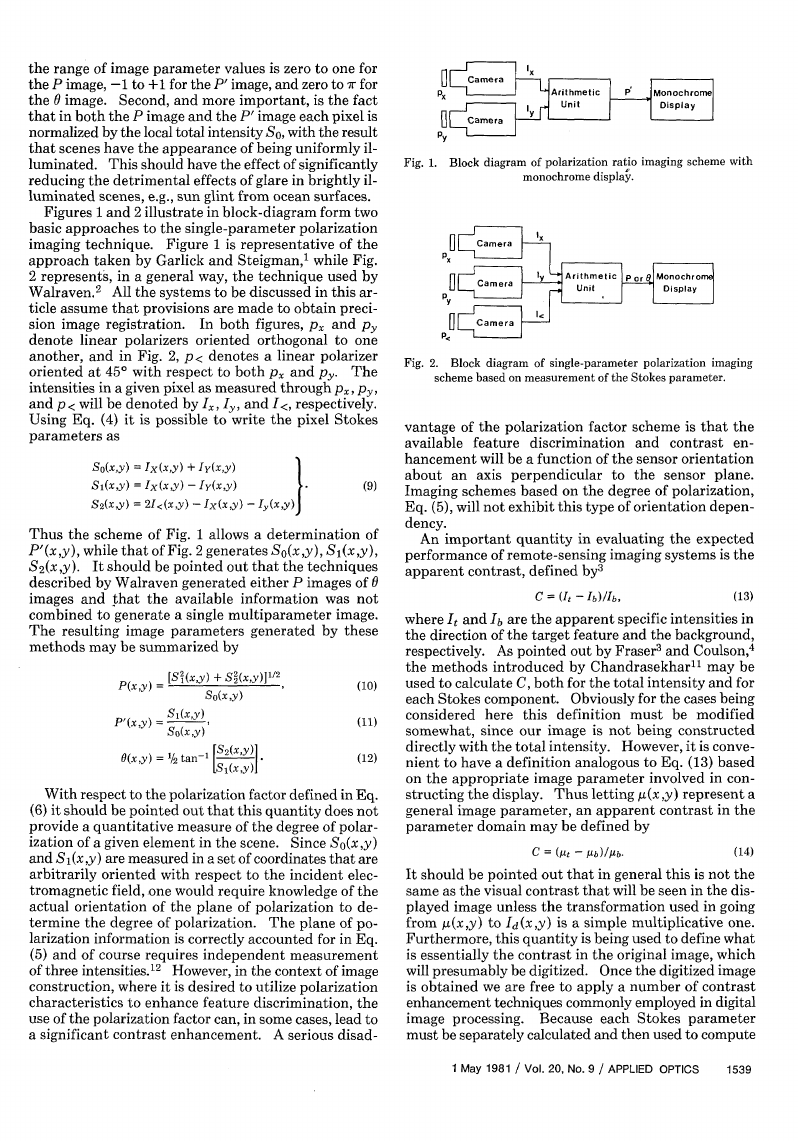
Illustration of the perception space model of Faugeras, 8
showing the visual discrimination properties of this space.
Fig. 3.
obtained for the parameters a,o,-y by Faugeras were a
= 0.612, 0 = 0.369, and y 0.019 with a + /3+ y = 1.
Equations (16) and (17) provide a (nonlinear) map-
ping from tristimulus space (L,M,S) to perception space
(A,C1,C2 ) i such a way that any color Q associated with
a tristimulus vector T = [L,M,S] T can also be associated
with a perceptual vector P = [AC,C 2 T. The signifi-
cance of the (A,C1,C2) space may be seen by an exami-
nation of Fig. 3. Parameter A measures image bright-
ness (achromatic response), while the chromatic re-
sponse parameters Cl and C2 determine hue and satu-
ration as noted in the figure. One important feature of
this model is that an appropriate choice of the constants
a, ul, and U2 makes (AC1,C 2) space a uniform percep-
tual space in the sense that for any point in the space,
the locus of points representing a noticeable difference
in perception is a sphere of unit radius centered at that
point.8" 4 This is an extremely valuable feature when
one is attempting to quantify the expected performance
characteristics of a given imaging-display scheme. The
way in which A,C1, and C 2 are defined results in the
point (0,0,0) corresponding to neutral gray, with in-
creasing positive values of A corresponding to increasing
brightness.
If one is interested in utilizing the properties of
(A,C1,C2 ) space for image construction or processing,
Eqs. (16) and (17) must be inverted to yield the appro-
priate transformation from (A,C1,C2) to the display
space. For example, if the final results are to be dis-
played on a high-resolution color TV monitor, the dis-
play primaries are the NTSC display primaries
(RnG,,Bn) and the transformations
are given by
FRn
][
1.910 -0.533 -0.288
-0.985
L 0.058 -0.118
[ L 1
M
I
0.896 I L S _
2.000 -0.028
=
G.
B _
with
L =exp(-+-C
~a ul
-
C,
U2 ~
M expA
a
S = expA
(a' y a) C + C ]
1
U2
|+-0C,-
a ul
(a +0) C
U2
I
(18)
(19)
�
The transformation matrix is the standard transfor-
mation from (X,Y,Z) to (RnGnBn).
A word of caution regarding the mathematical
properties of the various spaces used here and trans-
formations between them is probably in order at this
point. It should be remembered that (A,C1,C2) space
is a mathematical model intended to represent the
perception processes of the HVS. As constructed, it
appears to define a 3-D Euclidean vector space; how-
ever, this (A,C1 ,C2 ) space is a finite bounded space, and
thus measures in this space may not conform to the
usual Euclidean norm. This point is discussed briefly
by Faugeras.8 Furthermore, the transformation de-
fined by Eq. (21) should be used with care since the color
space defined by (R,,GflBZ) is only a (warped) sub-
space of that defined by (A,C1,C2). Put another way,
we may say that although it is possible to map every
point of (R,,GB,)
into (L,M,S), and thus into
(A,C1,C2), the converse is not true. This is simply be-
cause the R,,G,,Bn primaries are inadequate for con-
structing the entire range of color perceivable by a
human observer.
With this model of the HVS perception space, we now
return to the problem of creating an appropriate display
format for a Stokes vector image. Recalling that the
problem is defined by requiring that the polarization
characteristics of each pixel map into color space in such
a way that the various features in the resulting display
are easily interpretable, the appropriate representation
is a natural choice of
So -A,
S1 - C1,
(20)
With this choice, it can be seen from Fig. 3 that the hue
of a given pixel is determined by 0, and the saturation
is proportional to the degree of polarization. Thus
S 2- C2 .
(hue) X = 20 = tan-l(S 2/Sl)
(saturation) p = (SI + S) 1' 2
(21)
Since we are interested here primarily
in feature
discrimination by polarization characteristics, we will
take one more step and normalize the (S0,S1,S2) coor-
dinates by dividing each by So, i.e., (S0,S1,S2) ->
(1,
S1/8O, S2/SO). In the final form of the Stokes vector
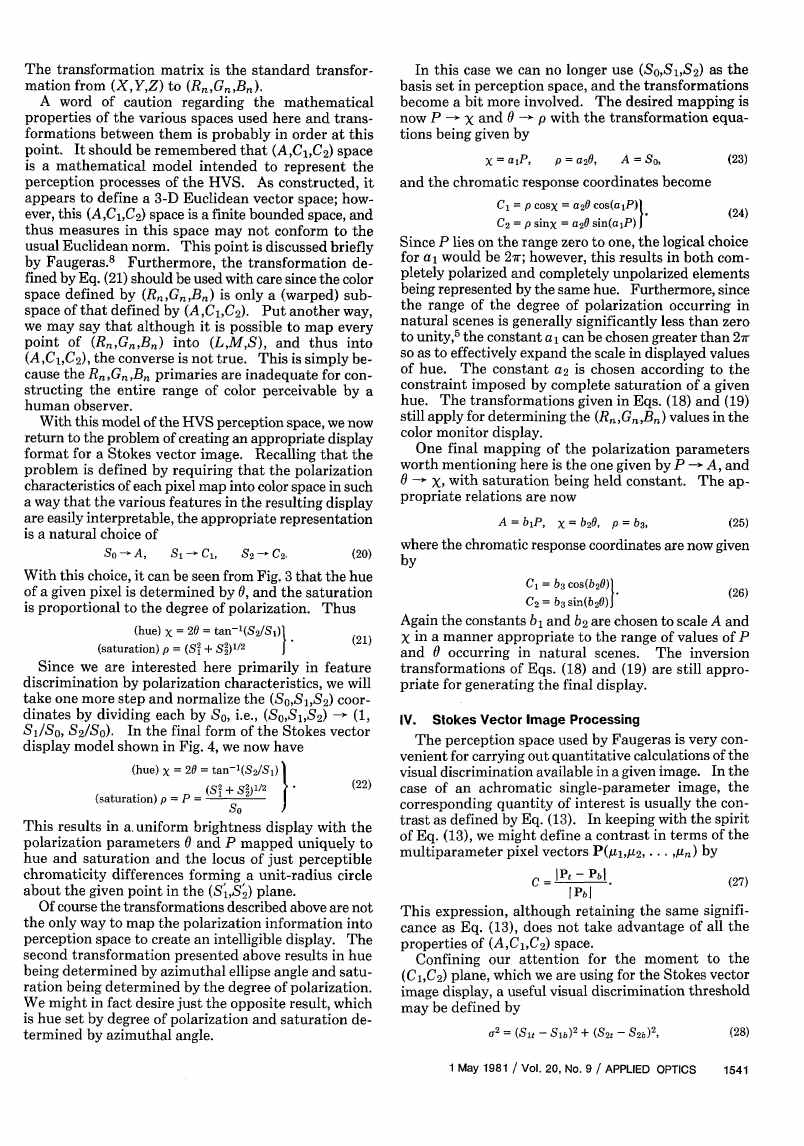
display model shown in Fig. 4, we now have
(hue) x = 20 = tan-'(S 2/Sl)
(saturation)
=
= (S1 + Sl)112
1}.
So
(22)
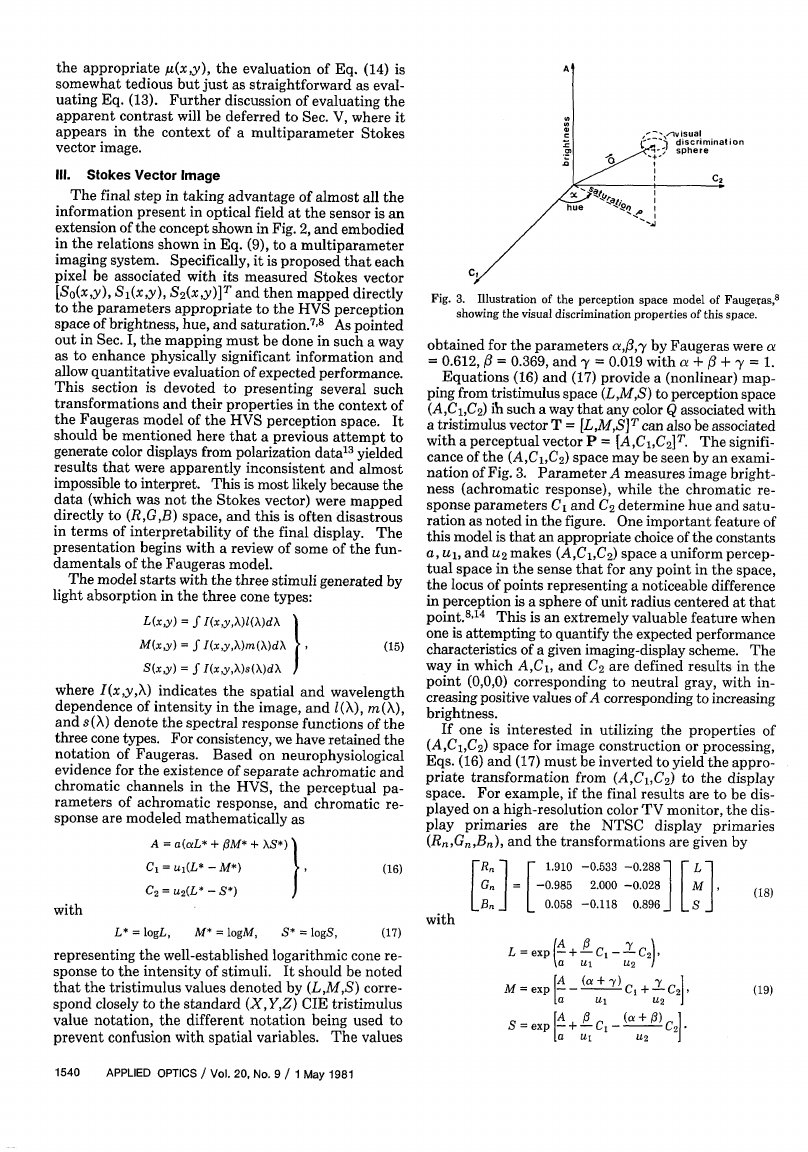
This results in a uniform brightness display with the
polarization parameters 0 and P mapped uniquely to
hue and saturation and the locus of just perceptible
chromaticity differences forming a unit-radius circle
about the given point in the (S,S) plane.
Of course the transformations described above are not
the only way to map the polarization information into
perception space to create an intelligible display. The
second transformation presented above results in hue
being determined by azimuthal ellipse angle and satu-
ration being determined by the degree of polarization.
We might in fact desire just the opposite result, which
is hue set by degree of polarization and saturation de-
termined by azimuthal angle.
In this case we can no longer use (S0,S1,S2) as the
basis set in perception space, and the transformations
become a bit more involved. The desired mapping is
now P - X and 0 - p with the transformation equa-
tions being given by
X = a1P,
p = a2 ,
A = So,
and the chromatic response coordinates become
C1 = p cosX = a20 cos(alP) 1
C2 = p sinX = a20 sin(alP) J
(23)
(24)
Since P lies on the range zero to one, the logical choice
for a1 would be 2r; however, this results in both com-
pletely polarized and completely unpolarized elements
being represented by the same hue. Furthermore, since
the range of the degree of polarization occurring in
natural scenes is generally significantly less than zero
to unity,5 the constant ai can be chosen greater than 27r
so as to effectively expand the scale in displayed values
of hue. The constant a2 is chosen according to the
constraint imposed by complete saturation of a given
hue. The transformations given in Eqs. (18) and (19)
still apply for determining the (R,,G,,,B,) values in the
color monitor display.
One final mapping of the polarization parameters
worth mentioning here is the one given by P - A, and
o - X, with saturation being held constant. The ap-
propriate relations are now
A = b1 P, X = b20,
(25)
where the chromatic response coordinates are now given
by
p = b,
C =
cos(b2 0)I
C 2 = b3 sin(b20)J
(26)
Again the constants b and b 2 are chosen to scale A and
X in a manner appropriate to the range of values of P
and
occurring in natural scenes. The inversion
transformations of Eqs. (18) and (19) are still appro-
priate for generating the final display.
IV. Stokes Vector Image Processing
The perception space used by Faugeras is very con-
venient for carrying out quantitative calculations of the
visual discrimination available in a given image. In the
case of an achromatic single-parameter image, the
corresponding quantity of interest is usually the con-
trast as defined by Eq. (13). In keeping with the spirit
of Eq. (13), we might define a contrast in terms of the
multiparameter pixel vectors P(Al,2, * . Ace) by
C =IPt - Pb,
I Pb I
(27)
This expression, although retaining the same signifi-
cance as Eq. (13), does not take advantage of all the
properties of (AC 1,C2 ) space.
Confining our attention for the moment to the
(C1,C2) plane, which we are using for the Stokes vector
image display, a useful visual discrimination threshold
may be defined by
or = (Slt - Slb)2 + (S2t - S2b)2,
(28)
1 May 1981 / Vol. 20, No. 9 / APPLIED OPTICS
1541
�
sy
Si
Fig. 4.
Illustration of a special mapping of the Stokes parameters
into perception space coordinates.
where (S1t, S20) and (Slb, S2b) are the perception space
coordinates generated by a typical target feature pixel
and background pixel, respectively (see Fig. 4). Re-
calling that just perceivable chromatic differences about
a given point (S1 ,S2 ) will be a circle of unit radius cen-
tered on that point, the criterion for a given background
is simply U2 > 1. This idea is easily extended to the
complete perception space, thus
or = (SOt - SOb)2 + (Slt - Sib)2 + (S2 t - S2b)2.
(29)
Again the visual discrimination requirement against a
given background is U2 > 1. This definition of a visual
discrimination parameter is not limited to the case of
Stokes vector imaging but could be extended to general
multiparameter image display systems. A practical
problem associated with the use of Eq. (29) is the fact
that it requires a precisely calibrated display, and the
difficulties in achieving this are definitely nontrivial.
Furthermore, due to drift in the electronics associated
with display devices, frequent recalibration would
probably be required.
Although Eq. (29) provides a useful quantitative
measure of the visibility of a particular feature in the
unprocessed image, it is reasonable to suppose that the
raw image data (S 0,S1,S 2 ) will be subjected to a series
of digital processing operations. If we consider what
might be expected in a given scene it becomes apparent
that in general the set of pixel vectors that characterize
the digitized scene will not completely cover the per-
ception space. This is analogous to the case commonly
encountered in monochrome imaging where the histo-
gram of pixel values exhibits a clustered distribution.
In such cases, which are characteristic of low-contrast
scenes, the techniques of histogram equalization and
histogram specification are often applied to improve the
scene contrast. 15" 6
In the case of Stokes vector imaging
the situation is somewhat more complicated.
Taking the transformations of Eqs. (20) and (21) as
an example we have
A = So,
p = (S2 + S2)1/2 ,
X = tan-'(S2/Sl).
(30)
Since (A,p,X) are the perceptual variables it might seem
1542
APPLIED OPTICS / Vol. 20, No. 9 / 1 May 1981
reasonable at first glance to apply stretches to A, p, and
X independently to achieve our goal of having (S0,S1,S 2 )
fill the available display space.
In general this will lead
to a distortion of the final display because p and X are
in general correlated. 1 7 To see why this is so let us ex-
amine the statistical properties of the data set
(S0 ,S1,S2). From the amplitude histograms of So, S1,
and S2 we may derive the corresponding probability
density functions (pdf) pso(so), psl(sl), and PS2 (S2).
Concentrating our attention on S, and S2 and assuming
them to be statistically uncorrelated, let us take the
simple case of ps1(si) as a zero-mean Gaussian with
variance oa and ps 2 (s2) as Gaussian with a mean of s2
and variance o2. From the inverse transformations of
Eqs. (30) and the fact that uncorrelated Gaussian ran-
dom variables are statistically independent, we arrive
at the following as the joint pfd of p and X:
P(PX) =
p
exp
27raj1r2
P2 cos2 X
2o1
[
(p sinX - s 2)2
2
(31)
The resulting expression for (p,x) shows that even in
this simple, and rather idealistic, case, p and X are cor-
related and not statistically independent.
In general
then, the stretching operations must be performed on
the So, S1, and S2 data sets assuming that they are
statistically uncorrelated.
Another problem area to be addressed is that of re-
moving the degrading effects of atmospheric scattering.
In the case of earth satellite imagery, atmospheric ef-
fects become a very serious problem in some situations,
e.g., ocean color measurements.18
In applying the
Stokes vector technique to satellite imagery one would
expect that the removal of atmospheric effects from the
data set (S0 ,S1 ,S2 ) would have to be carried out as a
matter of course. Two distinct approaches to removing
atmospheric effects can be identified based on tech-
niques currently in use.
The first approach is an extension of the method
outlined by Gordon.18 Briefly the method amounts to
removal of atmospheric scattering contributions due to
the incident solar flux by using a priori calculations of
the expected contributions due to Rayleigh and aerosol
�
(Mie) scattering. These calculations are carried out by
solving the scalar radiative transfer problem using
Monte Carlo methods and assumed scattering phase
functions for the aerosol contributions. A generaliza-
tion of this procedure would involve solving the radia-
tive transfer problem for each of the three Stokes
components of interest. The techniques for solving this
problem have been developed by Coulson,'9 Fraser,20
and Kattawar et al. 21 and are applications of the general
methods presented by Chandrasekhar.10
The second approach to the problem of atmospheric
scattering removal is based on spatial filtering tech-
niques. We begin by noting that the intensity mea-
sured in the image plane, say I, (xy), can be written
as
V. Discussion
Since measurement of the Stokes parameters of the
image field allows one to extract more information from
the image it seems reasonable to expect that Stokes
vector imaging should provide greater sensitivity in
certain areas of remote-sensing imagery. By greater
sensitivity we mean of course greater feature discrimi-
nation and identification capability. Two areas of ap-
plication immediately apparent in earth satellite im-
agery are in land resources identification and classifi-
cation and urban area identification. There has already
been some work done on the polarimetry signatures
associated with various terrestrial materials,5 '2 5 al-
though most workers have concentrated on measuring
and calculating the degree of polarization of the field at
Ix (XY) = I(')(x,y) + I(-)(x,y).
(32)
Here I()(x,y) represents the intensity due to those
photons which have been scattered (reflected) from the
earth's surface, and I(a)(x,y) represents the contribution
from photons which have scattered by the intervening
atmosphere (Rayleigh and Mie scattering).
In the case of viewing the earth's surface from satellite
altitudes, we expect I)(x,y)
to be a slowly varying
function of (x y) i.e., no sharp boundaries. On the
other hand, Ix( (xy) will in general be a rather rapidly
varying function of (xy) due to the nature of the surface
features. These observations imply that one ought to
be able to achieve a significant suppression of the
i" (x ,y) component by subjecting I (xy) to a linear
high-pass spatial filtering operation using an appro-
priate cutoff frequency. Thus the first step in the
processing operation involves generating a new pixel
intensity value by
I W (xy)
Ix(X,Y) = LlIx(xy)]
y(xy) = L[I1 (x,y)I
I<(x,y) = L[I<(x,y)]
l represents the high-pass filtering opera-
') (XY)
I(S)(xsy)
(33)
I
where L
tion.
We now have a set of pixel intensities
(J,!yj<),
which should be representative of the intensities due to
photons which have been reflected from various features
on the earth's surface. At this point is is possible to
remove degrading effects due to variations in illumi-
nation over the scene being viewed, e.g., shadowing.
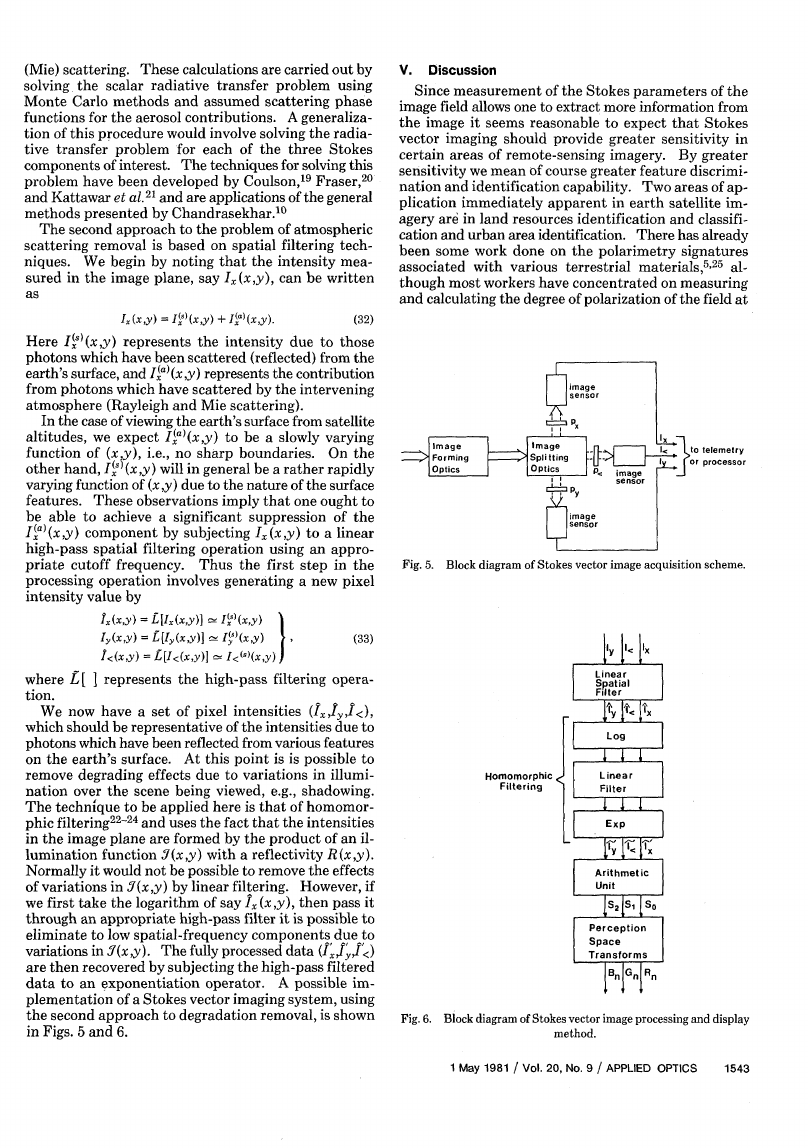
The technique to be applied here is that of homomor-
phic filtering22 -24 and uses the fact that the intensities
in the image plane are formed by the product of an il-
lumination function 31(x,y) with a reflectivity R (x,y).
Normally it would not be possible to remove the effects
of variations in 5(x,y) by linear filtering. However, if
we first take the logarithm of say A, (x ,y), then pass it
through an appropriate high-pass filter it is possible to
eliminate to low spatial-frequency components due to
variations in Y(xy). The fully processed data (ItI,/<)
are then recovered by subjecting the high-pass filtered
data to an exponentiation operator. A possible im-
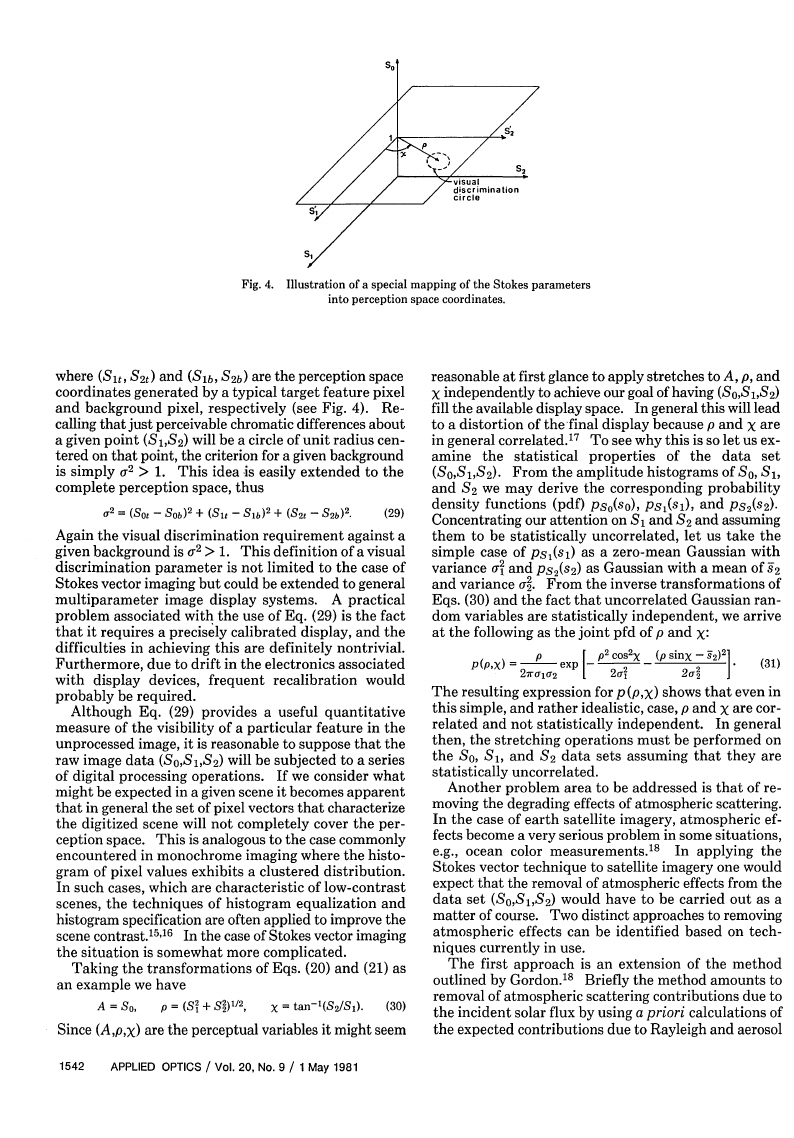
plementation of a Stokes vector imaging system, using
the second approach to degradation removal, is shown
in Figs. 5 and 6.
]> to telemetry
or processor
Fig. 5. Block diagram of Stokes vector image acquisition scheme.
Homomorphic
Filtering
Fig. 6. Block diagram of Stokes vector image processing and display
method.
1 May 1981 / Vol. 20, No. 9 / APPLIED OPTICS
1543
�
the sensor. Although the observed Stokes parameters
in the image plane are functions of illumination and
viewing geometry,
they are also of course sensitive
functions of the nature of the surface being viewed. In
particular, the Stokes parameters are sensitive to tex-
tual and composition differences of surfaces, and
therefore Stokes vector imaging should greatly enhance
one's capability of discerning urban areas surrounded
by natural terrestrial features. Furthermore, the pre-
liminary work of Egan and Hallock25 indicates that one
might also enhance the geological feature identification
capabilities of remote-sensing imagery by utilizing
Stokes.vector imaging. Although the implementation
shown in Fig. 5 indicates imaging optics common to all
three sensors, one could as easily construct a system of
three bore-sighted vidicon cameras that would accom-
plish the same result. In fact, the earth-orbiting sat-
ellites Landsat 1 and Landsat 2 both contained a system
consisting of three bore-sighted return-beam-vidicons
which were used for multispectral
imaging pur-
poses. 2 6
One other immediate application which comes to
mind is in the area of observational astronomy. Nu-
merous astronomical objects exhibit polarization fea-
tures which yield detailed information about the nature
of the object or about the nature of processes taking
place within the object. A classic example is that of the
Crab nebula, most of the radiation emitted from this
object is believed to be due to syncrotron radiation and
is found to be highly polarized. The technique of
Stokes vector imaging applied to the observation of such
objects should provide an easily interpretable display
of the polarization characteristics of the object.
An aspect of polarization imaging which has not been
discussed in this article is the wavelength dependence
of the image parameters. Since the polarization char-
acteristics of most materials change significantly over
the range from near UV to mid-IR it is to be expected
that the performance characteristics of a Stokes vector
imaging system will be different in different spectral
regions. Indeed it seems reasonable that this property
can be used to advantage in optimizing the performance
of the system with respect to identifying specific surface
features. Finally, it should be pointed out that al-
though the discussion of polarization imaging has been.
confined to considerations of optical imaging systems,
there is no reason, in principle, why the technique would
not be equally applicable to the case of active radar
imaging systems.
The author would like to express his thanks for the
time taken by Brent Baxter of the University of Utah
and Thomas G. Stockham, Jr., of Soundstream, Inc., to
discuss various aspects of the Faugeras perception space
model.
I would also like to express my appreciation to
James M. Soha of NASA Jet Propulsion Laboratory for
valuable discussions of multiparameter color display
schemes and for taking the time to comment on the
original draft of this manuscript.
1544
APPLIED OPTICS / Vol. 20, No. 9 / 1 May 1981
The author also holds an appointment at the Naval
Ocean Systems Center, San Diego, Calif.
References
1. G. F. J. Garlick and G. A. Steigman, U.K. patent 1-7-854 and U.S.
patent 3-992-571, Department of Physics, U. Hull, England.
2. R. Walraven, Proc. Soc. Photo-Opt.
Instrum. Eng. 112, 165
(1977).
3. R. S. Fraser, J. Opt. Soc. Am. 54, 289 (1964).
4. K. L. Coulson, Appl. Opt. 5, 905 (1966).
5. P. Koepke and K. T. Kriebel, Appl. Opt. 17, 260 (1978).
6. G. W. Kattawar, G. N. Plass, and J. A. Guinn, Jr., J. Phys. Ocean.
3,353 (1973).
7. M. D. Buchanan and R. Pendergrass, Electro-Opt. Syst. Des. (29
Mar. 1980).
8. 0. D. Faugeras, IEEE Trans. Acoust. Speech, Signal Process.
ASSP-27, 380 (1979).
9. An excellent discussion of these various representations
appear
in R. M. A. Assam and N. M. Bashara, Ellipsometry and Polar-
ized Light (North-Holland, Amsterdam, 1977), Chaps. 1 and 2.
(Dover, New York,
Radiative Transfer
10. S. Chandrasekhar,
1960).
11. D. Clarke and J. F. Grainger, Polarized Light and Optical Mea-
surement
(Pergamon, New York, 1971).
12. The author would like to thank an unknown reviewer for pointing
out this property of the polarization factor.
13. J. P. Millard and J. C. Arvesen, Development and Test of Video
Systems for Airborne Surveillance of Oil Spills, NASA Technical
Memorandum, NASA TM X-62, 429 (Mar. 1975).
14. 0. D. Faugeras, "Digital Color Image Processing and Psycho-
physics Within the Framework of a Human Visual Model," Ph.D.
Dissertation, U. Utah, Salt Lake City (June 1976).
15. K. R. Castleman, Digital Image Processing (Prentice-Hall, En-
glewood Cliffs, N.J., 1979), Chaps. 5 and 6.
16. R. C. Gonzalez and P. Wintz, Digital Image Processing (Addi-
son-Wesley, Reading, Mass., 1977), pp. 118-136.
17. For a discussion of the implications of correlated data sets in
pseudo-color displays see A. B. Kahle, D. P.
multiparameter
Madura, and J. M. Soha, Appl. Opt. 19, 2279 (1980).
18. H. R. Gordon, Appl. Opt. 17,1631 (1978) and references contained
therein.
19. K. L. Coulson, Planet. Space Sci. 1, 265 (1959).
20. R. S. Fraser, J. Opt. Soc. Am. 54, 157 (1964).
21. G. W. Kattawar, G. N. Plass, and S. J. Hitzfelder, Appl. Opt. 15,
632 (1976).
22. A. V. Oppenheim, R. W. Schaffer, and T. G. Stockham, Jr., IEEE
Trans. Audio Electroacoust. AU-16, 437 (1968).
23. T. G. Stockham, Jr., Proc. IEEE 60, 828 (1972).
24. R. W. Fries and J. W. Modestino, IEEE Trans. Acoust. Speech
Signal Process. ASSP-27, 625 (1979).
25. W. G. Egan and H. B. Hallock, in Proceedings, Fourth Sympo-
sium on Remote Sensing of Environment (Infrared Physics
Laboratory, U. Mich., Ann Arbor, April 1966), p.671; Proc. IEEE
57,621 (1969).
26. P. N. Slater, Remote Sensing: Optics and Optical Systems
(Addison-Wesley, Reading, Mass., 1980), pp. 468-471.
�


 2023年江西萍乡中考道德与法治真题及答案.doc
 2012年重庆南川中考生物真题及答案.doc
 2013年江西师范大学地理学综合及文艺理论基础考研真题.doc
 2020年四川甘孜小升初语文真题及答案I卷.doc
 2020年注册岩土工程师专业基础考试真题及答案.doc
 2023-2024学年福建省厦门市九年级上学期数学月考试题及答案.doc
 2021-2022学年辽宁省沈阳市大东区九年级上学期语文期末试题及答案.doc
 2022-2023学年北京东城区初三第一学期物理期末试卷及答案.doc
 2018上半年江西教师资格初中地理学科知识与教学能力真题及答案.doc
 2012年河北国家公务员申论考试真题及答案-省级.doc
 2020-2021学年江苏省扬州市江都区邵樊片九年级上学期数学第一次质量检测试题及答案.doc
 2022下半年黑龙江教师资格证中学综合素质真题及答案.doc