To the Shareholders of Berkshire Hathaway Inc.:
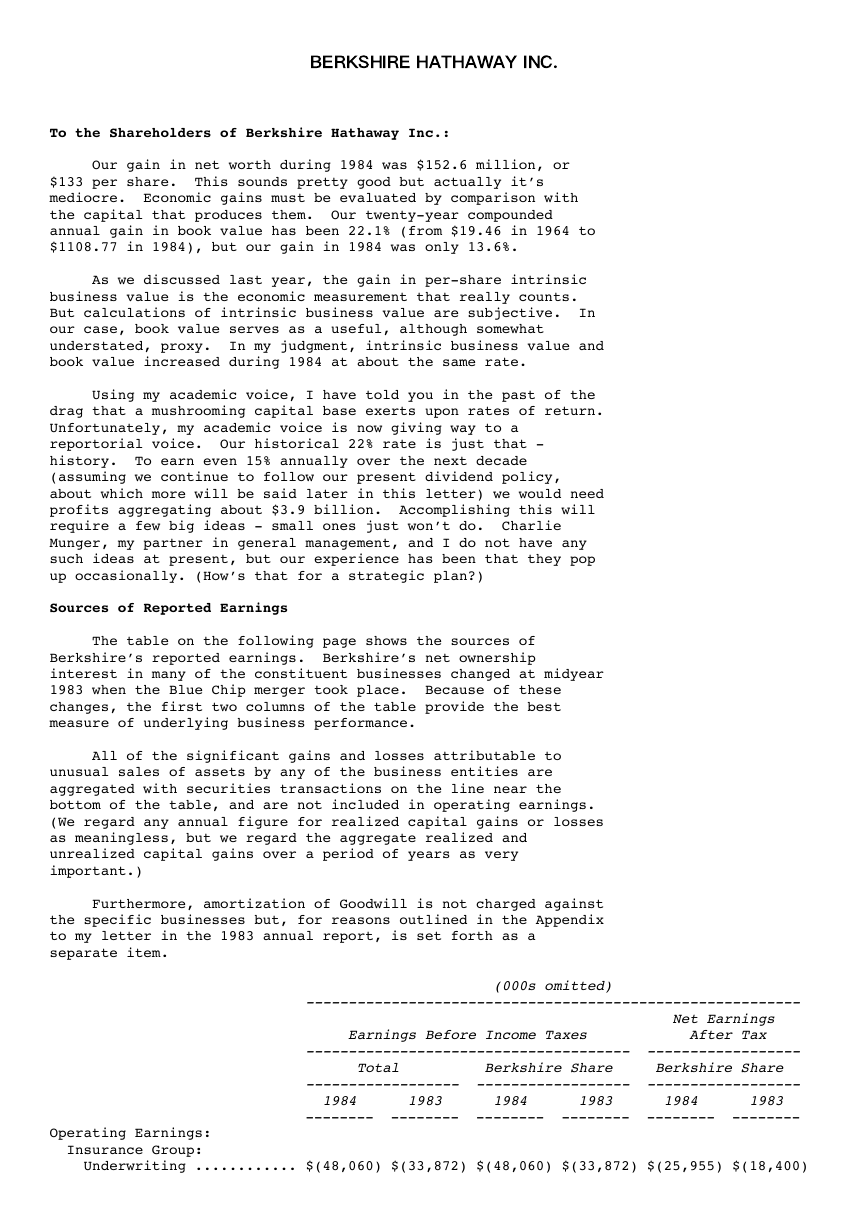
Our gain in net worth during 1984 was $152.6 million, or
$133 per share. This sounds pretty good but actually it’s
mediocre. Economic gains must be evaluated by comparison with
the capital that produces them. Our twenty-year compounded
annual gain in book value has been 22.1% (from $19.46 in 1964 to
$1108.77 in 1984), but our gain in 1984 was only 13.6%.
As we discussed last year, the gain in per-share intrinsic
business value is the economic measurement that really counts.
But calculations of intrinsic business value are subjective. In
our case, book value serves as a useful, although somewhat
understated, proxy. In my judgment, intrinsic business value and
book value increased during 1984 at about the same rate.
Using my academic voice, I have told you in the past of the
drag that a mushrooming capital base exerts upon rates of return.
Unfortunately, my academic voice is now giving way to a
reportorial voice. Our historical 22% rate is just that -
history. To earn even 15% annually over the next decade
(assuming we continue to follow our present dividend policy,
about which more will be said later in this letter) we would need
profits aggregating about $3.9 billion. Accomplishing this will
require a few big ideas - small ones just won’t do. Charlie
Munger, my partner in general management, and I do not have any
such ideas at present, but our experience has been that they pop
up occasionally. (How’s that for a strategic plan?)
Sources of Reported Earnings
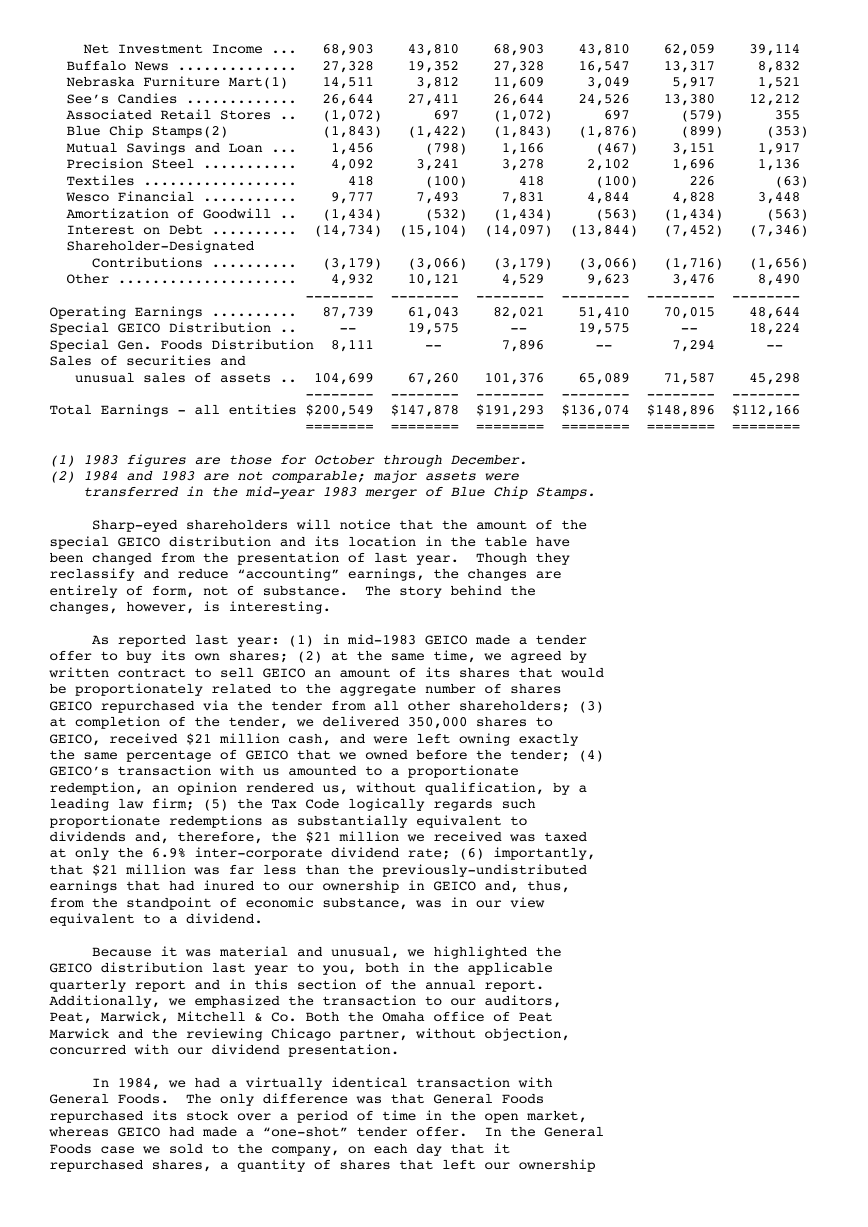
The table on the following page shows the sources of
Berkshire’s reported earnings. Berkshire’s net ownership
interest in many of the constituent businesses changed at midyear
1983 when the Blue Chip merger took place. Because of these
changes, the first two columns of the table provide the best
measure of underlying business performance.
All of the significant gains and losses attributable to
unusual sales of assets by any of the business entities are
aggregated with securities transactions on the line near the
bottom of the table, and are not included in operating earnings.
(We regard any annual figure for realized capital gains or losses
as meaningless, but we regard the aggregate realized and
unrealized capital gains over a period of years as very
important.)
Furthermore, amortization of Goodwill is not charged against
the specific businesses but, for reasons outlined in the Appendix
to my letter in the 1983 annual report, is set forth as a
separate item.
(000s omitted)
----------------------------------------------------------
Net Earnings
Earnings Before Income Taxes After Tax
-------------------------------------- ------------------
Total Berkshire Share Berkshire Share
------------------ ------------------ ------------------
1984 1983 1984 1983 1984 1983
-------- -------- -------- -------- -------- --------
Operating Earnings:
Insurance Group:
Underwriting ............ $(48,060) $(33,872) $(48,060) $(33,872) $(25,955) $(18,400)
B
E
R
K
S
H
I
R
E
H
A
T
H
A
W
A
Y
I
N
C
.
�
Net Investment Income ... 68,903 43,810 68,903 43,810 62,059 39,114
Buffalo News .............. 27,328 19,352 27,328 16,547 13,317 8,832
Nebraska Furniture Mart(1) 14,511 3,812 11,609 3,049 5,917 1,521
See’s Candies ............. 26,644 27,411 26,644 24,526 13,380 12,212
Associated Retail Stores .. (1,072) 697 (1,072) 697 (579) 355
Blue Chip Stamps(2) (1,843) (1,422) (1,843) (1,876) (899) (353)
Mutual Savings and Loan ... 1,456 (798) 1,166 (467) 3,151 1,917
Precision Steel ........... 4,092 3,241 3,278 2,102 1,696 1,136
Textiles .................. 418 (100) 418 (100) 226 (63)
Wesco Financial ........... 9,777 7,493 7,831 4,844 4,828 3,448
Amortization of Goodwill .. (1,434) (532) (1,434) (563) (1,434) (563)
Interest on Debt .......... (14,734) (15,104) (14,097) (13,844) (7,452) (7,346)
Shareholder-Designated
Contributions .......... (3,179) (3,066) (3,179) (3,066) (1,716) (1,656)
Other ..................... 4,932 10,121 4,529 9,623 3,476 8,490
-------- -------- -------- -------- -------- --------
Operating Earnings .......... 87,739 61,043 82,021 51,410 70,015 48,644
Special GEICO Distribution .. -- 19,575 -- 19,575 -- 18,224
Special Gen. Foods Distribution 8,111 -- 7,896 -- 7,294 --
Sales of securities and
unusual sales of assets .. 104,699 67,260 101,376 65,089 71,587 45,298
-------- -------- -------- -------- -------- --------
Total Earnings - all entities $200,549 $147,878 $191,293 $136,074 $148,896 $112,166
======== ======== ======== ======== ======== ========
(1) 1983 figures are those for October through December.
(2) 1984 and 1983 are not comparable; major assets were
transferred in the mid-year 1983 merger of Blue Chip Stamps.
Sharp-eyed shareholders will notice that the amount of the
special GEICO distribution and its location in the table have
been changed from the presentation of last year. Though they
reclassify and reduce “accounting” earnings, the changes are
entirely of form, not of substance. The story behind the
changes, however, is interesting.
As reported last year: (1) in mid-1983 GEICO made a tender
offer to buy its own shares; (2) at the same time, we agreed by
written contract to sell GEICO an amount of its shares that would
be proportionately related to the aggregate number of shares
GEICO repurchased via the tender from all other shareholders; (3)
at completion of the tender, we delivered 350,000 shares to
GEICO, received $21 million cash, and were left owning exactly
the same percentage of GEICO that we owned before the tender; (4)
GEICO’s transaction with us amounted to a proportionate
redemption, an opinion rendered us, without qualification, by a
leading law firm; (5) the Tax Code logically regards such
proportionate redemptions as substantially equivalent to
dividends and, therefore, the $21 million we received was taxed
at only the 6.9% inter-corporate dividend rate; (6) importantly,
that $21 million was far less than the previously-undistributed
earnings that had inured to our ownership in GEICO and, thus,
from the standpoint of economic substance, was in our view
equivalent to a dividend.
Because it was material and unusual, we highlighted the
GEICO distribution last year to you, both in the applicable
quarterly report and in this section of the annual report.
Additionally, we emphasized the transaction to our auditors,
Peat, Marwick, Mitchell & Co. Both the Omaha office of Peat
Marwick and the reviewing Chicago partner, without objection,
concurred with our dividend presentation.
In 1984, we had a virtually identical transaction with
General Foods. The only difference was that General Foods
repurchased its stock over a period of time in the open market,
whereas GEICO had made a “one-shot” tender offer. In the General
Foods case we sold to the company, on each day that it
repurchased shares, a quantity of shares that left our ownership
�
percentage precisely unchanged. Again our transaction was
pursuant to a written contract executed before repurchases began.
And again the money we received was far less than the retained
earnings that had inured to our ownership interest since our
purchase. Overall we received $21,843,601 in cash from General
Foods, and our ownership remained at exactly 8.75%.
At this point the New York office of Peat Marwick came into
the picture. Late in 1984 it indicated that it disagreed with
the conclusions of the firm’s Omaha office and Chicago reviewing
partner. The New York view was that the GEICO and General Foods
transactions should be treated as sales of stock by Berkshire
rather than as the receipt of dividends. Under this accounting
approach, a portion of the cost of our investment in the stock of
each company would be charged against the redemption payment and
any gain would be shown as a capital gain, not as dividend
income. This is an accounting approach only, having no bearing
on taxes: Peat Marwick agrees that the transactions were
dividends for IRS purposes.
We disagree with the New York position from both the
viewpoint of economic substance and proper accounting. But, to
avoid a qualified auditor’s opinion, we have adopted herein Peat
Marwick’s 1984 view and restated 1983 accordingly. None of this,
however, has any effect on intrinsic business value: our
ownership interests in GEICO and General Foods, our cash, our
taxes, and the market value and tax basis of our holdings all
remain the same.
This year we have again entered into a contract with General
Foods whereby we will sell them shares concurrently with open
market purchases that they make. The arrangement provides that
our ownership interest will remain unchanged at all times. By
keeping it so, we will insure ourselves dividend treatment for
tax purposes. In our view also, the economic substance of this
transaction again is the creation of dividend income. However,
we will account for the redemptions as sales of stock rather than
dividend income unless accounting rules are adopted that speak
directly to this point. We will continue to prominently identify
any such special transactions in our reports to you.
While we enjoy a low tax charge on these proportionate
redemptions, and have participated in several of them, we view
such repurchases as at least equally favorable for shareholders
who do not sell. When companies with outstanding businesses and
comfortable financial positions find their shares selling far
below intrinsic value in the marketplace, no alternative action
can benefit shareholders as surely as repurchases.
(Our endorsement of repurchases is limited to those dictated
by price/value relationships and does not extend to the
“greenmail” repurchase - a practice we find odious and repugnant.
In these transactions, two parties achieve their personal ends by
exploitation of an innocent and unconsulted third party. The
players are: (1) the “shareholder” extortionist who, even before
the ink on his stock certificate dries, delivers his “your-
money-or-your-life” message to managers; (2) the corporate
insiders who quickly seek peace at any price - as long as the
price is paid by someone else; and (3) the shareholders whose
money is used by (2) to make (1) go away. As the dust settles,
the mugging, transient shareholder gives his speech on “free
enterprise”, the muggee management gives its speech on “the best
interests of the company”, and the innocent shareholder standing
by mutely funds the payoff.)
The companies in which we have our largest investments have
all engaged in significant stock repurhases at times when wide
discrepancies existed between price and value. As shareholders,
we find this encouraging and rewarding for two important reasons
�
- one that is obvious, and one that is subtle and not always
understood. The obvious point involves basic arithmetic: major
repurchases at prices well below per-share intrinsic business
value immediately increase, in a highly significant way, that
value. When companies purchase their own stock, they often find
it easy to get $2 of present value for $1. Corporate acquisition
programs almost never do as well and, in a discouragingly large
number of cases, fail to get anything close to $1 of value for
each $1 expended.
The other benefit of repurchases is less subject to precise
measurement but can be fully as important over time. By making
repurchases when a company’s market value is well below its
business value, management clearly demonstrates that it is given
to actions that enhance the wealth of shareholders, rather than
to actions that expand management’s domain but that do nothing
for (or even harm) shareholders. Seeing this, shareholders and
potential shareholders increase their estimates of future returns
from the business. This upward revision, in turn, produces
market prices more in line with intrinsic business value. These
prices are entirely rational. Investors should pay more for a
business that is lodged in the hands of a manager with
demonstrated pro-shareholder leanings than for one in the hands
of a self-interested manager marching to a different drummer. (To
make the point extreme, how much would you pay to be a minority
shareholder of a company controlled by Robert Wesco?)
The key word is “demonstrated”. A manager who consistently
turns his back on repurchases, when these clearly are in the
interests of owners, reveals more than he knows of his
motivations. No matter how often or how eloquently he mouths
some public relations-inspired phrase such as “maximizing
shareholder wealth” (this season’s favorite), the market
correctly discounts assets lodged with him. His heart is not
listening to his mouth - and, after a while, neither will the
market.
We have prospered in a very major way - as have other
shareholders - by the large share repurchases of GEICO,
Washington Post, and General Foods, our three largest holdings.
(Exxon, in which we have our fourth largest holding, has also
wisely and aggressively repurchased shares but, in this case, we
have only recently established our position.) In each of these
companies, shareholders have had their interests in outstanding
businesses materially enhanced by repurchases made at bargain
prices. We feel very comfortable owning interests in businesses
such as these that offer excellent economics combined with
shareholder-conscious managements.
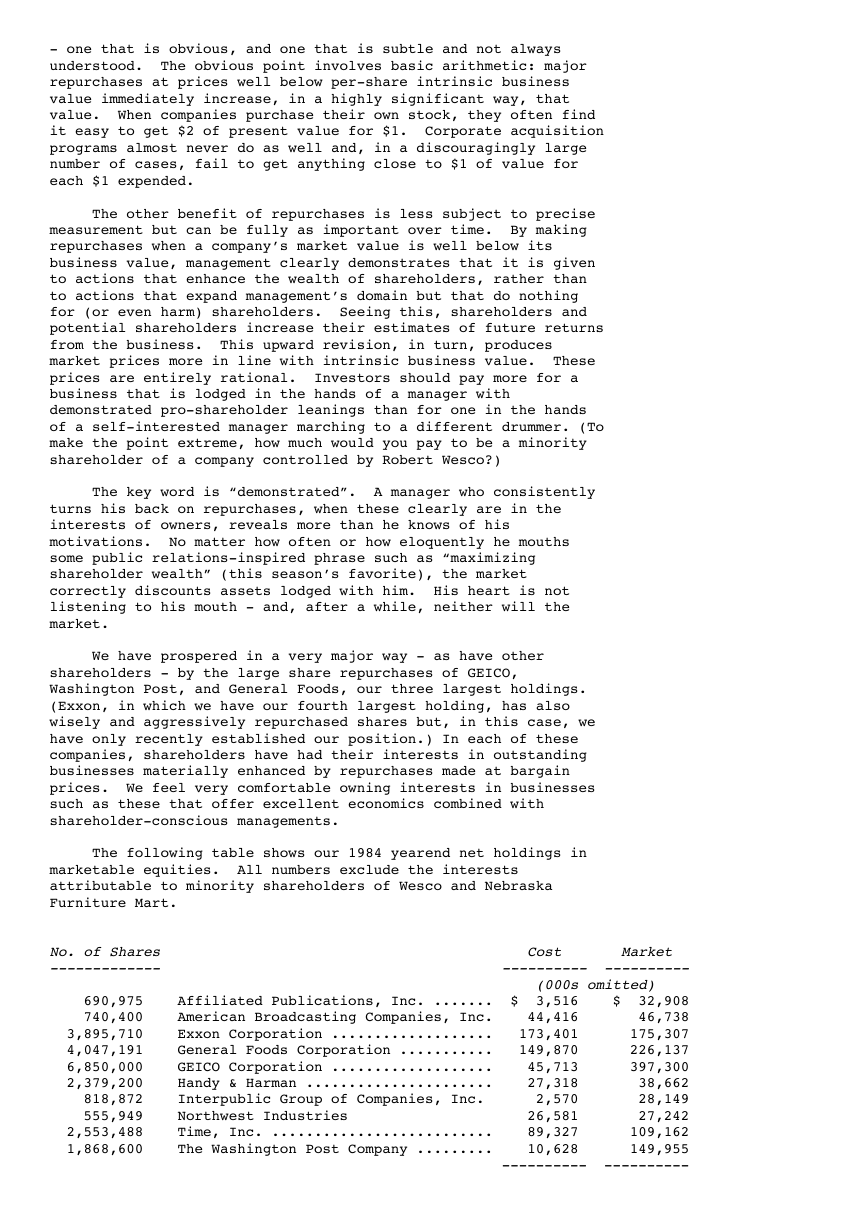
The following table shows our 1984 yearend net holdings in
marketable equities. All numbers exclude the interests
attributable to minority shareholders of Wesco and Nebraska
Furniture Mart.
No. of Shares Cost Market
------------- ---------- ----------
(000s omitted)
690,975 Affiliated Publications, Inc. ....... $ 3,516 $ 32,908
740,400 American Broadcasting Companies, Inc. 44,416 46,738
3,895,710 Exxon Corporation ................... 173,401 175,307
4,047,191 General Foods Corporation ........... 149,870 226,137
6,850,000 GEICO Corporation ................... 45,713 397,300
2,379,200 Handy & Harman ...................... 27,318 38,662
818,872 Interpublic Group of Companies, Inc. 2,570 28,149
555,949 Northwest Industries 26,581 27,242
2,553,488 Time, Inc. .......................... 89,327 109,162
1,868,600 The Washington Post Company ......... 10,628 149,955
---------- ----------
�
$573,340 $1,231,560
All Other Common Stockholdings 11,634 37,326
---------- ----------
Total Common Stocks $584,974 $1,268,886
========== ==========
It’s been over ten years since it has been as difficult as
now to find equity investments that meet both our qualitative
standards and our quantitative standards of value versus price.
We try to avoid compromise of these standards, although we find
doing nothing the most difficult task of all. (One English
statesman attributed his country’s greatness in the nineteenth
century to a policy of “masterly inactivity”. This is a strategy
that is far easier for historians to commend than for
participants to follow.)
In addition to the figures supplied at the beginning of this
section, information regarding the businesses we own appears in
Management’s Discussion on pages 42-47. An amplified discussion
of Wesco’s businesses appears in Charlie Munger’s report on pages
50-59. You will find particularly interesting his comments about
conditions in the thrift industry. Our other major controlled
businesses are Nebraska Furniture Mart, See’s, Buffalo Evening
News, and the Insurance Group, to which we will give some special
attention here.
Nebraska Furniture Mart
Last year I introduced you to Mrs. B (Rose Blumkin) and her
family. I told you they were terrific, and I understated the
case. After another year of observing their remarkable talents
and character, I can honestly say that I never have seen a
managerial group that either functions or behaves better than the
Blumkin family.
Mrs. B, Chairman of the Board, is now 91, and recently was
quoted in the local newspaper as saying, “I come home to eat and
sleep, and that’s about it. I can’t wait until it gets daylight
so I can get back to the business”. Mrs. B is at the store seven
days a week, from opening to close, and probably makes more
decisions in a day than most CEOs do in a year (better ones,
too).
In May Mrs. B was granted an Honorary Doctorate in
Commercial Science by New York University. (She’s a “fast track”
student: not one day in her life was spent in a school room prior
to her receipt of the doctorate.) Previous recipients of honorary
degrees in business from NYU include Clifton Garvin, Jr., CEO of
Exxon Corp.; Walter Wriston, then CEO of Citicorp; Frank Cary,
then CEO of IBM; Tom Murphy, then CEO of General Motors; and,
most recently, Paul Volcker. (They are in good company.)
The Blumkin blood did not run thin. Louie, Mrs. B’s son,
and his three boys, Ron, Irv, and Steve, all contribute in full
measure to NFM’s amazing success. The younger generation has
attended the best business school of them all - that conducted by
Mrs. B and Louie - and their training is evident in their
performance.
Last year NFM’s net sales increased by $14.3 million,
bringing the total to $115 million, all from the one store in
Omaha. That is by far the largest volume produced by a single
home furnishings store in the United States. In fact, the gain
in sales last year was itself greater than the annual volume of
many good-sized successful stores. The business achieves this
success because it deserves this success. A few figures will
tell you why.
In its fiscal 1984 10-K, the largest independent specialty
�
retailer of home furnishings in the country, Levitz Furniture,
described its prices as “generally lower than the prices charged
by conventional furniture stores in its trading area”. Levitz,
in that year, operated at a gross margin of 44.4% (that is, on
average, customers paid it $100 for merchandise that had cost it
$55.60 to buy). The gross margin at NFM is not much more than
half of that. NFM’s low mark-ups are possible because of its
exceptional efficiency: operating expenses (payroll, occupancy,
advertising, etc.) are about 16.5% of sales versus 35.6% at
Levitz.
None of this is in criticism of Levitz, which has a well-
managed operation. But the NFM operation is simply extraordinary
(and, remember, it all comes from a $500 investment by Mrs. B in
1937). By unparalleled efficiency and astute volume purchasing,
NFM is able to earn excellent returns on capital while saving its
customers at least $30 million annually from what, on average, it
would cost them to buy the same merchandise at stores maintaining
typical mark-ups. Such savings enable NFM to constantly widen
its geographical reach and thus to enjoy growth well beyond the
natural growth of the Omaha market.
I have been asked by a number of people just what secrets
the Blumkins bring to their business. These are not very
esoteric. All members of the family: (1) apply themselves with
an enthusiasm and energy that would make Ben Franklin and Horatio
Alger look like dropouts; (2) define with extraordinary realism
their area of special competence and act decisively on all
matters within it; (3) ignore even the most enticing propositions
failing outside of that area of special competence; and, (4)
unfailingly behave in a high-grade manner with everyone they deal
with. (Mrs. B boils it down to “sell cheap and tell the truth”.)
Our evaluation of the integrity of Mrs. B and her family was
demonstrated when we purchased 90% of the business: NFM had never
had an audit and we did not request one; we did not take an
inventory nor verify the receivables; we did not check property
titles. We gave Mrs. B a check for $55 million and she gave us
her word. That made for an even exchange.
You and I are fortunate to be in partnership with the
Blumkin family.
See’s Candy Shops, Inc.
Below is our usual recap of See’s performance since the time
of purchase by Blue Chip Stamps:
52-53 Week Year Operating Number of Number of
Ended About Sales Profits Pounds of Stores Open
December 31 Revenues After Taxes Candy Sold at Year End
------------------- ------------ ----------- ---------- -----------
1984 .............. $135,946,000 $13,380,000 24,759,000 214
1983 (53 weeks) ... 133,531,000 13,699,000 24,651,000 207
1982 .............. 123,662,000 11,875,000 24,216,000 202
1981 .............. 112,578,000 10,779,000 24,052,000 199
1980 .............. 97,715,000 7,547,000 24,065,000 191
1979 .............. 87,314,000 6,330,000 23,985,000 188
1978 .............. 73,653,000 6,178,000 22,407,000 182
1977 .............. 62,886,000 6,154,000 20,921,000 179
1976 (53 weeks) ... 56,333,000 5,569,000 20,553,000 173
1975 .............. 50,492,000 5,132,000 19,134,000 172
1974 .............. 41,248,000 3,021,000 17,883,000 170
1973 .............. 35,050,000 1,940,000 17,813,000 169
1972 .............. 31,337,000 2,083,000 16,954,000 167
This performance has not been produced by a generally rising
tide. To the contrary, many well-known participants in the
boxed-chocolate industry either have lost money in this same
�
period or have been marginally profitable. To our knowledge,
only one good-sized competitor has achieved high profitability.
The success of See’s reflects the combination of an exceptional
product and an exceptional manager, Chuck Huggins.
During 1984 we increased prices considerably less than has
been our practice in recent years: per-pound realization was
$5.49, up only 1.4% from 1983. Fortunately, we made good
progress on cost control, an area that has caused us problems in
recent years. Per-pound costs - other than those for raw
materials, a segment of expense largely outside of our control -
increased by only 2.2% last year.
Our cost-control problem has been exacerbated by the problem
of modestly declining volume (measured by pounds, not dollars) on
a same-store basis. Total pounds sold through shops in recent
years has been maintained at a roughly constant level only by the
net addition of a few shops annually. This more-shops-to-get-
the-same-volume situation naturally puts heavy pressure on per-
pound selling costs.
In 1984, same-store volume declined 1.1%. Total shop volume,
however, grew 0.6% because of an increase in stores. (Both
percentages are adjusted to compensate for a 53-week fiscal year
in 1983.)
See’s business tends to get a bit more seasonal each year.
In the four weeks prior to Christmas, we do 40% of the year’s
volume and earn about 75% of the year’s profits. We also earn
significant sums in the Easter and Valentine’s Day periods, but
pretty much tread water the rest of the year. In recent years,
shop volume at Christmas has grown in relative importance, and so
have quantity orders and mail orders. The increased
concentration of business in the Christmas period produces a
multitude of managerial problems, all of which have been handled
by Chuck and his associates with exceptional skill and grace.
Their solutions have in no way involved compromises in
either quality of service or quality of product. Most of our
larger competitors could not say the same. Though faced with
somewhat less extreme peaks and valleys in demand than we, they
add preservatives or freeze the finished product in order to
smooth the production cycle and thereby lower unit costs. We
reject such techniques, opting, in effect, for production
headaches rather than product modification.
Our mall stores face a host of new food and snack vendors
that provide particularly strong competition at non-holiday
periods. We need new products to fight back and during 1984 we
introduced six candy bars that, overall, met with a good
reception. Further product introductions are planned.
In 1985 we will intensify our efforts to keep per-pound cost
increases below the rate of inflation. Continued success in
these efforts, however, will require gains in same-store
poundage. Prices in 1985 should average 6% - 7% above those of
1984. Assuming no change in same-store volume, profits should
show a moderate gain.
Buffalo Evening News
Profits at the News in 1984 were considerably greater than
we expected. As at See’s, excellent progress was made in
controlling costs. Excluding hours worked in the newsroom, total
hours worked decreased by about 2.8%. With this productivity
improvement, overall costs increased only 4.9%. This performance
by Stan Lipsey and his management team was one of the best in the
industry.
�
However, we now face an acceleration in costs. In mid-1984
we entered into new multi-year union contracts that provided for
a large “catch-up” wage increase. This catch-up is entirely
appropriate: the cooperative spirit of our unions during the
unprofitable 1977-1982 period was an important factor in our
success in remaining cost competitive with The Courier-Express.
Had we not kept costs down, the outcome of that struggle might
well have been different.
Because our new union contracts took effect at varying
dates, little of the catch-up increase was reflected in our 1984
costs. But the increase will be almost totally effective in 1985
and, therefore, our unit labor costs will rise this year at a
rate considerably greater than that of the industry. We expect
to mitigate this increase by continued small gains in
productivity, but we cannot avoid significantly higher wage costs
this year. Newsprint price trends also are less favorable now
than they were in 1984. Primarily because of these two factors,
we expect at least a minor contraction in margins at the News.
Working in our favor at the News are two factors of major
economic importance:
(1) Our circulation is concentrated to an unusual degree
in the area of maximum utility to our advertisers.
“Regional” newspapers with wide-ranging circulation, on
the other hand, have a significant portion of their
circulation in areas that are of negligible utility to
most advertisers. A subscriber several hundred miles
away is not much of a prospect for the puppy you are
offering to sell via a classified ad - nor for the
grocer with stores only in the metropolitan area.
“Wasted” circulation - as the advertisers call it -
hurts profitability: expenses of a newspaper are
determined largely by gross circulation while
advertising revenues (usually 70% - 80% of total
revenues) are responsive only to useful circulation;
(2) Our penetration of the Buffalo retail market is
exceptional; advertisers can reach almost all of their
potential customers using only the News.
Last year I told you about this unusual reader acceptance:
among the 100 largest newspapers in the country, we were then
number one, daily, and number three, Sunday, in penetration. The
most recent figures show us number one in penetration on weekdays
and number two on Sunday. (Even so, the number of households in
Buffalo has declined, so our current weekday circulation is down
slightly; on Sundays it is unchanged.)
I told you also that one of the major reasons for this
unusual acceptance by readers was the unusual quantity of news
that we delivered to them: a greater percentage of our paper is
devoted to news than is the case at any other dominant paper in
our size range. In 1984 our “news hole” ratio was 50.9%, (versus
50.4% in 1983), a level far above the typical 35% - 40%. We will
continue to maintain this ratio in the 50% area. Also, though we
last year reduced total hours worked in other departments, we
maintained the level of employment in the newsroom and, again,
will continue to do so. Newsroom costs advanced 9.1% in 1984, a
rise far exceeding our overall cost increase of 4.9%.
Our news hole policy costs us significant extra money for
newsprint. As a result, our news costs (newsprint for the news
hole plus payroll and expenses of the newsroom) as a percentage
of revenue run higher than those of most dominant papers of our
size. There is adequate room, however, for our paper or any
other dominant paper to sustain these costs: the difference
between “high” and “low” news costs at papers of comparable size
�
