Note: The following table appears in the printed Annual Report on the facing page of the
Chairman's Letter and is referred to in that letter.
Berkshire’s Corporate Performance vs. the S&P 500
Annual Percentage Change
in S&P 500
with Dividends
Included
in Per-Share
Book Value of
Berkshire
(1)
(2)
Year
1965
1966
1967
1968
1969
1970
1971
1972
1973
1974
1975
1976
1977
1978
1979
1980
1981
1982
1983
1984
1985
1986
1987
1988
1989
1990
1991
1992
1993
1994
1995
1996
1997
1998
1999
2000
2001
2002
2003
..................................................
..................................................
..................................................
..................................................
..................................................
..................................................
..................................................
..................................................
..................................................
..................................................
..................................................
..................................................
..................................................
..................................................
..................................................
..................................................
..................................................
..................................................
..................................................
..................................................
..................................................
..................................................
..................................................
..................................................
..................................................
..................................................
..................................................
..................................................
..................................................
..................................................
..................................................
..................................................
..................................................
..................................................
..................................................
..................................................
..................................................
..................................................
..................................................
23.8
20.3
11.0
19.0
16.2
12.0
16.4
21.7
4.7
5.5
21.9
59.3
31.9
24.0
35.7
19.3
31.4
40.0
32.3
13.6
48.2
26.1
19.5
20.1
44.4
7.4
39.6
20.3
14.3
13.9
43.1
31.8
34.1
48.3
.5
6.5
(6.2)
10.0
21.0
10.0
(11.7)
30.9
11.0
(8.4)
3.9
14.6
18.9
(14.8)
(26.4)
37.2
23.6
(7.4)
6.4
18.2
32.3
(5.0)
21.4
22.4
6.1
31.6
18.6
5.1
16.6
31.7
(3.1)
30.5
7.6
10.1
1.3
37.6
23.0
33.4
28.6
21.0
(9.1)
(11.9)
(22.1)
28.7
Relative
Results
(1)-(2)
13.8
32.0
(19.9)
8.0
24.6
8.1
1.8
2.8
19.5
31.9
(15.3)
35.7
39.3
17.6
17.5
(13.0)
36.4
18.6
9.9
7.5
16.6
7.5
14.4
3.5
12.7
10.5
9.1
12.7
4.2
12.6
5.5
8.8
.7
19.7
(20.5)
15.6
5.7
32.1
(7.7)
Average Annual Gain — 1965-2003
Overall Gain — 1964-2003
22.2
259,485
10.4
4,743
11.8
Notes: Data are for calendar years with these exceptions: 1965 and 1966, year ended 9/30; 1967, 15 months ended 12/31.
Starting in 1979, accounting rules required insurance companies to value the equity securities they hold at market
rather than at the lower of cost or market, which was previously the requirement. In this table, Berkshire's results
through 1978 have been restated to conform to the changed rules. In all other respects, the results are calculated using
the numbers originally reported.
The S&P 500 numbers are pre-tax whereas the Berkshire numbers are after-tax. If a corporation such as Berkshire
were simply to have owned the S&P 500 and accrued the appropriate taxes, its results would have lagged the S&P 500
in years when that index showed a positive return, but would have exceeded the S&P in years when the index showed a
negative return. Over the years, the tax costs would have caused the aggregate lag to be substantial.
2
�
BERKSHIRE HATHAWAY INC.
To the Shareholders of Berkshire Hathaway Inc.:
Our gain in net worth during 2003 was $13.6 billion, which increased the per-share book value of
both our Class A and Class B stock by 21%. Over the last 39 years (that is, since present management took
over) per-share book value has grown from $19 to $50,498, a rate of 22.2% compounded annually.*
It’s per-share intrinsic value that counts, however, not book value. Here, the news is good:
Between 1964 and 2003, Berkshire morphed from a struggling northern textile business whose intrinsic
value was less than book into a widely diversified enterprise worth far more than book. Our 39-year gain
in intrinsic value has therefore somewhat exceeded our 22.2% gain in book. (For a better understanding of
intrinsic value and the economic principles that guide Charlie Munger, my partner and Berkshire’s vice-
chairman, and me in running Berkshire, please read our Owner’s Manual, beginning on page 69.)
Despite their shortcomings, book value calculations are useful at Berkshire as a slightly
understated gauge for measuring the long-term rate of increase in our intrinsic value. The calculation is
less relevant, however, than it once was in rating any single year’s performance versus the S&P 500 index
(a comparison we display on the facing page). Our equity holdings, including convertible preferreds, have
fallen considerably as a percentage of our net worth, from an average of 114% in the 1980s, for example, to
an average of 50% in 2000-03. Therefore, yearly movements in the stock market now affect a much
smaller portion of our net worth than was once the case.
Nonetheless, Berkshire’s long-term performance versus the S&P remains all-important. Our
shareholders can buy the S&P through an index fund at very low cost. Unless we achieve gains in per-
share intrinsic value in the future that outdo the S&P’s performance, Charlie and I will be adding nothing to
what you can accomplish on your own.
If we fail, we will have no excuses. Charlie and I operate in an ideal environment. To begin with,
we are supported by an incredible group of men and women who run our operating units. If there were a
Corporate Cooperstown, its roster would surely include many of our CEOs. Any shortfall in Berkshire’s
results will not be caused by our managers.
Additionally, we enjoy a rare sort of managerial freedom. Most companies are saddled with
institutional constraints. A company’s history, for example, may commit it to an industry that now offers
limited opportunity. A more common problem is a shareholder constituency that pressures its manager to
dance to Wall Street’s tune. Many CEOs resist, but others give in and adopt operating and capital-
allocation policies far different from those they would choose if left to themselves.
At Berkshire, neither history nor the demands of owners impede intelligent decision-making.
When Charlie and I make mistakes, they are – in tennis parlance – unforced errors.
*All figures used in this report apply to Berkshire’s A shares, the successor to the only stock that
the company had outstanding before 1996. The B shares have an economic interest equal to 1/30th that of
the A.
3
�
Operating Earnings
When valuations are similar, we strongly prefer owning businesses to owning stocks. During
most of our years of operation, however, stocks were much the cheaper choice. We therefore sharply tilted
our asset allocation in those years toward equities, as illustrated by the percentages cited earlier.
In recent years, however, we’ve found it hard to find significantly undervalued stocks, a difficulty
greatly accentuated by the mushrooming of the funds we must deploy. Today, the number of stocks that
can be purchased in large enough quantities to move the performance needle at Berkshire is a small fraction
of the number that existed a decade ago. (Investment managers often profit far more from piling up assets
than from handling those assets well. So when one tells you that increased funds won’t hurt his investment
performance, step back: His nose is about to grow.)
The shortage of attractively-priced stocks in which we can put large sums doesn’t bother us,
providing we can find companies to purchase that (1) have favorable and enduring economic charac-
teristics; (2) are run by talented and honest managers and (3) are available at a sensible price. We have
purchased a number of such businesses in recent years, though not enough to fully employ the gusher of
cash that has come our way. In buying businesses, I’ve made some terrible mistakes, both of commission
and omission. Overall, however, our acquisitions have led to decent gains in per-share earnings.
Below is a table that quantifies that point. But first we need to warn you that growth-rate
presentations can be significantly distorted by a calculated selection of either initial or terminal dates. For
example, if earnings are tiny in a beginning year, a long-term performance that was only mediocre can be
made to appear sensational. That kind of distortion can come about because the company at issue was
minuscule in the base year – which means that only a handful of insiders actually benefited from the touted
performance – or because a larger company was then operating at just above breakeven. Picking a terminal
year that is particularly buoyant will also favorably bias a calculation of growth.
The Berkshire Hathaway that present management assumed control of in 1965 had long been
sizable. But in 1964, it earned only $175,586 or 15 cents per share, so close to breakeven that any
calculation of earnings growth from that base would be meaningless. At the time, however, even those
meager earnings looked good: Over the decade following the 1955 merger of Berkshire Fine Spinning
Associates and Hathaway Manufacturing, the combined operation had lost $10.1 million and many
thousands of employees had been let go. It was not a marriage made in heaven.
Against this background, we give you a picture of Berkshire’s earnings growth that begins in
1968, but also includes subsequent base years spaced five years apart. A series of calculations is presented
so that you can decide for yourself which period is most meaningful. I’ve started with 1968 because it was
the first full year we operated National Indemnity, the initial acquisition we made as we began to expand
Berkshire’s business.
I don’t believe that using 2003 as the terminal year distorts our calculations. It was a terrific year
for our insurance business, but the big boost that gave to earnings was largely offset by the pathetically low
interest rates we earned on our large holdings of cash equivalents (a condition that will not last). All
figures shown below, it should be noted, exclude capital gains.
Year
1964
1968
1973
1978
1983
1988
1993
1998
2003
Operating Earnings
in $ millions
.2
2.7
11.9
30.0
48.6
313.4
477.8
1,277.0
5,422.0
Subsequent Compounded
Growth Rate of Per-Share Earnings
Not meaningful (1964-2003)
22.8% (1968-2003)
20.8% (1973-2003)
21.1% (1978-2003)
24.3% (1983-2003)
18.6% (1988-2003)
23.9% (1993-2003)
28.2% (1998-2003)
Operating Earnings
Per Share in $
.15
2.69
12.18
29.15
45.60
273.37
413.19
1,020.49
3,531.32
4
�
We will continue the capital allocation practices we have used in the past. If stocks become
significantly cheaper than entire businesses, we will buy them aggressively. If selected bonds become
attractive, as they did in 2002, we will again load up on these securities. Under any market or economic
conditions, we will be happy to buy businesses that meet our standards. And, for those that do, the bigger
the better. Our capital is underutilized now, but that will happen periodically. It’s a painful condition to be
in – but not as painful as doing something stupid. (I speak from experience.)
Overall, we are certain Berkshire’s performance in the future will fall far short of what it has been
in the past. Nonetheless, Charlie and I remain hopeful that we can deliver results that are modestly above
average. That’s what we’re being paid for.
Acquisitions
As regular readers know, our acquisitions have often come about in strange ways. None, however,
had a more unusual genesis than our purchase last year of Clayton Homes.
The unlikely source was a group of finance students from the University of Tennessee, and their
teacher, Dr. Al Auxier. For the past five years, Al has brought his class to Omaha, where the group tours
Nebraska Furniture Mart and Borsheim’s, eats at Gorat’s and then comes to Kiewit Plaza for a session with
me. Usually about 40 students participate.
After two hours of give-and-take, the group traditionally presents me with a thank-you gift. (The
doors stay locked until they do.) In past years it’s been items such as a football signed by Phil Fulmer and
a basketball from Tennessee’s famous women’s team.
This past February, the group opted for a book – which, luckily for me, was the recently-published
autobiography of Jim Clayton, founder of Clayton Homes. I already knew the company to be the class act
of the manufactured housing industry, knowledge I acquired after earlier making the mistake of buying
some distressed junk debt of Oakwood Homes, one of the industry’s largest companies. At the time of that
purchase, I did not understand how atrocious consumer-financing practices had become throughout most of
the manufactured housing industry. But I learned: Oakwood rather promptly went bankrupt.
Manufactured housing, it should be emphasized, can deliver very good value to home purchasers.
Indeed, for decades, the industry has accounted for more than 15% of the homes built in the U.S. During
those years, moreover, both the quality and variety of manufactured houses consistently improved.
Progress in design and construction was not matched, however, by progress in distribution and
financing. Instead, as the years went by, the industry’s business model increasingly centered on the ability
of both the retailer and manufacturer to unload terrible loans on naive lenders. When “securitization” then
became popular in the 1990s, further distancing the supplier of funds from the lending transaction, the
industry’s conduct went from bad to worse. Much of its volume a few years back came from buyers who
shouldn’t have bought, financed by lenders who shouldn’t have lent. The consequence has been huge
numbers of repossessions and pitifully low recoveries on the units repossessed.
Oakwood participated fully in the insanity. But Clayton, though it could not isolate itself from
industry practices, behaved considerably better than its major competitors.
Upon receiving Jim Clayton’s book, I told the students how much I admired his record and they
took that message back to Knoxville, home of both the University of Tennessee and Clayton Homes. Al
then suggested that I call Kevin Clayton, Jim’s son and the CEO, to express my views directly. As I talked
with Kevin, it became clear that he was both able and a straight-shooter.
Soon thereafter, I made an offer for the business based solely on Jim’s book, my evaluation of
Kevin, the public financials of Clayton and what I had learned from the Oakwood experience. Clayton’s
board was receptive, since it understood that the large-scale financing Clayton would need in the future
might be hard to get. Lenders had fled the industry and securitizations, when possible at all, carried far
5
�
more expensive and restrictive terms than was previously the case. This tightening was particularly serious
for Clayton, whose earnings significantly depended on securitizations.
Today, the manufactured housing industry remains awash in problems. Delinquencies continue
high, repossessed units still abound and the number of retailers has been halved. A different business
model is required, one that eliminates the ability of the retailer and salesman to pocket substantial money
up front by making sales financed by loans that are destined to default. Such transactions cause hardship to
both buyer and lender and lead to a flood of repossessions that then undercut the sale of new units. Under a
proper model – one requiring significant down payments and shorter-term loans – the industry will likely
remain much smaller than it was in the 90s. But it will deliver to home buyers an asset in which they will
have equity, rather than disappointment, upon resale.
In the “full circle” department, Clayton has agreed to buy the assets of Oakwood. When the
transaction closes, Clayton’s manufacturing capacity, geographical reach and sales outlets will be
substantially increased. As a byproduct, the debt of Oakwood that we own, which we bought at a deep
discount, will probably return a small profit to us.
And the students? In October, we had a surprise “graduation” ceremony in Knoxville for the 40
who sparked my interest in Clayton. I donned a mortarboard and presented each student with both a PhD
(for phenomenal, hard-working dealmaker) from Berkshire and a B share. Al got an A share. If you meet
some of the new Tennessee shareholders at our annual meeting, give them your thanks. And ask them if
they’ve read any good books lately.
* * * * * * * * * * * *
In early spring, Byron Trott, a Managing Director of Goldman Sachs, told me that Wal-Mart
wished to sell its McLane subsidiary. McLane distributes groceries and nonfood items to convenience
stores, drug stores, wholesale clubs, mass merchandisers, quick service restaurants, theaters and others. It’s
a good business, but one not in the mainstream of Wal-Mart’s future. It’s made to order, however, for us.
McLane has sales of about $23 billion, but operates on paper-thin margins – about 1% pre-tax –
and will swell Berkshire’s sales figures far more than our income. In the past, some retailers had shunned
McLane because it was owned by their major competitor. Grady Rosier, McLane’s superb CEO, has
already landed some of these accounts – he was in full stride the day the deal closed – and more will come.
For several years, I have given my vote to Wal-Mart in the balloting for Fortune Magazine’s
“Most Admired” list. Our McLane transaction reinforced my opinion. To make the McLane deal, I had a
single meeting of about two hours with Tom Schoewe, Wal-Mart’s CFO, and we then shook hands. (He
did, however, first call Bentonville). Twenty-nine days later Wal-Mart had its money. We did no “due
diligence.” We knew everything would be exactly as Wal-Mart said it would be – and it was.
I should add that Byron has now been instrumental in three Berkshire acquisitions. He
understands Berkshire far better than any investment banker with whom we have talked and – it hurts me to
say this – earns his fee. I’m looking forward to deal number four (as, I am sure, is he).
Taxes
On May 20, 2003, The Washington Post ran an op-ed piece by me that was critical of the Bush tax
proposals. Thirteen days later, Pamela Olson, Assistant Secretary for Tax Policy at the U.S. Treasury,
delivered a speech about the new tax legislation saying, “That means a certain midwestern oracle, who, it
must be noted, has played the tax code like a fiddle, is still safe retaining all his earnings.” I think she was
talking about me.
Alas, my “fiddle playing” will not get me to Carnegie Hall – or even to a high school recital.
Berkshire, on your behalf and mine, will send the Treasury $3.3 billion for tax on its 2003 income, a sum
equaling 2½% of the total income tax paid by all U.S. corporations in fiscal 2003. (In contrast, Berkshire’s
market valuation is about 1% of the value of all American corporations.) Our payment will almost
6
�
certainly place us among our country’s top ten taxpayers. Indeed, if only 540 taxpayers paid the amount
Berkshire will pay, no other individual or corporation would have to pay anything to Uncle Sam. That’s
right: 290 million Americans and all other businesses would not have to pay a dime in income, social
security, excise or estate taxes to the federal government. (Here’s the math: Federal tax receipts, including
social security receipts, in fiscal 2003 totaled $1.782 trillion and 540 “Berkshires,” each paying $3.3
billion, would deliver the same $1.782 trillion.)
Our federal tax return for 2002 (2003 is not finalized), when we paid $1.75 billion, covered a mere
8,905 pages. As is required, we dutifully filed two copies of this return, creating a pile of paper seven feet
tall. At World Headquarters, our small band of 15.8, though exhausted, momentarily flushed with pride:
Berkshire, we felt, was surely pulling its share of our country’s fiscal load.
But Ms. Olson sees things otherwise. And if that means Charlie and I need to try harder, we are
ready to do so.
I do wish, however, that Ms. Olson would give me some credit for the progress I’ve already made.
In 1944, I filed my first 1040, reporting my income as a thirteen-year-old newspaper carrier. The return
covered three pages. After I claimed the appropriate business deductions, such as $35 for a bicycle, my tax
bill was $7. I sent my check to the Treasury and it – without comment – promptly cashed it. We lived in
peace.
* * * * * * * * * * * *
I can understand why the Treasury is now frustrated with Corporate America and prone to
outbursts. But it should look to Congress and the Administration for redress, not to Berkshire.
Corporate income taxes in fiscal 2003 accounted for 7.4% of all federal tax receipts, down from a
post-war peak of 32% in 1952. With one exception (1983), last year’s percentage is the lowest recorded
since data was first published in 1934.
Even so, tax breaks for corporations (and their investors, particularly large ones) were a major part
of the Administration’s 2002 and 2003 initiatives. If class warfare is being waged in America, my class is
clearly winning. Today, many large corporations – run by CEOs whose fiddle-playing talents make your
Chairman look like he is all thumbs – pay nothing close to the stated federal tax rate of 35%.
In 1985, Berkshire paid $132 million in federal income taxes, and all corporations paid $61
billion. The comparable amounts in 1995 were $286 million and $157 billion respectively. And, as
mentioned, we will pay about $3.3 billion for 2003, a year when all corporations paid $132 billion. We
hope our taxes continue to rise in the future – it will mean we are prospering – but we also hope that the
rest of Corporate America antes up along with us. This might be a project for Ms. Olson to work on.
Corporate Governance
In judging whether Corporate America is serious about reforming itself, CEO pay remains the acid
test. To date, the results aren’t encouraging. A few CEOs, such as Jeff Immelt of General Electric, have
led the way in initiating programs that are fair to managers and shareholders alike. Generally, however, his
example has been more admired than followed.
It’s understandable how pay got out of hand. When management hires employees, or when
companies bargain with a vendor, the intensity of interest is equal on both sides of the table. One party’s
gain is the other party’s loss, and the money involved has real meaning to both. The result is an honest-to-
God negotiation.
But when CEOs (or their representatives) have met with compensation committees, too often one
side – the CEO’s – has cared far more than the other about what bargain is struck. A CEO, for example,
will always regard the difference between receiving options for 100,000 shares or for 500,000 as
monumental. To a comp committee, however, the difference may seem unimportant – particularly if, as
7
�
has been the case at most companies, neither grant will have any effect on reported earnings. Under these
conditions, the negotiation often has a “play-money” quality.
Overreaching by CEOs greatly accelerated in the 1990s as compensation packages gained by the
most avaricious– a title for which there was vigorous competition – were promptly replicated elsewhere.
The couriers for this epidemic of greed were usually consultants and human relations departments, which
had no trouble perceiving who buttered their bread. As one compensation consultant commented: “There
are two classes of clients you don’t want to offend – actual and potential.”
In proposals for reforming this malfunctioning system, the cry has been for “independent”
directors. But the question of what truly motivates independence has largely been neglected.
In last year’s report, I took a look at how “independent” directors – as defined by statute – had
performed in the mutual fund field. The Investment Company Act of 1940 mandated such directors, and
that means we’ve had an extended test of what statutory standards produce. In our examination last year,
we looked at the record of fund directors in respect to the two key tasks board members should perform –
whether at a mutual fund business or any other. These two all-important functions are, first, to obtain (or
retain) an able and honest manager and then to compensate that manager fairly.
Our survey was not encouraging. Year after year, at literally thousands of funds, directors had
routinely rehired the incumbent management company, however pathetic its performance had been. Just as
routinely, the directors had mindlessly approved fees that in many cases far exceeded those that could have
been negotiated. Then, when a management company was sold – invariably at a huge price relative to
tangible assets – the directors experienced a “counter-revelation” and immediately signed on with the new
manager and accepted its fee schedule. In effect, the directors decided that whoever would pay the most
for the old management company was the party that should manage the shareholders’ money in the future.
Despite the lapdog behavior of independent fund directors, we did not conclude that they are bad
people. They’re not. But sadly, “boardroom atmosphere” almost invariably sedates their fiduciary genes.
On May 22, 2003, not long after Berkshire’s report appeared, the Chairman of the Investment
Company Institute addressed its membership about “The State of our Industry.” Responding to those who
have “weighed in about our perceived failings,” he mused, “It makes me wonder what life would be like if
we’d actually done something wrong.”
Be careful what you wish for.
Within a few months, the world began to learn that many fund-management companies had
followed policies that hurt the owners of the funds they managed, while simultaneously boosting the fees of
the managers. Prior to their transgressions, it should be noted, these management companies were earning
profit margins and returns on tangible equity that were the envy of Corporate America. Yet to swell profits
further, they trampled on the interests of fund shareholders in an appalling manner.
So what are the directors of these looted funds doing? As I write this, I have seen none that have
terminated the contract of the offending management company (though naturally that entity has often fired
some of its employees). Can you imagine directors who had been personally defrauded taking such a boys-
will-be-boys attitude?
To top it all off, at least one miscreant management company has put itself up for sale,
undoubtedly hoping to receive a huge sum for “delivering” the mutual funds it has managed to the highest
bidder among other managers. This is a travesty. Why in the world don’t the directors of those funds
simply select whomever they think is best among the bidding organizations and sign up with that party
directly? The winner would consequently be spared a huge “payoff” to the former manager who, having
flouted the principles of stewardship, deserves not a dime. Not having to bear that acquisition cost, the
winner could surely manage the funds in question for a far lower ongoing fee than would otherwise have
been the case. Any truly independent director should insist on this approach to obtaining a new manager.
8
�
The reality is that neither the decades-old rules regulating investment company directors nor the
new rules bearing down on Corporate America foster the election of truly independent directors. In both
instances, an individual who is receiving 100% of his income from director fees – and who may wish to
enhance his income through election to other boards – is deemed independent. That is nonsense. The same
rules say that Berkshire director and lawyer Ron Olson, who receives from us perhaps 3% of his very large
income, does not qualify as independent because that 3% comes from legal fees Berkshire pays his firm
rather than from fees he earns as a Berkshire director. Rest assured, 3% from any source would not torpedo
Ron’s independence. But getting 20%, 30% or 50% of their income from director fees might well temper
the independence of many individuals, particularly if their overall income is not large. Indeed, I think it’s
clear that at mutual funds, it has.
* * * * * * * * * * *
Let me make a small suggestion to “independent” mutual fund directors. Why not simply affirm
in each annual report that “(1) We have looked at other management companies and believe the one we
have retained for the upcoming year is among the better operations in the field; and (2) we have negotiated
a fee with our managers comparable to what other clients with equivalent funds would negotiate.”
It does not seem unreasonable for shareholders to expect fund directors – who are often receiving
fees that exceed $100,000 annually – to declare themselves on these points. Certainly these directors
would satisfy themselves on both matters were they handing over a large chunk of their own money to the
manager. If directors are unwilling to make these two declarations, shareholders should heed the maxim
“If you don’t know whose side someone is on, he’s probably not on yours.”
Finally, a disclaimer. A great many funds have been run well and conscientiously despite the
opportunities for malfeasance that exist. The shareholders of these funds have benefited, and their
managers have earned their pay. Indeed, if I were a director of certain funds, including some that charge
above-average fees, I would enthusiastically make the two declarations I have suggested. Additionally,
those index funds that are very low-cost (such as Vanguard’s) are investor-friendly by definition and are
the best selection for most of those who wish to own equities.
I am on my soapbox now only because the blatant wrongdoing that has occurred has betrayed the
trust of so many millions of shareholders. Hundreds of industry insiders had to know what was going on,
yet none publicly said a word. It took Eliot Spitzer, and the whistleblowers who aided him, to initiate a
housecleaning. We urge fund directors to continue the job. Like directors throughout Corporate America,
these fiduciaries must now decide whether their job is to work for owners or for managers.
Berkshire Governance
True independence – meaning the willingness to challenge a forceful CEO when something is
wrong or foolish – is an enormously valuable trait in a director. It is also rare. The place to look for it is
among high-grade people whose interests are in line with those of rank-and-file shareholders – and are in
line in a very big way.
We’ve made that search at Berkshire. We now have eleven directors and each of them, combined
with members of their families, owns more than $4 million of Berkshire stock. Moreover, all have held
major stakes in Berkshire for many years. In the case of six of the eleven, family ownership amounts to at
least hundreds of millions and dates back at least three decades. All eleven directors purchased their
holdings in the market just as you did; we’ve never passed out options or restricted shares. Charlie and I
love such honest-to-God ownership. After all, who ever washes a rental car?
In addition, director fees at Berkshire are nominal (as my son, Howard, periodically reminds me).
Thus, the upside from Berkshire for all eleven is proportionately the same as the upside for any Berkshire
shareholder. And it always will be.
9
�


 2025年软考高级信息系统项目管理师金色考点
 软考高项三色笔记
 镇安县双鑫矿业月河年处理15万吨尾渣综合加工利用项目水土保持报告表
  红杉资本:生成式AI最新市场格局.pdf
 wireshark 使用教程.pdf
 【2021年-贝佐斯致股东的信】.pdf
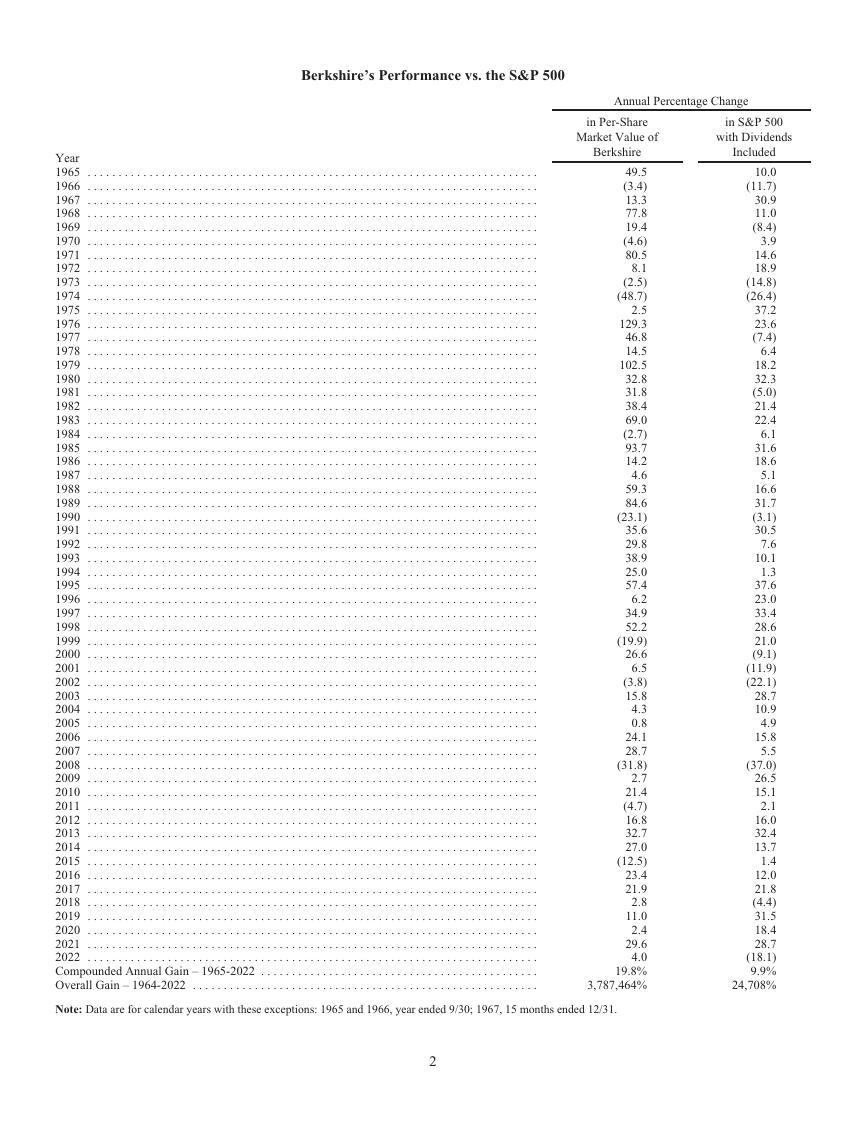 巴菲特致股东的公开信 - 2022.pdf
 MySQL 8.1 参考手册.pdf
 世界银行报告下载:激进政策缩紧浪潮不足遏制通胀 全球经济衰退迫在眉睫(Is a Global Recession Imminent?).pdf
 红杉资本报告:适应与忍耐(Adapting to Endure).pdf
 高保真音响系统设计制作-毕业论文.doc
 一种自适应互补滤波姿态估计算法.pdf