实验五 MATLAB7.0 三维绘图
实验目的:
① 掌握绘制三维图能形的方法;
② 掌握图形修饰处理方法;
③ 知道图像处理方法,了解动画制作方法。
实验要求:给出程序和实验结果。
实验内容:
一、绘制三维曲线
z
x
y
t
sin( )cos( )
t
sin( )
t
cos( )
t
t
二、绘制三维曲面图 z=sin(x+sin(y))-x/10。
三、绘制 z=x2+y2 的三维网线图形;
四、绘制三维陀螺锥面;
(仅供参考:
t1=0:0.1:0.9;
t2=1:0.1:2;
r=[t1 -t2+2];
[x,y,z]=cylinder(r,30);
surf(x,y,z);
grid
)
五、在 xy 平面内选择区域[-8,8]×[-8,8],利用 mesh、meshc、meshz 和 surf 绘
制
z
sin(
2
x
2
y
) /
2
x
。要求用子图在一个图形窗口中绘制。
2
y
六、绘制光照处理后的球面,取三个不同的光照位置进行比较。(提示:可以利
用函数 sphere 和 light)
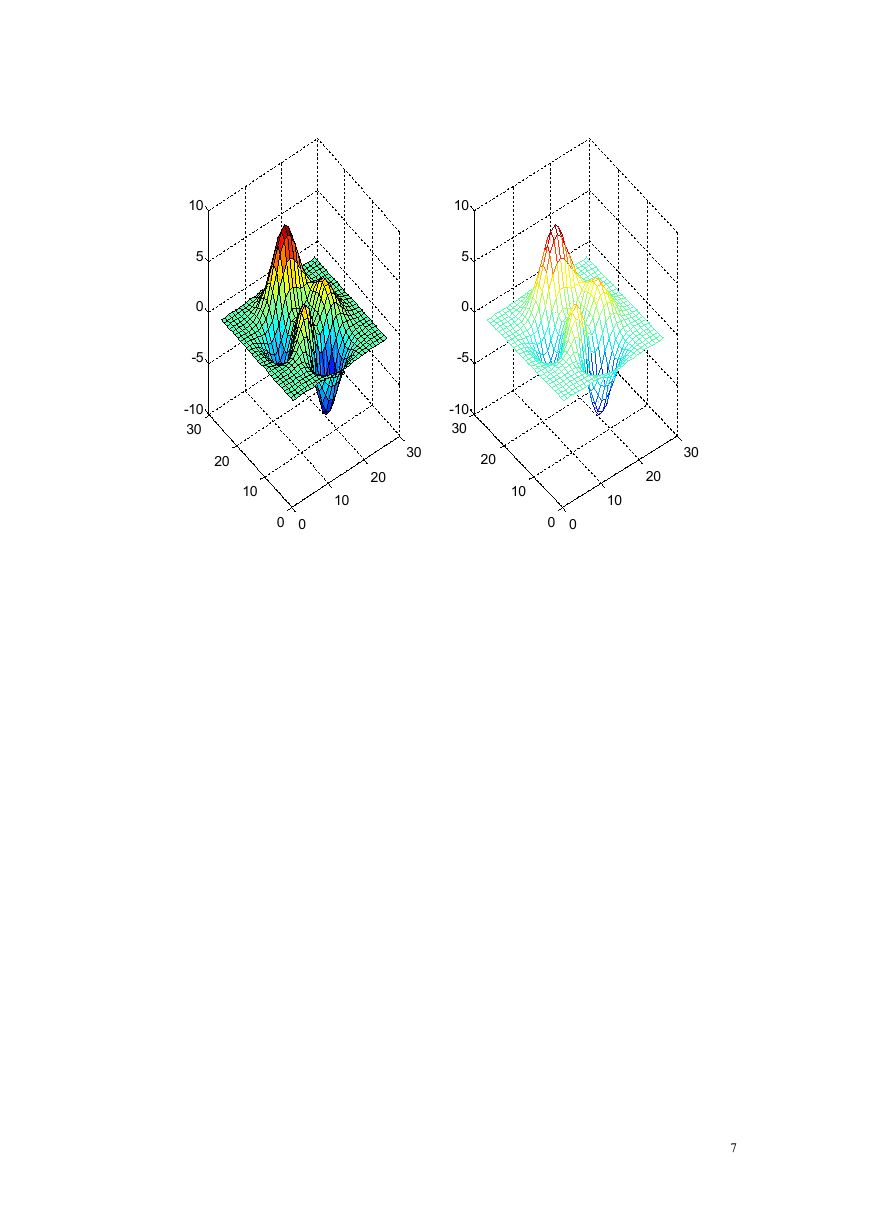
七、利用 peaks 产生数据,绘制多峰曲面图。
实验结果:
1
�
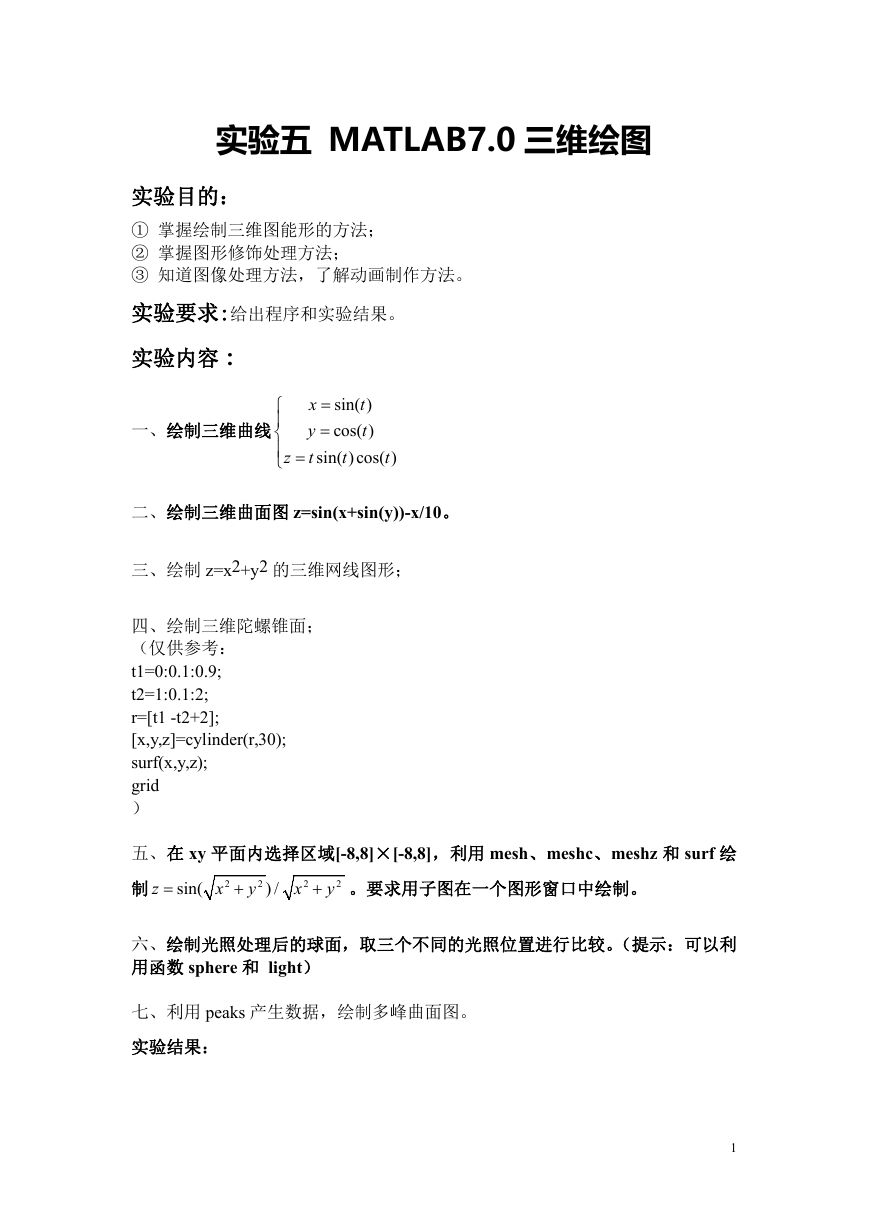
1. t=0:pi/100:10*pi;
x=sin(t);y=cos(t);z=t.*sin(t).*cos(t);
plot3(x,y,z)
20
10
0
-10
-20
1
0.5
0
-0.5
0
-0.5
-1
-1
1
0.5
2. x=-2*pi:0.01*pi:2*pi;
y=x';
m=ones(size(y))*x;
n=y*ones(size(x));
z=sin(m+sin(n))-m/10;
mesh(z)
2
�
3. [x,y]=meshgrid(0:0.25:4*pi);
z=x.^2+y.^2;
mesh(x,y,z)
400
300
200
100
0
15
10
5
5
0
0
15
10
4. t1=0:0.1:0.9;
3
�
t2=1:0.1:2;
r=[t1 -t2+2];
[x,y,z]=cylinder(r,30);
surf(x,y,z);
grid
1
0.8
0.6
0.4
0.2
0
1
0.5
0
-0.5
-1
-1
-0.5
0
0.5
1
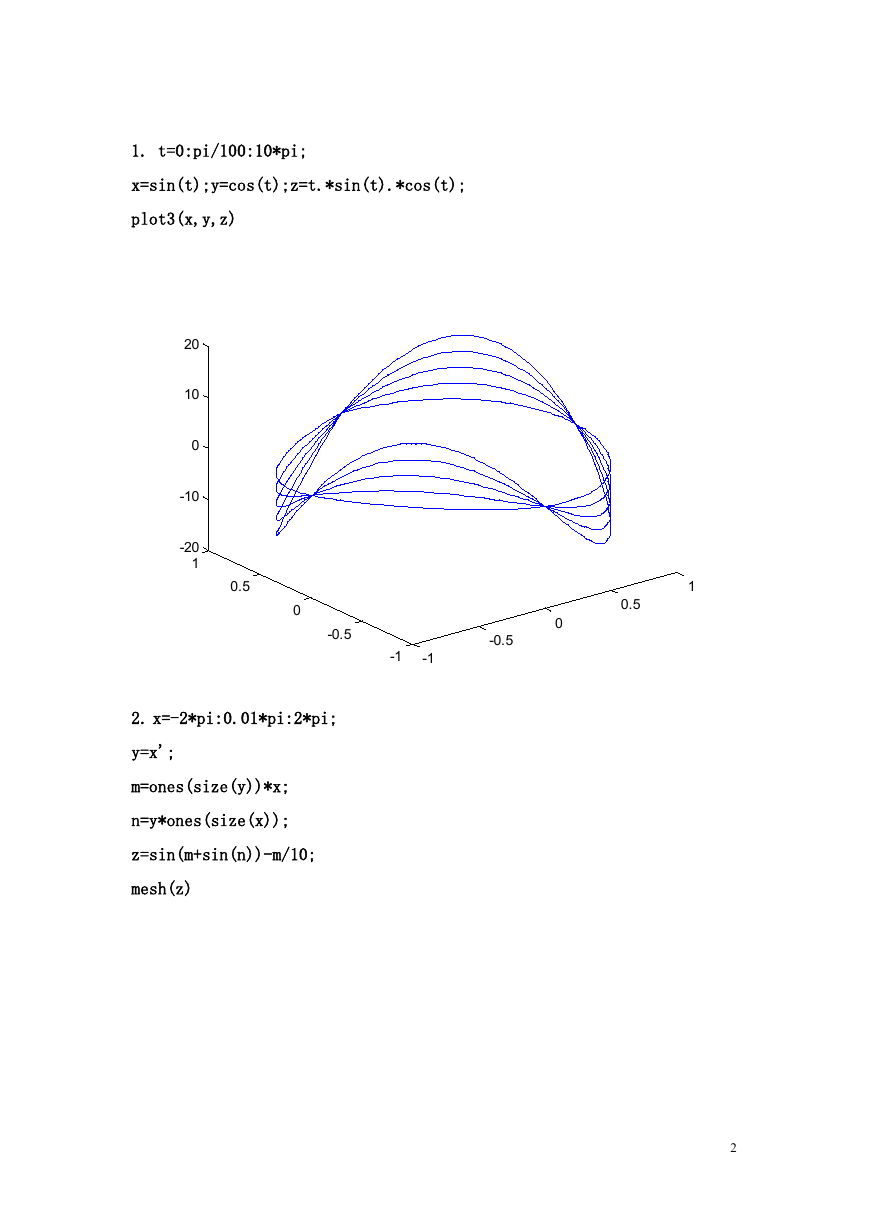
5. [x,y]=meshgrid(-8:0.25:8);
a=sqrt(x.^2+y.^2);
z=sin(a)./a;
subplot(2,2,1);
mesh(z);
subplot(2,2,2);
meshc(z);
subplot(2,2,3);
meshz(z);
subplot(2,2,4);
surf(z)
4
�
1
0.5
0
-0.5
80
1
0.5
0
-0.5
80
60
40
20
0
0
20
60
40
80
60
40
20
0
0
20
60
40
80
1
0.5
0
-0.5
-1
80
1
0.5
0
-0.5
80
60
40
20
0
0
40
20
80
60
60
40
20
0
0
40
20
80
60
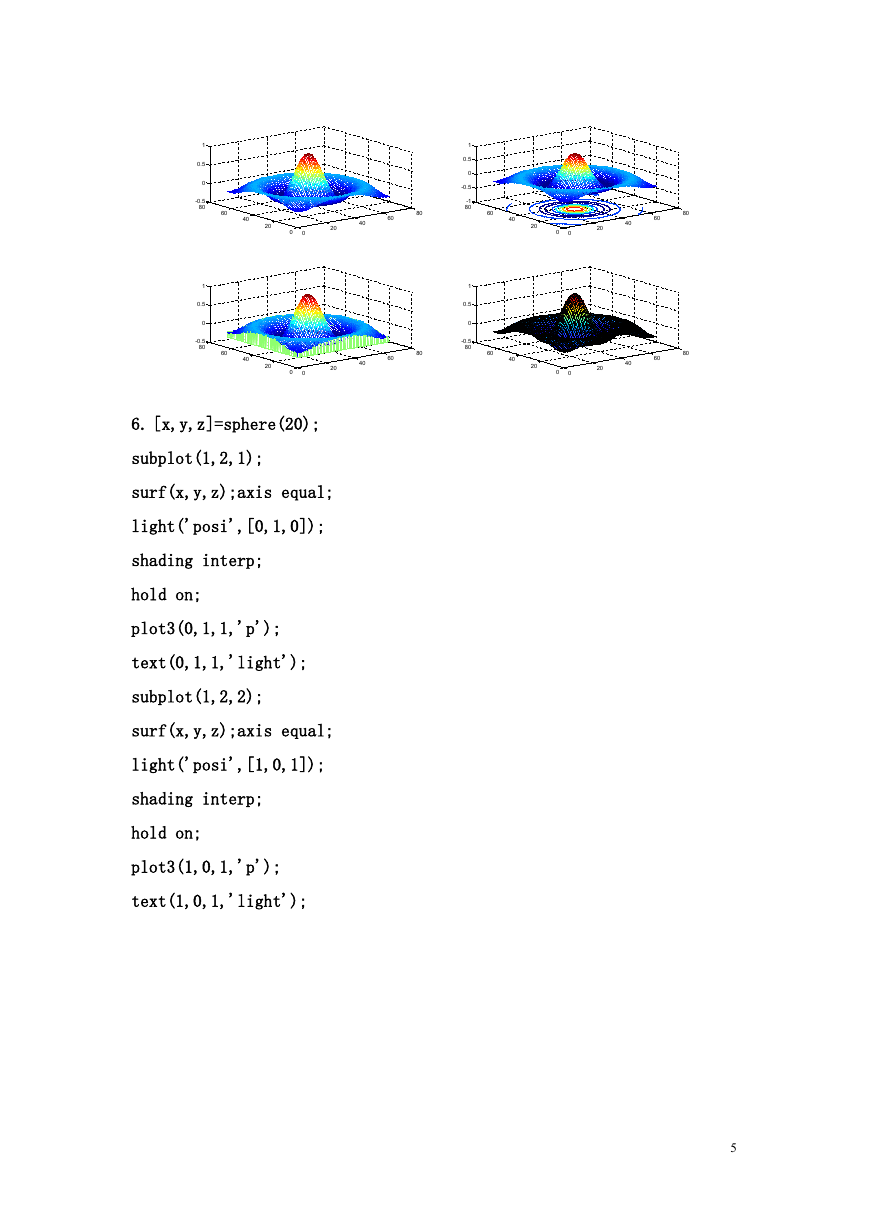
6. [x,y,z]=sphere(20);
subplot(1,2,1);
surf(x,y,z);axis equal;
light('posi',[0,1,0]);
shading interp;
hold on;
plot3(0,1,1,'p');
text(0,1,1,'light');
subplot(1,2,2);
surf(x,y,z);axis equal;
light('posi',[1,0,1]);
shading interp;
hold on;
plot3(1,0,1,'p');
text(1,0,1,'light');
5
�
7. [x,y,z]=peaks(27);
subplot(1,2,1);
surf(z);
subplot(1,2,2);
mesh(z)
6
�
10
5
0
-5
-10
30
10
5
0
-5
-10
30
20
10
0
0
30
20
10
20
10
10
0
0
30
20
7
�




 2023年江西萍乡中考道德与法治真题及答案.doc
 2012年重庆南川中考生物真题及答案.doc
 2013年江西师范大学地理学综合及文艺理论基础考研真题.doc
 2020年四川甘孜小升初语文真题及答案I卷.doc
 2020年注册岩土工程师专业基础考试真题及答案.doc
 2023-2024学年福建省厦门市九年级上学期数学月考试题及答案.doc
 2021-2022学年辽宁省沈阳市大东区九年级上学期语文期末试题及答案.doc
 2022-2023学年北京东城区初三第一学期物理期末试卷及答案.doc
 2018上半年江西教师资格初中地理学科知识与教学能力真题及答案.doc
 2012年河北国家公务员申论考试真题及答案-省级.doc
 2020-2021学年江苏省扬州市江都区邵樊片九年级上学期数学第一次质量检测试题及答案.doc
 2022下半年黑龙江教师资格证中学综合素质真题及答案.doc