Natural Resources, 2018, 9, 150-174
http://www.scirp.org/journal/nr
ISSN Online: 2158-7086
ISSN Print: 2158-706X
Sea-Level Rise and Coastal Inundation: A Case
Study of the Gulf Coast Energy Infrastructure
David E. Dismukes, Siddhartha Narra
Center for Energy Studies, Louisiana State University, Baton Rouge, LA, USA
How to cite this paper: Dismukes, D.E.
and Narra, S. (2018) Sea-Level Rise and
Coastal Inundation: A Case Study of the
Gulf Coast Energy Infrastructure. Natural
Resources, 9, 150-174.
https://doi.org/10.4236/nr.2018.94010
Received: March 1, 2018
Accepted: April 25, 2018
Published: April 28, 2018
Copyright © 2018 by authors and
Scientific Research Publishing Inc.
This work is licensed under the Creative
Commons Attribution International
License (CC BY 4.0).
http://creativecommons.org/licenses/by/4.0/
Open Access
Abstract
The United States (U.S.) Gulf Coast is a prominent global energy hub with a
set of highly integrated critical energy infrastructure that rivals, if not sur-
passes, any comparable set of infrastructure anywhere in the world. Past ex-
treme weather events in the region have led to critical energy infrastructure
disruptions with national and global implications. Future sea-level rise (SLR),
coupled with other natural hazards, will lead to a significant increase in ener-
gy infrastructure damage exposure. This research assesses coastal energy in-
frastructure that is at risk from various fixed SLR outcomes and scenarios.
The results indicate that natural gas processing plants that treat and process
natural gas before moving it into the interstate natural gas transmission sys-
tem may be particularly vulnerable to inundation than other forms of critical
energy infrastructure. Under certain SLR assumptions, as much as six Bcfd
(eight percent of all U.S. natural gas processing capacity) could be inundated.
More extreme SLR exposure assumptions result in greater levels of energy in-
frastructure capacity exposure including as much as 39 percent of all U.S. re-
fining capacity based on current operating levels. This research and its results
show that while fossil fuel industries are often referenced as part of the climate
change problem, these industries will likely be more than proportionally ex-
posed to the negative impacts of various climate change outcomes relative to
other industrial sectors of the U.S. economy. This has important implications
for the U.S. and global energy supplies and costs, as well as for the U.S. re-
gional economies reliant on coastal energy infrastructure and its supporting
industries.
Keywords
Gulf Coast, Energy Infrastructure, Sea-Level Rise, Climate Change, Natural
Gas Processing, Refining, Power Generation
DOI: 10.4236/nr.2018.94010 Apr. 28, 2018
150
Natural Resources
�
D. E. Dismukes, S. Narra
1. Introduction
The exact amount of future sea level rise (SLR) is uncertain [1] [2], but the
scientific community is reasonably certain that SLR and its acceleration, in con-
junction with other natural hazards, will pose increasing challenges to coastal
communities and infrastructure. Current sea levels do not pose an immediate
threat to the coastal energy infrastructure as they are located at slightly higher
elevation than normal sea levels, but the storm surges and flooding from ex-
treme weather-related events often increase the current exposure of these facili-
ties to near-term damage [3]. SLR is expected to lead to an increase in storm
frequency and intensity. This will likely result in an increase in damage exposure
for a wide range of critical energy infrastructure that includes natural gas and
crude oil pipelines, petrochemical facilities, natural gas processing facilities,
crude oil refineries, fractionation units, among others. These facilities cannot be
simply shut-down and moved to avoid SLR damage exposure since they are
long-lived with, in most instances, a considerable amount of remaining eco-
nomic life. Understanding how these facilities will be impacted by future SLR
requires a comparison of current facility characteristics and how those compare
to SLR projections and scenarios. A scenario-based analysis of rising sea levels
involves an understanding of coastal zone changes attributed to increased inun-
dation extent, and frequent and longer duration coastal flooding at local scales.
SLR can have broad impacts on energy systems affecting a number of sectors
[4] with cascading effects on the economy and environmental systems [5]. Storm
surge and other forms of inundation during the U.S. 2004-2005 tropical season,
coupled with later 2017 events such as Hurricane Harvey and Irma, underscore
how a concentrated amount of critical energy infrastructure, located across a
relatively geographically limited area, can have national and even global ramifi-
cations.
These very limited past experiences bode ill for the future of a large amount of
Gulf Coast energy infrastructure. Considering the number of major flood events,
comparable to the events like Hurricane Harvey, it is expected to increase since
the annual likelihood of area-integrated precipitation in excess of 50 cm is also
forecast to increase by as much as 18 percent during the 2081-2100 period. This
is significantly higher than the one percent probability seen for similar events
during the 1981-2000 period [6]. SLR and concomitant nature-induced hazards
demonstrate the need for quantitative risk assessments of such disasters across a
range of industries and regions. However, risk assessment using current tools
may prove to be inadequate since these traditional risk assessment models do
not incorporate changes in hazard occurrences and strength [7].
The U.S. Gulf Coast has one of the most developed, and comprehensive ener-
gy economies in the world. This extensive energy economy is supported by a
vast network of highly integrated infrastructure that is located in what experts
and laypersons would appreciate as being “harsh”. Extreme temperatures, high
151
Natural Resources
DOI: 10.4236/nr.2018.94010
�
D. E. Dismukes, S. Narra
DOI: 10.4236/nr.2018.94010
humidity, a relative low-elevation, and exposure to considerable tropical storm
activity are everyday events. The region’s changing ecosystem serves as a con-
stant threat to this critical energy infrastructure and the resources it distributes
across the U.S. and the globe [8] [9] [10] [11].
While some past academic research has recognized and explored the rela-
tionship of energy infrastructure and its environment [3] [12] [13] [14] [15]
[16]; including industrial plant vulnerability to floods [17], production effects
because of extreme weather events [18], and local-level impacts of tsunamis on
refineries [19]; there is little analysis on the relationship between future SLR on
coastal energy infrastructure in a concentrated area like the Gulf Coast.
The objectives of this research are to address this relationship through: (1) a
review of historical SLR and regional variations across the Gulf Coast; (2) analy-
sis of the direct impacts that SLR will likely have on specific energy system as-
sets; and (3) examining adaptation methods, and the limitation to these methods
and opportunities for future research.
2. Background
2.1. SLR Projections and Scenarios
Over the past several years, there has been a systematic increase in the use of
SLR projections for decision making and policy planning. The use of future SLR
projections is a critical first step in assessing critical energy infrastructure dam-
age exposure. Tide gauges that provide records of historical SLR levels that span
over several decades have been traditionally used to estimate future trends.
Global SLR averaged 1.7 ± 0.2 mm/yr from the start of the 20th century [20],
and with the potential for acceleration, SLR is expected to increase beyond the
higher limit of 98 cm by 2100 as reported in the Intergovernmental Panel on
Climate Change’s Fifth Assessment [2]. Recent SLR projections based on
semi-empirical [21] or process-based methods [22] attempted to improve the
confidence associated with such projections, but the inherent probability models
and confidence levels connected with such projections are not easily applied to
risk analysis.
Parris et al. [23] highlighted the use of a multiple-scenario approach in eva-
luating risk established on the basis of tolerance associated with a given risk. A
scenario in this context is defined as “a description of future potential conditions
in a manner that supports decision-making under conditions of uncertainty”
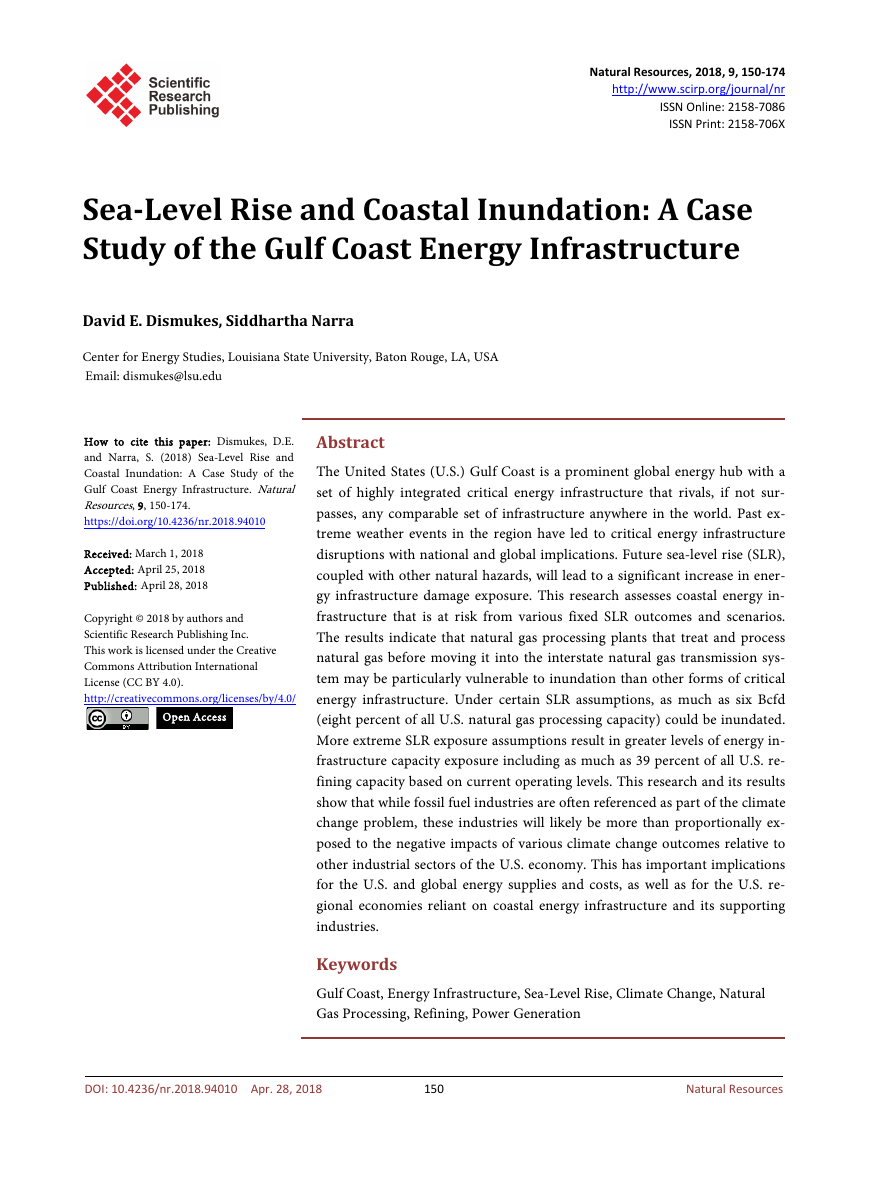
[24]. Accordingly, mean SLR is classified into four scenarios from a “Lowest” of
0.2 m to the “Highest” level of 2.0 m with two intermediate scenarios of “Inter-
mediate Low” (0.5 m) and “Intermediate High” (1.2 m) (Figure 1). The United
States Army Corps of Engineers, similarly, acknowledged that 2.0 m is a reliable
upper bound for future SLR projections. Based on the more recent estimates that
incorporate the effects of the ice sheet and glacier melting, Sweet et al. [25] re-
vised the global mean SLR to 2.5 m by the year 2100 under the “Extreme” scena-
rio.
152
Natural Resources
�
D. E. Dismukes, S. Narra
Figure 1. Global mean SLR scenarios [23].
2.2. Gulf Coast SLR
The U.S. Gulf Coast is the geographical area in the southern U.S. adjoining the
northern portion of the Gulf of Mexico (GoM). The coastal states that have a
shoreline on the GoM are Texas, Louisiana, Mississippi, Alabama and Florida.
The Gulf Coast is one of the extensively monitored regions for SLR with nu-
merous tide gauges providing decadal-scale sea level data. These long SLR pe-
riods are valuable for assessing climate resilience of energy infrastructure in-
vestments because many of these facilities are expected to last several decades.
The mean sea level trends are assessed for select U.S. stations that span the five
Gulf Coast states by using the National Oceanic and Atmospheric Administra-
tion’s (NOAA) Center for Operational Oceanographic Products and Services
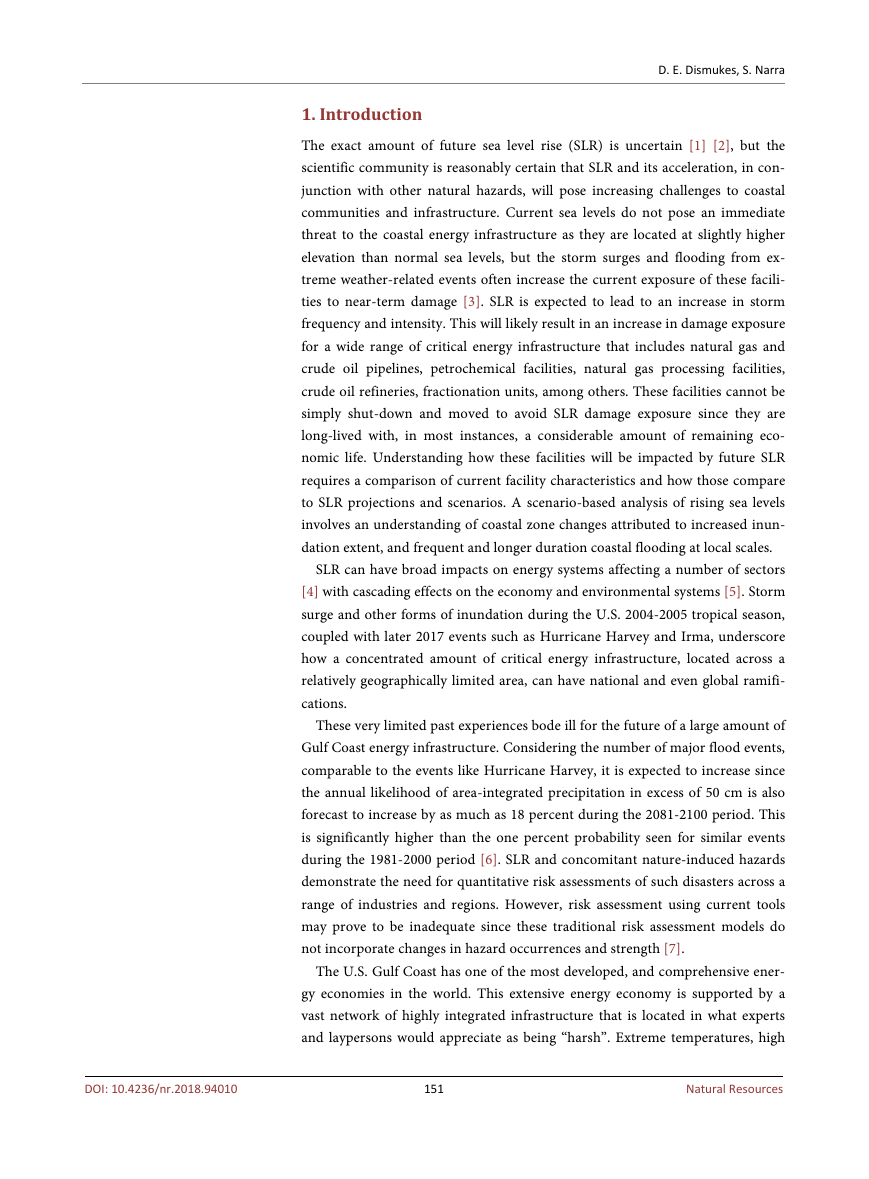
historical tide gauge data [26]. Significant variation in SLR is observed among
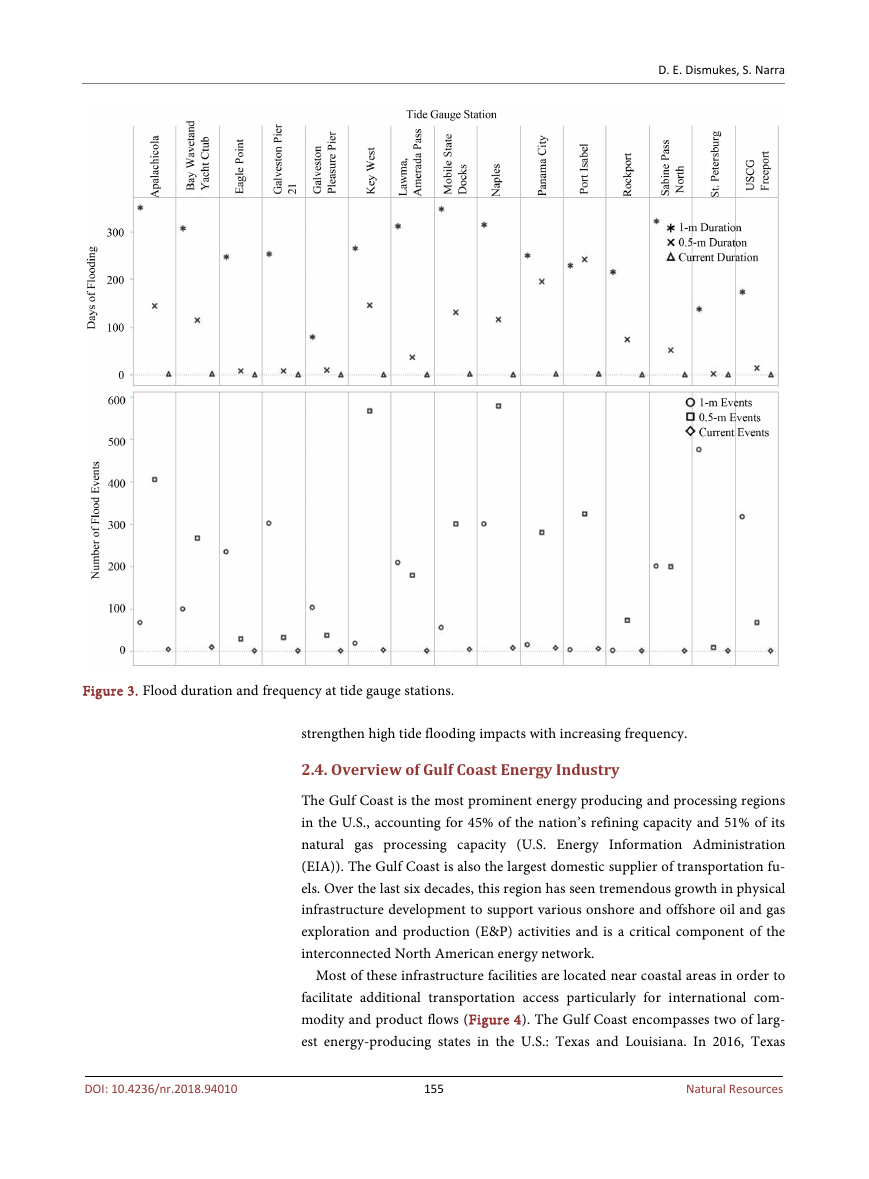
different tide gauge stations along the Gulf Coast (Figure 2).
Coastal Louisiana and some parts of Texas have relatively high SLR compared
to other coastal states. The regions of highest SLR are recorded in the Mississippi
River Delta plain, where the average rate for the period 1947-2016 is 9.65 mm/yr
(Eugene Island), closely followed by Grand Isle at 9.09 mm/yr [26]. In southwest
coastal Louisiana, geologic and physical processes have resulted in high rates of
subsidence making the region highly vulnerable compared to their counterparts
along the Gulf Coast [27].
In Texas, the rate of SLR ranged from 1.93 mm/yr in Port Mansfield to 6.62
mm/yr in Galveston. In the eastern Gulf Coast, the lowest rates of SLR were rec-
orded from the tide gauges along Mississippi, Alabama, and Florida coasts.
For Florida, the mean SLR rates averaged around 2.7 mm/yr during the
measured period. These regional differences in SLR are significant from the
standpoint of understanding coastal impacts and risk assessment because of
their potentially complex interactions with other mitigating factors including se-
diment deposition and barrier island buffering [28]. Because of the high tide
gauge readings in coastal Louisiana and some parts of Texas, it is fair to assume
153
Natural Resources
DOI: 10.4236/nr.2018.94010
�
D. E. Dismukes, S. Narra
Figure 2. Tide gauge readings from different stations along the Gulf Coast.
that these areas will see SLR in the upper bounds of future scenarios.
2.3. Flood Frequency and Duration
One of the ancillary effects of SLR that has been well established in past research
is tidal flooding [29]. Many coastal communities have to deal with more fre-
quent and extended flooding in the next few decades even before the rising sea
levels lead to greater inundation extent [29]. Since the 1960s, annual occurrences
of tidal flooding above local thresholds have seen a 5-to-10-fold increase. As rel-
ative sea level increases, high tides may cause flooding even in the absence of
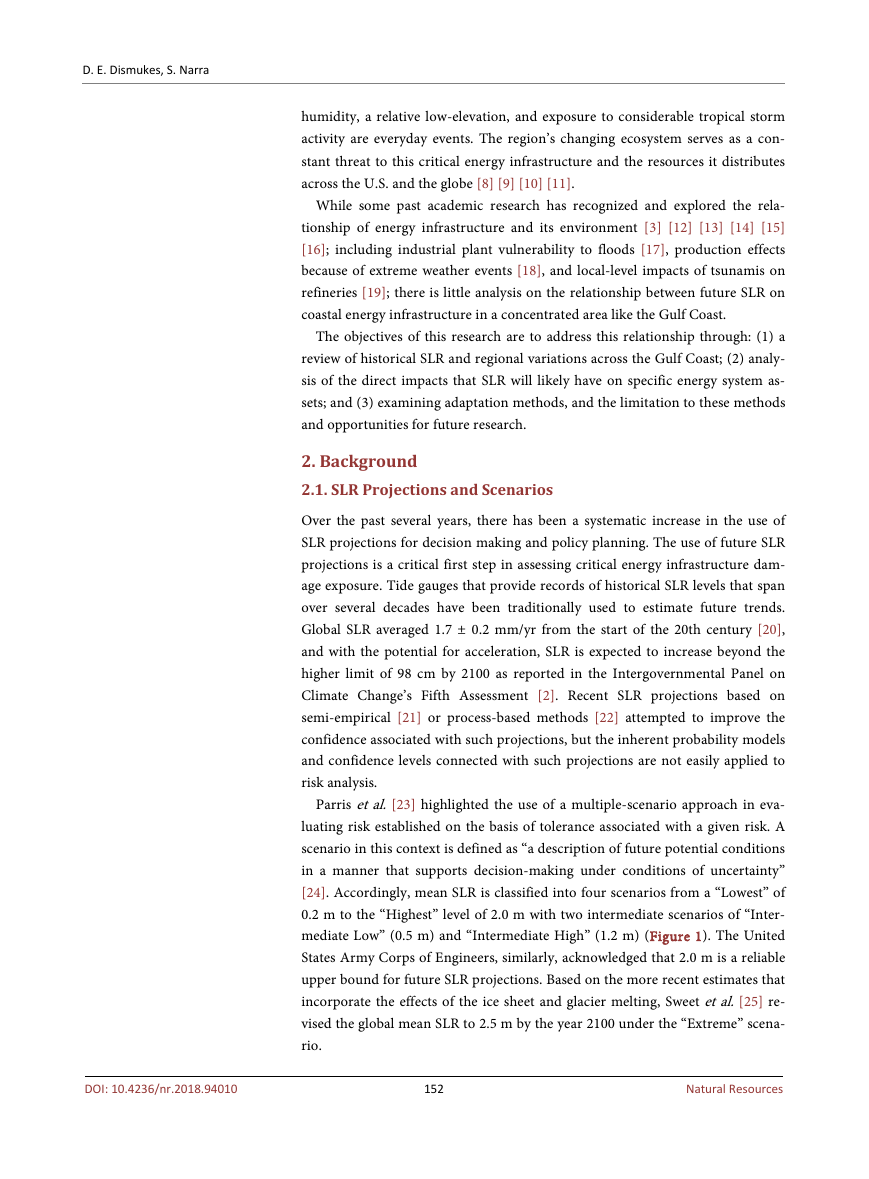
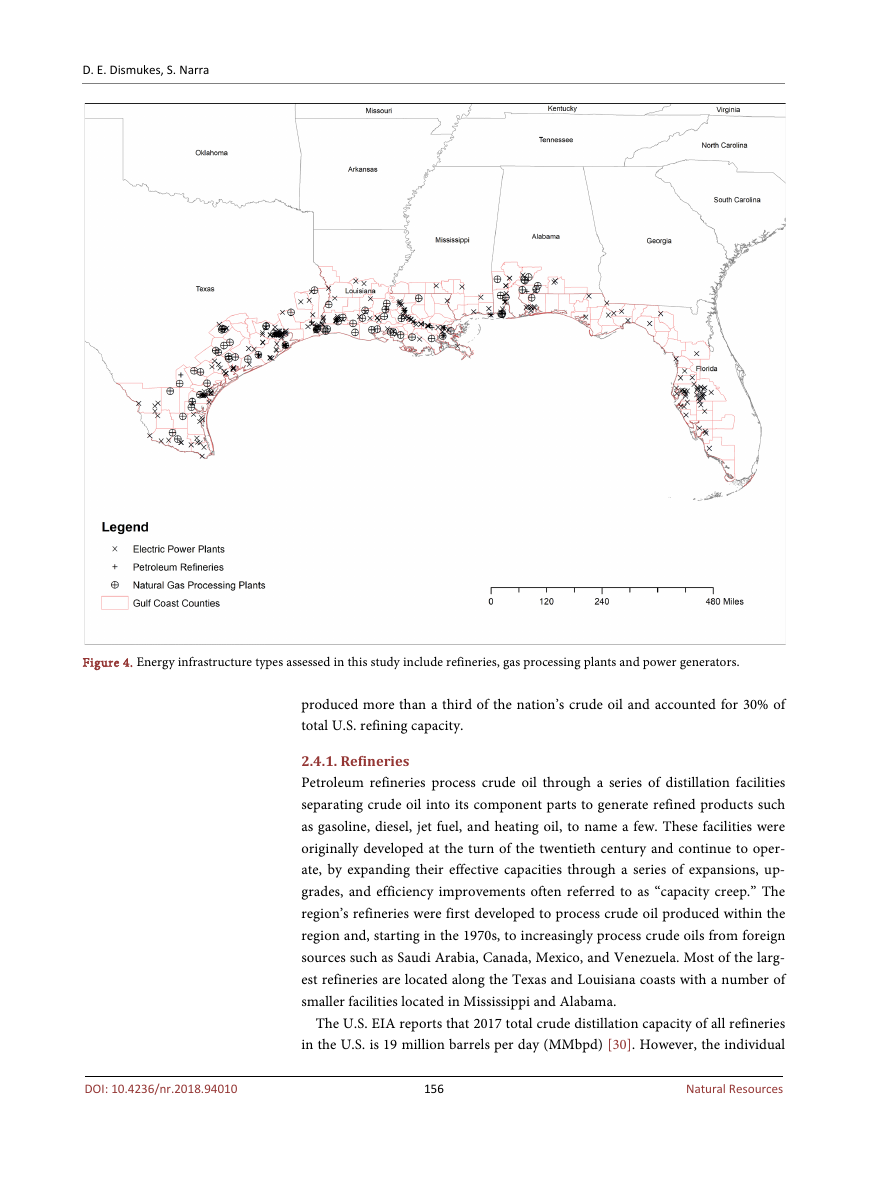
hurricanes and storm surges. Figure 3 shows the surge in the number of flood
events and flood duration as sea level rises to hypothetical scenarios of 0.5 m and
1.0 from current mean sea levels at different tide gauge stations along the Gulf
Coast. At most locations examined across the Gulf Coast, a 0.5-m increase in the
mean sea level leads to flood frequency that is 50 times greater than the current
levels while also showing a significant increase in flood duration because flood
level thresholds are reached more often. For most areas, a 0.5-m increase in sea
level results in frequent flooding events with shorter tidal cycle durations. In
some cases, as sea level rises to 1.0 m, the number of flooding events decreases
while the durations increase substantially. Justifiably, flood frequency is expected
to be greatest in low-lying areas that are supplemented by high SLR levels. Any
further acceleration in SLR that is predicted to occur this century is expected to
154
Natural Resources
DOI: 10.4236/nr.2018.94010
�
D. E. Dismukes, S. Narra
Figure 3. Flood duration and frequency at tide gauge stations.
strengthen high tide flooding impacts with increasing frequency.
2.4. Overview of Gulf Coast Energy Industry
The Gulf Coast is the most prominent energy producing and processing regions
in the U.S., accounting for 45% of the nation’s refining capacity and 51% of its
natural gas processing capacity (U.S. Energy Information Administration
(EIA)). The Gulf Coast is also the largest domestic supplier of transportation fu-
els. Over the last six decades, this region has seen tremendous growth in physical
infrastructure development to support various onshore and offshore oil and gas
exploration and production (E&P) activities and is a critical component of the
interconnected North American energy network.
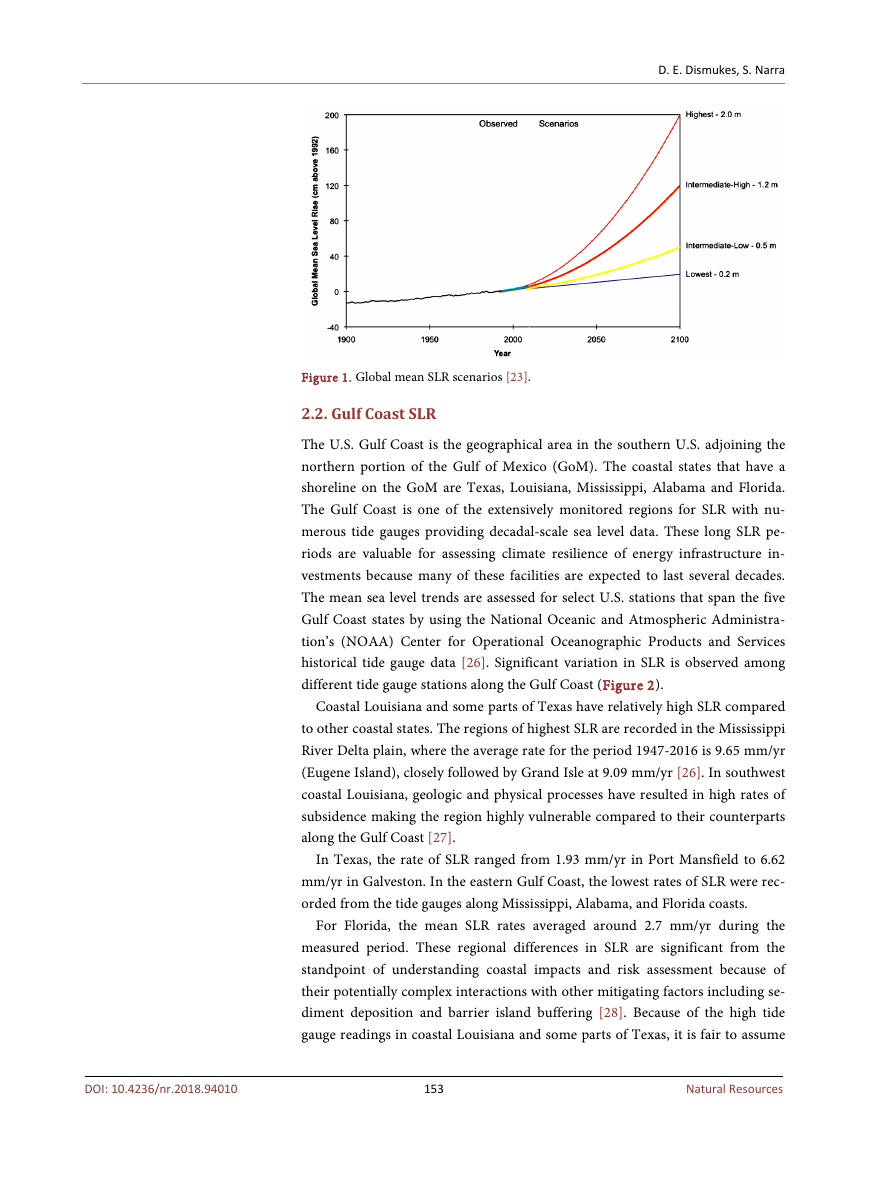
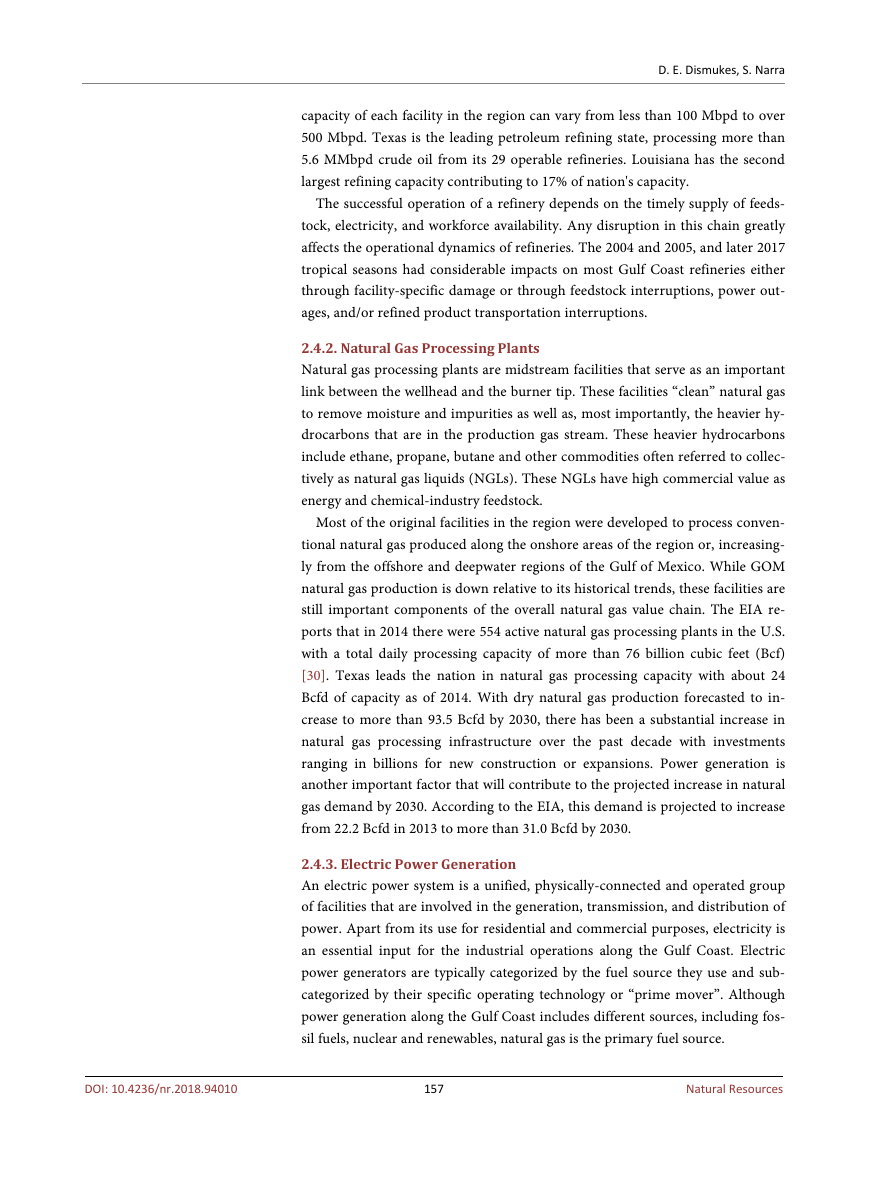
Most of these infrastructure facilities are located near coastal areas in order to
facilitate additional transportation access particularly for international com-
modity and product flows (Figure 4). The Gulf Coast encompasses two of larg-
est energy-producing states in the U.S.: Texas and Louisiana. In 2016, Texas
155
Natural Resources
DOI: 10.4236/nr.2018.94010
�
D. E. Dismukes, S. Narra
Figure 4. Energy infrastructure types assessed in this study include refineries, gas processing plants and power generators.
produced more than a third of the nation’s crude oil and accounted for 30% of
total U.S. refining capacity.
2.4.1. Refineries
Petroleum refineries process crude oil through a series of distillation facilities
separating crude oil into its component parts to generate refined products such
as gasoline, diesel, jet fuel, and heating oil, to name a few. These facilities were
originally developed at the turn of the twentieth century and continue to oper-
ate, by expanding their effective capacities through a series of expansions, up-
grades, and efficiency improvements often referred to as “capacity creep.” The
region’s refineries were first developed to process crude oil produced within the
region and, starting in the 1970s, to increasingly process crude oils from foreign
sources such as Saudi Arabia, Canada, Mexico, and Venezuela. Most of the larg-
est refineries are located along the Texas and Louisiana coasts with a number of
smaller facilities located in Mississippi and Alabama.
The U.S. EIA reports that 2017 total crude distillation capacity of all refineries
in the U.S. is 19 million barrels per day (MMbpd) [30]. However, the individual
156
Natural Resources
DOI: 10.4236/nr.2018.94010
�
D. E. Dismukes, S. Narra
capacity of each facility in the region can vary from less than 100 Mbpd to over
500 Mbpd. Texas is the leading petroleum refining state, processing more than
5.6 MMbpd crude oil from its 29 operable refineries. Louisiana has the second
largest refining capacity contributing to 17% of nation's capacity.
The successful operation of a refinery depends on the timely supply of feeds-
tock, electricity, and workforce availability. Any disruption in this chain greatly
affects the operational dynamics of refineries. The 2004 and 2005, and later 2017
tropical seasons had considerable impacts on most Gulf Coast refineries either
through facility-specific damage or through feedstock interruptions, power out-
ages, and/or refined product transportation interruptions.
2.4.2. Natural Gas Processing Plants
Natural gas processing plants are midstream facilities that serve as an important
link between the wellhead and the burner tip. These facilities “clean” natural gas
to remove moisture and impurities as well as, most importantly, the heavier hy-
drocarbons that are in the production gas stream. These heavier hydrocarbons
include ethane, propane, butane and other commodities often referred to collec-
tively as natural gas liquids (NGLs). These NGLs have high commercial value as
energy and chemical-industry feedstock.
Most of the original facilities in the region were developed to process conven-
tional natural gas produced along the onshore areas of the region or, increasing-
ly from the offshore and deepwater regions of the Gulf of Mexico. While GOM
natural gas production is down relative to its historical trends, these facilities are
still important components of the overall natural gas value chain. The EIA re-
ports that in 2014 there were 554 active natural gas processing plants in the U.S.
with a total daily processing capacity of more than 76 billion cubic feet (Bcf)
[30]. Texas leads the nation in natural gas processing capacity with about 24
Bcfd of capacity as of 2014. With dry natural gas production forecasted to in-
crease to more than 93.5 Bcfd by 2030, there has been a substantial increase in
natural gas processing infrastructure over the past decade with investments
ranging in billions for new construction or expansions. Power generation is
another important factor that will contribute to the projected increase in natural
gas demand by 2030. According to the EIA, this demand is projected to increase
from 22.2 Bcfd in 2013 to more than 31.0 Bcfd by 2030.
2.4.3. Electric Power Generation
An electric power system is a unified, physically-connected and operated group
of facilities that are involved in the generation, transmission, and distribution of
power. Apart from its use for residential and commercial purposes, electricity is
an essential input for the industrial operations along the Gulf Coast. Electric
power generators are typically categorized by the fuel source they use and sub-
categorized by their specific operating technology or “prime mover”. Although
power generation along the Gulf Coast includes different sources, including fos-
sil fuels, nuclear and renewables, natural gas is the primary fuel source.
157
Natural Resources
DOI: 10.4236/nr.2018.94010
�


 2023年江西萍乡中考道德与法治真题及答案.doc
 2012年重庆南川中考生物真题及答案.doc
 2013年江西师范大学地理学综合及文艺理论基础考研真题.doc
 2020年四川甘孜小升初语文真题及答案I卷.doc
 2020年注册岩土工程师专业基础考试真题及答案.doc
 2023-2024学年福建省厦门市九年级上学期数学月考试题及答案.doc
 2021-2022学年辽宁省沈阳市大东区九年级上学期语文期末试题及答案.doc
 2022-2023学年北京东城区初三第一学期物理期末试卷及答案.doc
 2018上半年江西教师资格初中地理学科知识与教学能力真题及答案.doc
 2012年河北国家公务员申论考试真题及答案-省级.doc
 2020-2021学年江苏省扬州市江都区邵樊片九年级上学期数学第一次质量检测试题及答案.doc
 2022下半年黑龙江教师资格证中学综合素质真题及答案.doc