第二章
1.
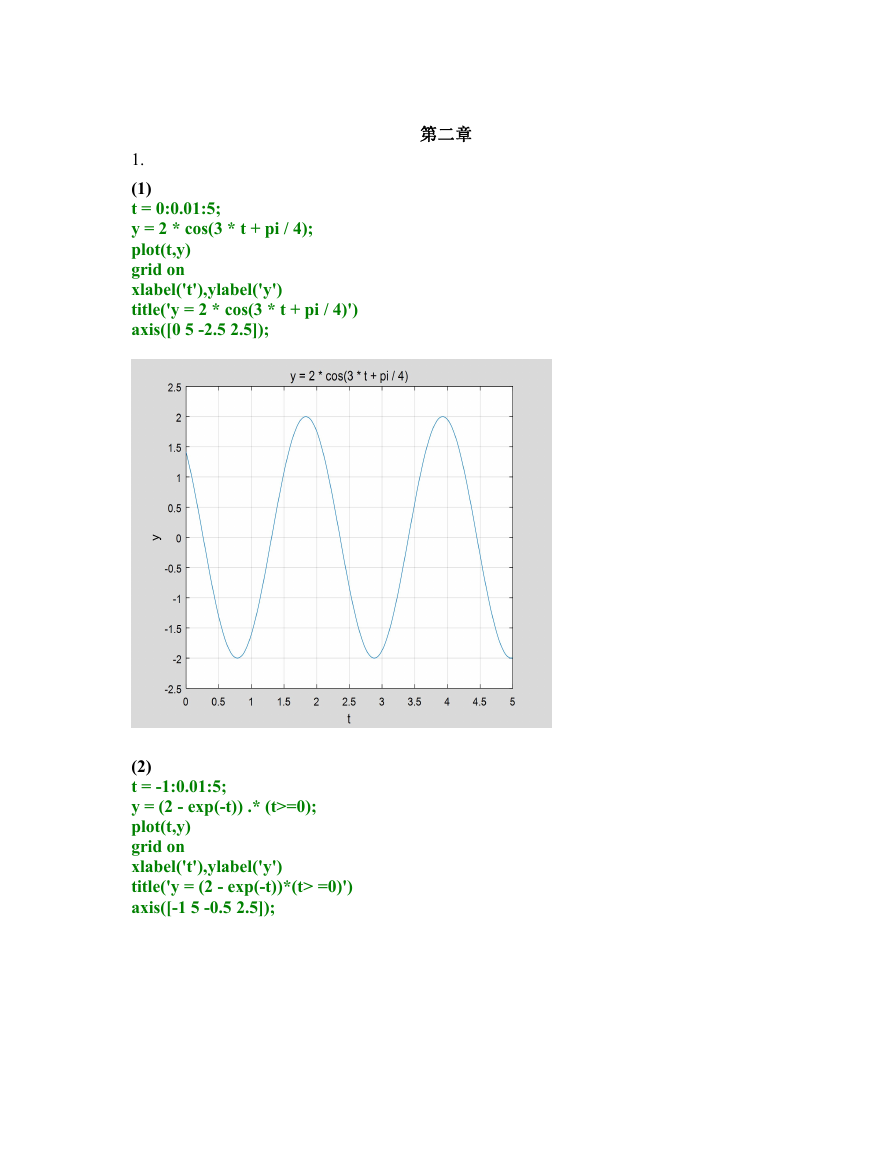
(1)
t = 0:0.01:5;
y = 2 * cos(3 * t + pi / 4);
plot(t,y)
grid on
xlabel('t'),ylabel('y')
title('y = 2 * cos(3 * t + pi / 4)')
axis([0 5 -2.5 2.5]);
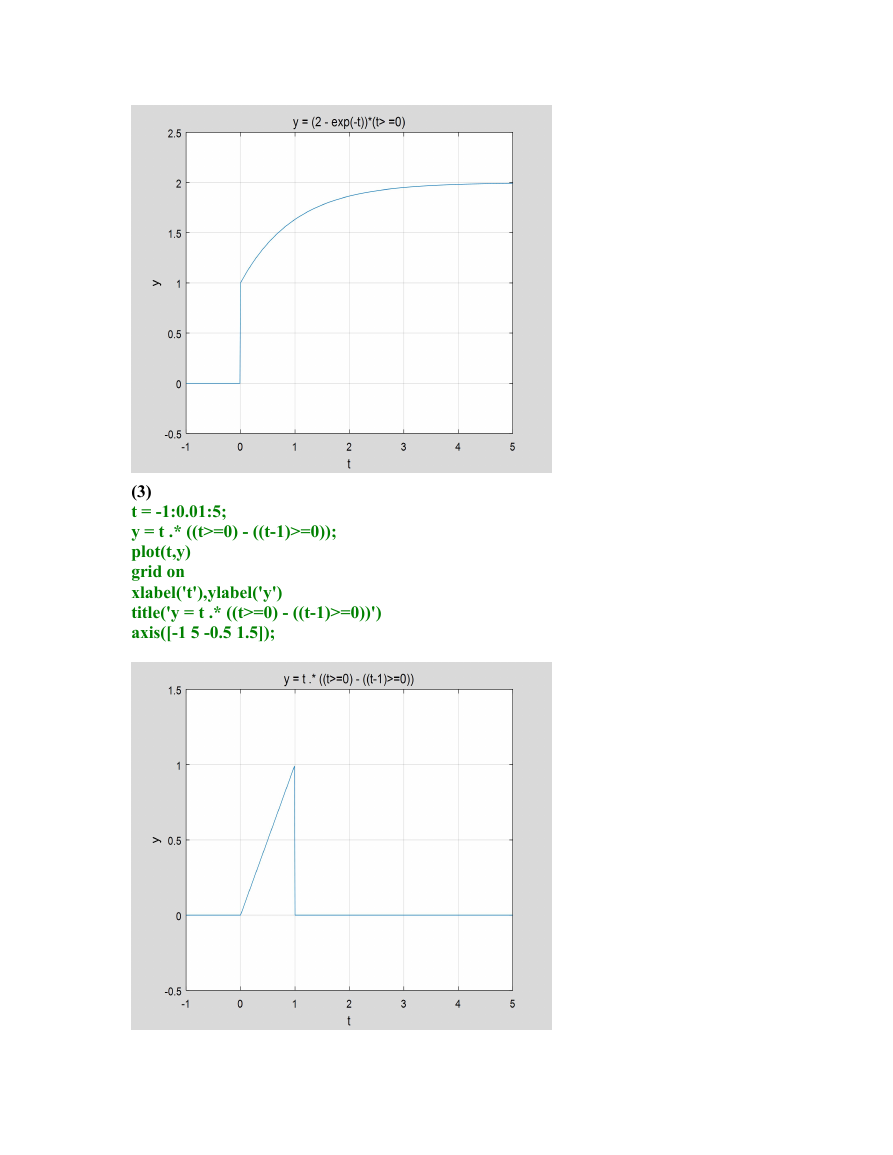
(2)
t = -1:0.01:5;
y = (2 - exp(-t)) .* (t>=0);
plot(t,y)
grid on
xlabel('t'),ylabel('y')
title('y = (2 - exp(-t))*(t> =0)')
axis([-1 5 -0.5 2.5]);
�
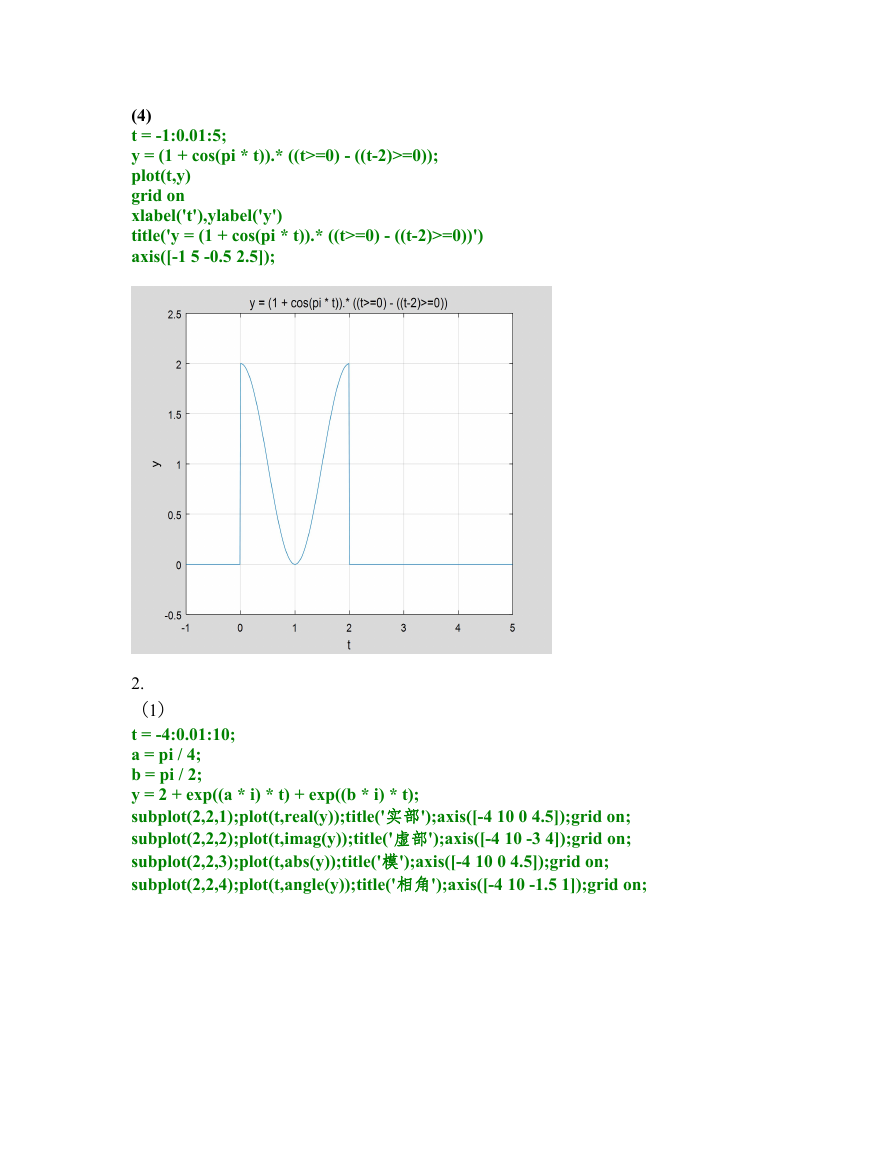
(3)
t = -1:0.01:5;
y = t .* ((t>=0) - ((t-1)>=0));
plot(t,y)
grid on
xlabel('t'),ylabel('y')
title('y = t .* ((t>=0) - ((t-1)>=0))')
axis([-1 5 -0.5 1.5]);
�
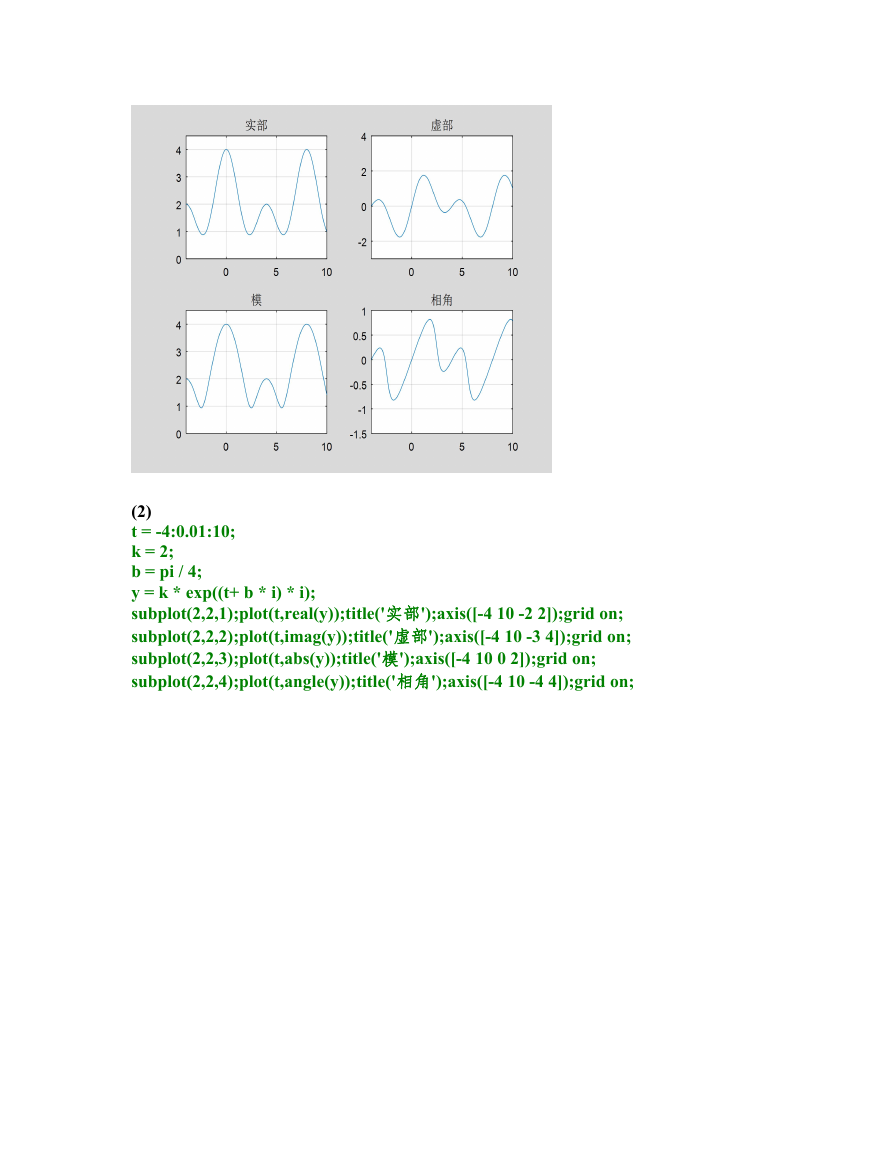
(4)
t = -1:0.01:5;
y = (1 + cos(pi * t)).* ((t>=0) - ((t-2)>=0));
plot(t,y)
grid on
xlabel('t'),ylabel('y')
title('y = (1 + cos(pi * t)).* ((t>=0) - ((t-2)>=0))')
axis([-1 5 -0.5 2.5]);
2.
(1)
t = -4:0.01:10;
a = pi / 4;
b = pi / 2;
y = 2 + exp((a * i) * t) + exp((b * i) * t);
subplot(2,2,1);plot(t,real(y));title('实部');axis([-4 10 0 4.5]);grid on;
subplot(2,2,2);plot(t,imag(y));title('虚部');axis([-4 10 -3 4]);grid on;
subplot(2,2,3);plot(t,abs(y));title('模');axis([-4 10 0 4.5]);grid on;
subplot(2,2,4);plot(t,angle(y));title('相角');axis([-4 10 -1.5 1]);grid on;
�
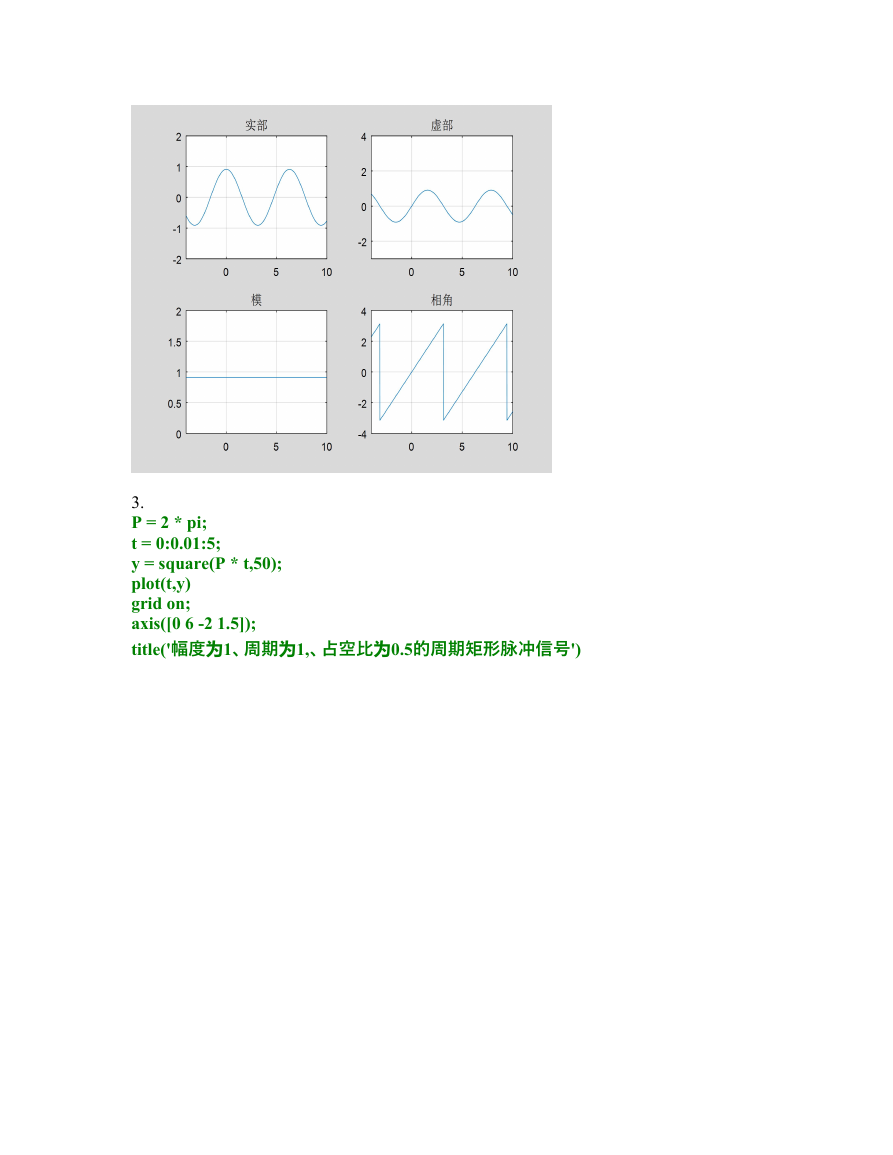
(2)
t = -4:0.01:10;
k = 2;
b = pi / 4;
y = k * exp((t+ b * i) * i);
subplot(2,2,1);plot(t,real(y));title('实部');axis([-4 10 -2 2]);grid on;
subplot(2,2,2);plot(t,imag(y));title('虚部');axis([-4 10 -3 4]);grid on;
subplot(2,2,3);plot(t,abs(y));title('模');axis([-4 10 0 2]);grid on;
subplot(2,2,4);plot(t,angle(y));title('相角');axis([-4 10 -4 4]);grid on;
�
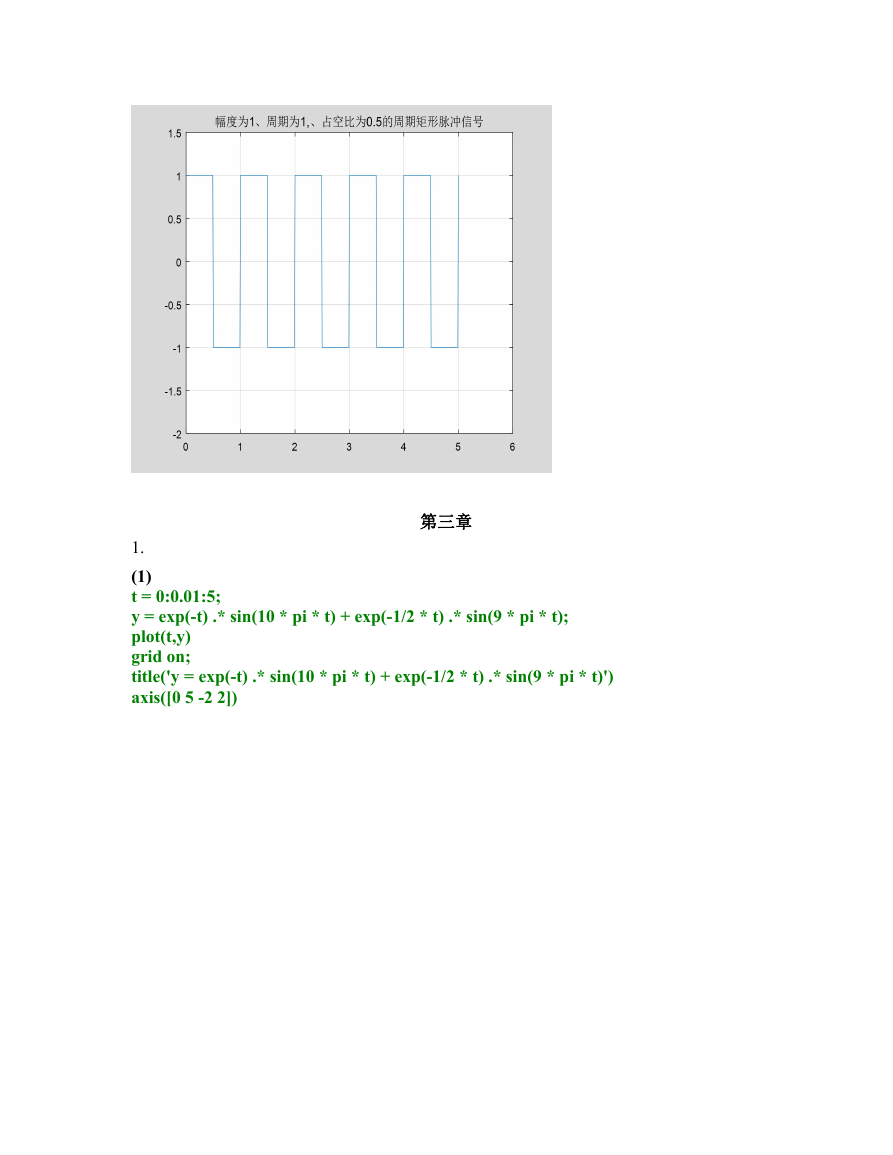
3.
P = 2 * pi;
t = 0:0.01:5;
y = square(P * t,50);
plot(t,y)
grid on;
axis([0 6 -2 1.5]);
title('幅度为1、周期为1,、占空比为0.5的周期矩形脉冲信号')
�
第三章
1.
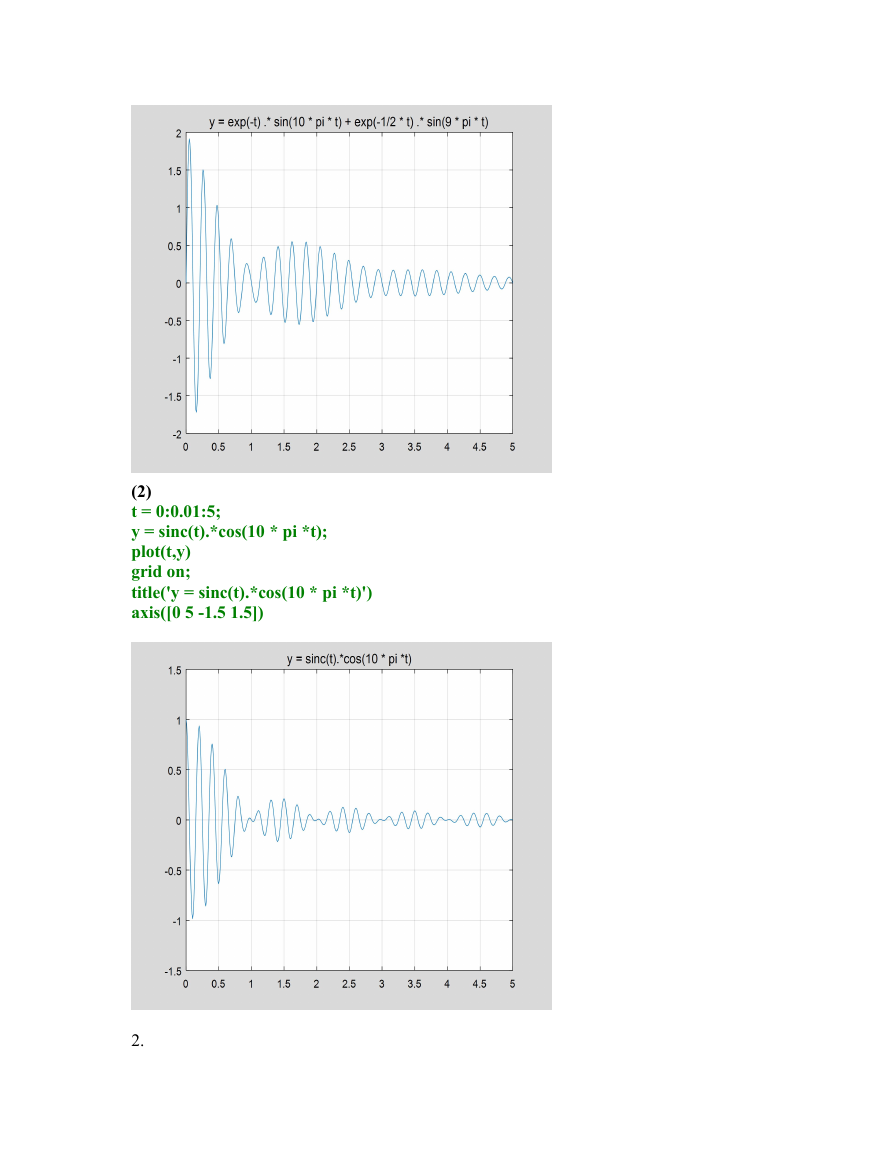
(1)
t = 0:0.01:5;
y = exp(-t) .* sin(10 * pi * t) + exp(-1/2 * t) .* sin(9 * pi * t);
plot(t,y)
grid on;
title('y = exp(-t) .* sin(10 * pi * t) + exp(-1/2 * t) .* sin(9 * pi * t)')
axis([0 5 -2 2])
�
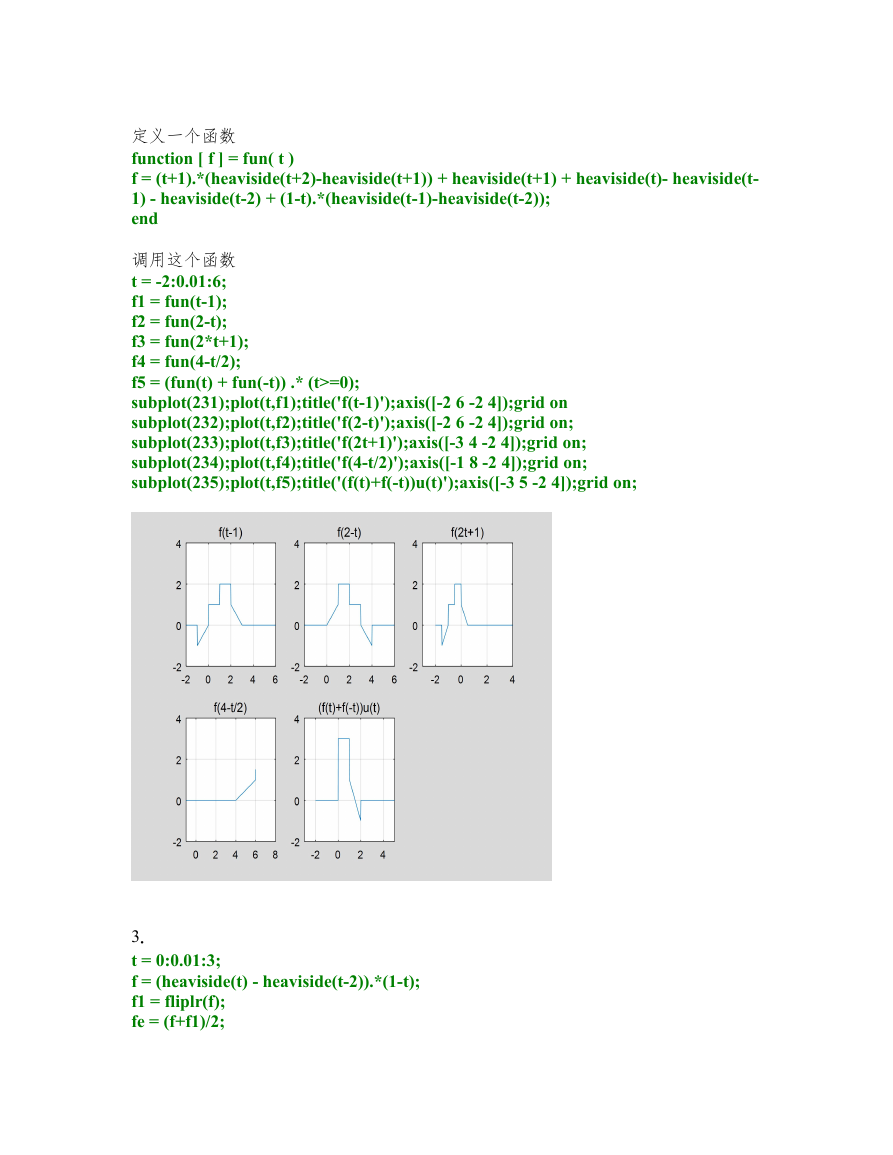
(2)
t = 0:0.01:5;
y = sinc(t).*cos(10 * pi *t);
plot(t,y)
grid on;
title('y = sinc(t).*cos(10 * pi *t)')
axis([0 5 -1.5 1.5])
2.
�
定义一个函数
function [ f ] = fun( t )
f = (t+1).*(heaviside(t+2)-heaviside(t+1)) + heaviside(t+1) + heaviside(t)- heaviside(t-
1) - heaviside(t-2) + (1-t).*(heaviside(t-1)-heaviside(t-2));
end
调用这个函数
t = -2:0.01:6;
f1 = fun(t-1);
f2 = fun(2-t);
f3 = fun(2*t+1);
f4 = fun(4-t/2);
f5 = (fun(t) + fun(-t)) .* (t>=0);
subplot(231);plot(t,f1);title('f(t-1)');axis([-2 6 -2 4]);grid on
subplot(232);plot(t,f2);title('f(2-t)');axis([-2 6 -2 4]);grid on;
subplot(233);plot(t,f3);title('f(2t+1)');axis([-3 4 -2 4]);grid on;
subplot(234);plot(t,f4);title('f(4-t/2)');axis([-1 8 -2 4]);grid on;
subplot(235);plot(t,f5);title('(f(t)+f(-t))u(t)');axis([-3 5 -2 4]);grid on;
3.
t = 0:0.01:3;
f = (heaviside(t) - heaviside(t-2)).*(1-t);
f1 = fliplr(f);
fe = (f+f1)/2;
�


 2023年江西萍乡中考道德与法治真题及答案.doc
 2012年重庆南川中考生物真题及答案.doc
 2013年江西师范大学地理学综合及文艺理论基础考研真题.doc
 2020年四川甘孜小升初语文真题及答案I卷.doc
 2020年注册岩土工程师专业基础考试真题及答案.doc
 2023-2024学年福建省厦门市九年级上学期数学月考试题及答案.doc
 2021-2022学年辽宁省沈阳市大东区九年级上学期语文期末试题及答案.doc
 2022-2023学年北京东城区初三第一学期物理期末试卷及答案.doc
 2018上半年江西教师资格初中地理学科知识与教学能力真题及答案.doc
 2012年河北国家公务员申论考试真题及答案-省级.doc
 2020-2021学年江苏省扬州市江都区邵樊片九年级上学期数学第一次质量检测试题及答案.doc
 2022下半年黑龙江教师资格证中学综合素质真题及答案.doc